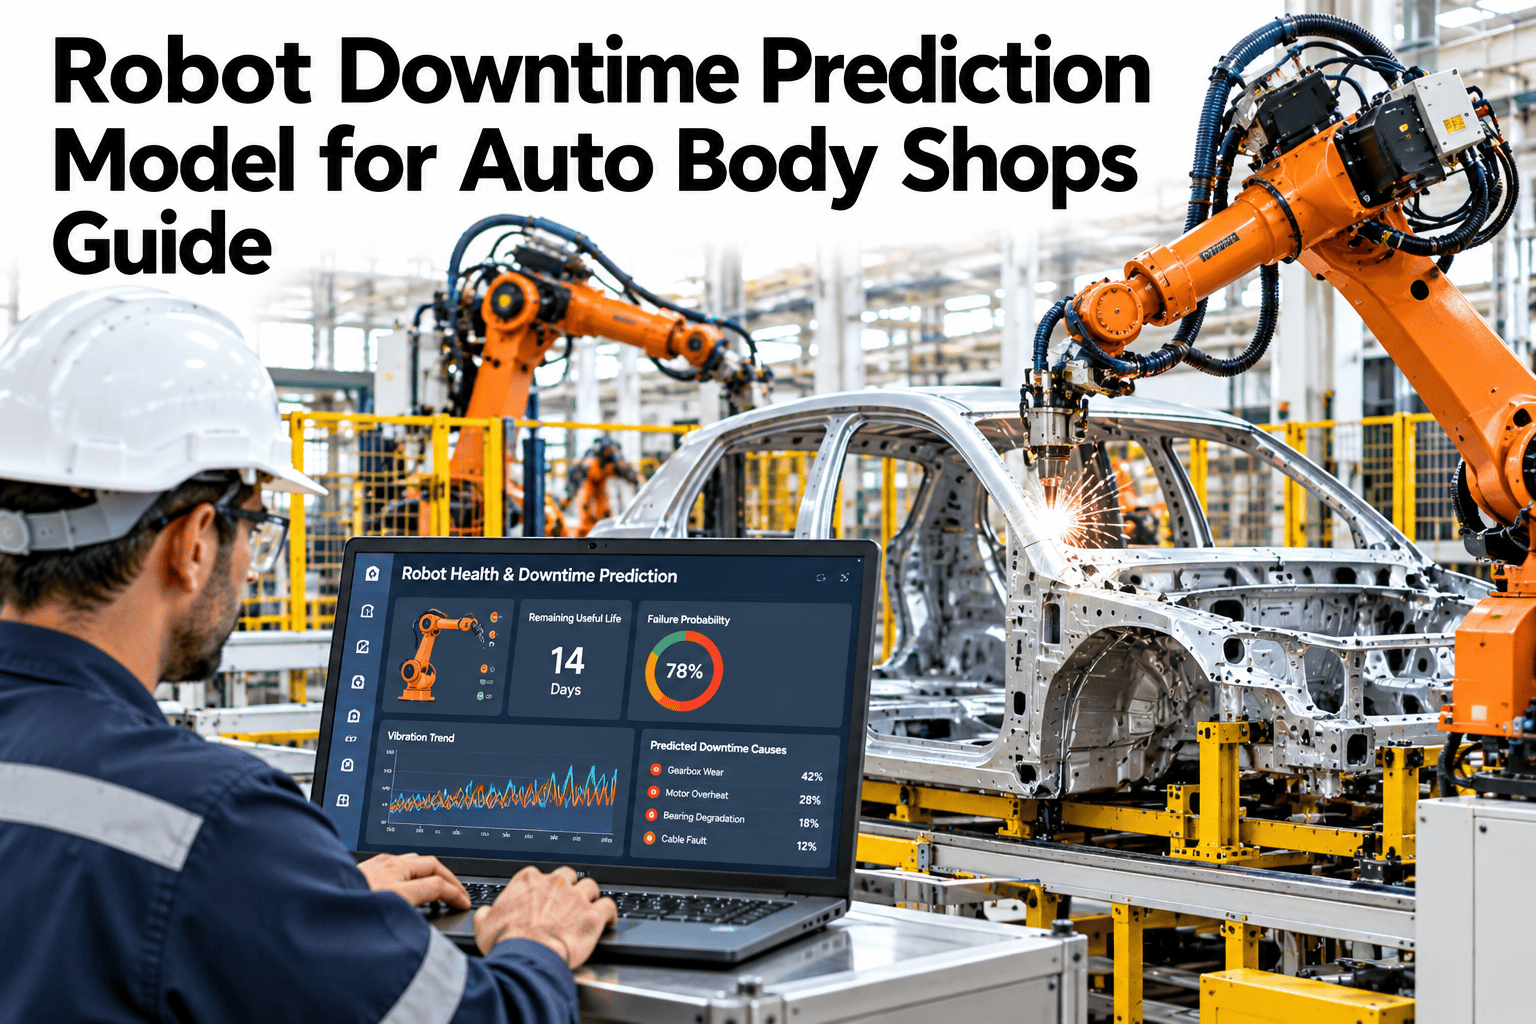
In a body shop, a robot that stops takes the whole cell with it, and often the line behind it. Calendar-based maintenance replaces parts that are fine and still misses the ones that fail early, because wear depends on duty cycle, not on the date. A downtime prediction model replaces the calendar with evidence, estimating how likely a stop is, how much useful life a component has left and what to do next. Body shops exploring this can ask iFactory AI how robot downtime is predicted across a fleet.
Predict Robot Downtime Before It Stops the Body Shop
iFactory AI combines event probability, remaining useful life and a recommended next action for every robot, so maintenance lands in a planned window instead of a line stop.
From Robot Signals to a Maintenance Action
A useful model is a short chain, from raw signals to a decision. Each link must be explainable to the maintenance team.
The Three Outputs and How to Use Them
A single risk score is not enough. Three outputs answer three different questions.
| Output | What It Tells You | How to Use It |
|---|---|---|
| Event probability | How likely a stop or fault is in a set time window | Rank robots and decide what to inspect first |
| Remaining useful life | How much working life a component has left | Plan parts and the next window to replace it |
| Prescriptive next action | What to do, by when and with which part | Create the work order with the right scope |
What to Watch on a Body Shop Robot
Robots wear in a few predictable places. Watching them directly gives the model its strongest evidence.
Servo motors and drives
Rising current, temperature or torque ripple can signal wear or load changes before a fault.
Gearboxes and reducers
Vibration changes and backlash growth often mark wear in joints that carry heavy loads.
Cables and dress packs
Repeated flexing causes breaks, so signal noise and flex counts are early clues.
Tooling and weld guns
Cycle time drift and weld quality changes point to tip wear and tool issues.
Which Signals Reveal Which Failure
Different failures speak through different signals. The matrix, shown as an illustration, helps decide what to collect first.
| Failure Mode | Motor Current | Vibration | Cycle Time Drift |
|---|---|---|---|
| Gearbox wear | Moderate | High | Moderate |
| Servo or drive degradation | High | Moderate | Moderate |
| Cable or connector fault | Moderate | Low | High |
| Tooling wear | Moderate | Low | High |
| Brake or encoder issue | High | Moderate | Moderate |
Find the Robots Most Likely to Stop Next
Book a 30-minute session and iFactory AI will review your robot fleet, stop history and available signals to show where prediction can help first.
Calendar Maintenance or Predictive Maintenance
Calendars treat every robot alike. Prediction treats each one according to how hard it has worked.
Where the Model Gets Its Strength
Not every signal is equally useful. The chart shows an illustrative ranking of evidence quality.
How Prediction Maturity Grows
Fleets move through clear stages. Knowing yours shows the next realistic step.
Building a Robot Prediction Pilot in Four Steps
A first pilot works best on a small group of important robots.
Pick eight to twelve robots on critical cells.
Bring controller and drive data into one place.
Let the model learn each robot's normal behaviour.
Review flagged robots weekly and record what is found.
Weekly Robot Health Review Checklist
Run this list at the weekly maintenance meeting. Each box should be answerable from the dashboard.
A Composite Scenario: The Reducer That Gave Notice
This is a composite example, not a named plant. It shows how trends turn into a planned repair.
What iFactory AI Adds to Robot Maintenance
iFactory AI is smart manufacturing and industrial software for automotive plants. Explore robot health monitoring in a live product tour on realistic fleet data.
Review of Robot Downtime Prediction
A practical review of what makes prediction trustworthy on a body shop floor, written as editorial guidance rather than a named expert quote.
Start with critical cells
Prediction pays back first where a stop halts the whole line.
Explain every flag
Maintenance trusts a warning that shows the trend behind it.
Record what you find
Every inspection result teaches the model and sharpens the next alert.
Frequently Asked Questions
What is a robot downtime prediction model?
It estimates how likely a robot is to stop soon, how much life its key components have left and what action to take. See these outputs for a live robot in a short demo. It replaces fixed calendars with condition evidence.
How early can a robot failure be predicted?
It depends on the failure. Gradual wear in reducers or cables often shows weeks of warning, while sudden electrical faults give little. A fair goal is catching the slow ones early.
What data do we need?
Controller and drive signals such as current, torque, temperature and cycle times, plus fault and repair history. Ask support what your robot controllers can already provide before adding hardware. Many fleets already log much of it.
Will it replace our maintenance planning?
No. It guides priorities and timing, while the team decides and performs the work. Their findings also improve later predictions.
How soon can we see value?
Many shops see useful flags within weeks of connecting a first group of robots. Book time to scope a robot prediction pilot on critical cells. A clear catch makes the case for wider rollout.
Turn Robot Stops Into Planned Maintenance
iFactory AI ranks every robot by risk and tells you what to do and when, so the body shop keeps moving. Book a walkthrough to see it on your own fleet.