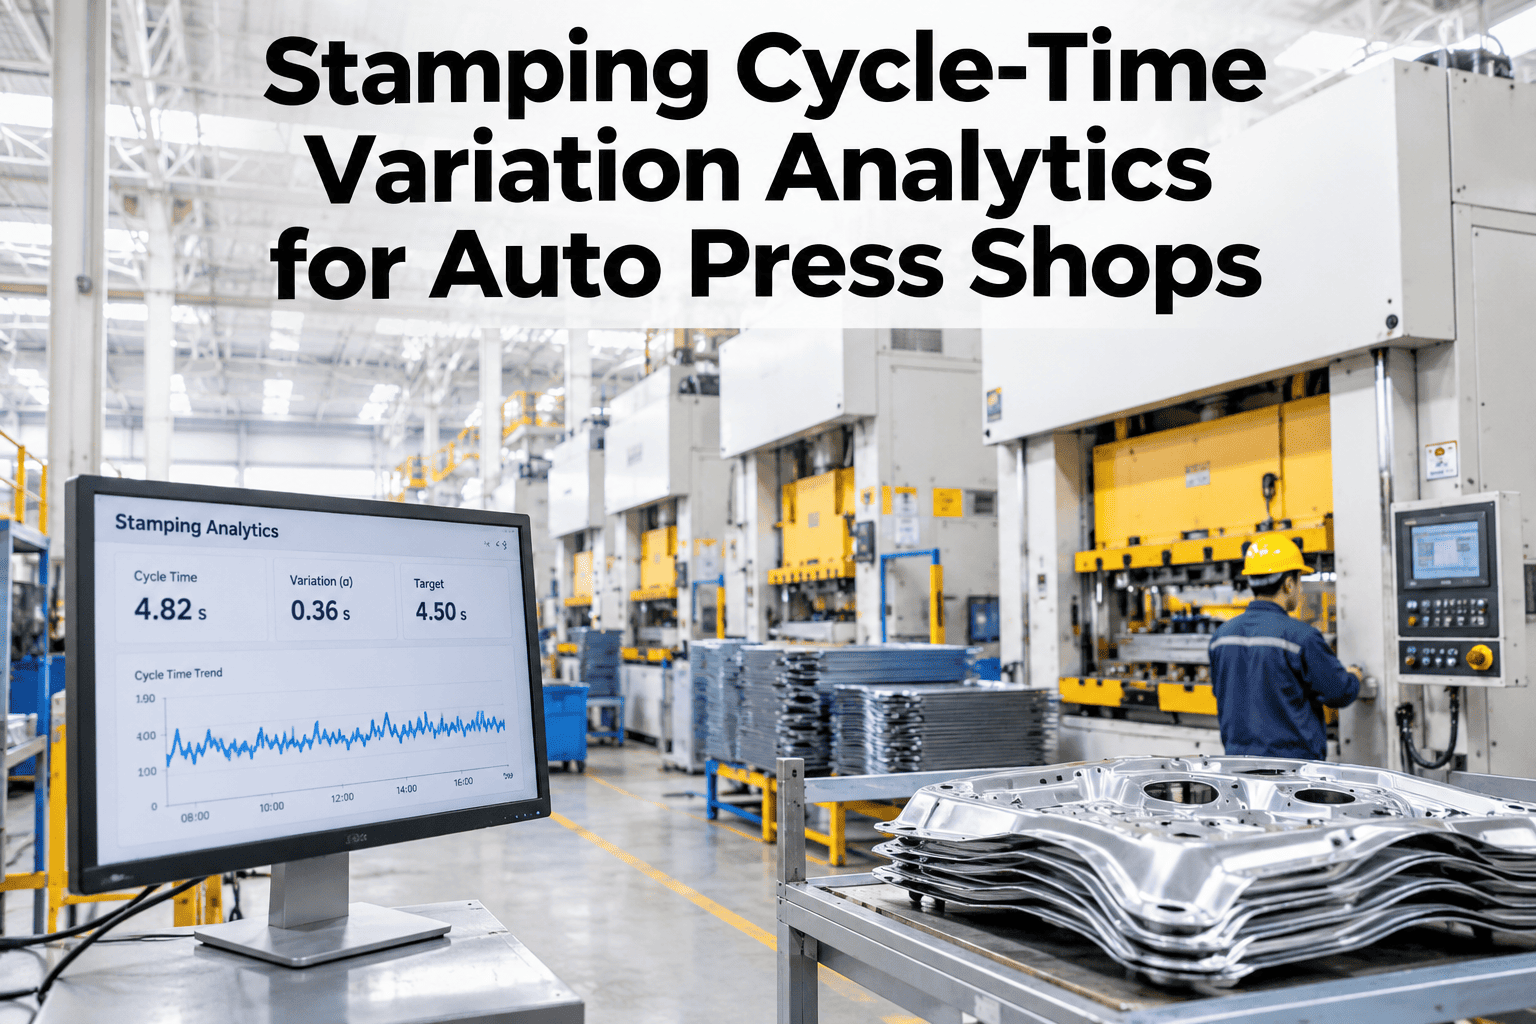
A stamping press running at 92% of its rated strokes per minute does not look broken on any standard dashboard — but across a 10-hour shift it produces 8% fewer parts than the schedule assumed, and nobody can explain why without pulling stroke logs that most plants have never analysed beyond total count. Cycle-time variation in automotive stamping is one of the largest hidden OEE losses in a press shop: the press is running, the die is in, but each stroke takes fractionally longer than the nominal cycle, and that variation compounds into meaningful throughput gaps by the time the shift report is written. SPC-style cycle monitoring, variability decomposition, and root-cause attribution give press shop ops teams the tools to see this loss in real time and trace it to its source. Teams that want to see this built for their own press data can book a session with iFactory AI at no cost.
See Every Stroke That Slowed the Press — Before the Shift Report Hides It
iFactory AI applies SPC-style cycle monitoring to every press stroke, decomposes variability into assignable causes, and attributes root cause to die, material, speed setting, or mechanical drift.
What Is Stamping Cycle-Time Variation and Why Does It Cost OEE?
Stamping cycle-time variation is the deviation of individual press stroke durations from the nominal cycle time for the current die and speed setting. It is measured at the stroke level — not the shift level — because variation that averages out over a shift still represents real throughput loss that disappears in a shift-level report.
A 1,000-ton transfer press running a body side outer at a nominal 8-second cycle loses 112 parts per hour if the average actual cycle is 8.9 seconds — a 10% Performance loss on the OEE calculation. That loss does not show as a downtime event. It does not trigger an alarm. It appears only when someone compares actual stroke count to the theoretical maximum for the hours run — and even then, without stroke-level data, the cause is unknown. Industry data shows that Performance losses (speed and micro-stop) account for 30–45% of total OEE loss in automotive stamping (iFactory Automotive OEE Benchmarks, 2026), and cycle-time variation is a primary driver.
SPC-Style Cycle Monitoring: How It Works
Statistical Process Control applied to press cycle times treats each stroke as a measurement — applying control limits, detecting systematic shifts, and distinguishing common-cause variation (inherent to the press and die) from special-cause variation (attributable to a specific factor that has changed). The approach gives ops teams the same rigour that quality SPC provides for dimensional results, applied to throughput.
Variability Decomposition: Separating What Causes What
Knowing that cycle time has increased is useful. Knowing whether the increase is from the die, the material, the speed controller, or mechanical drift is actionable. Variability decomposition breaks the total measured variation into attributed components — pointing maintenance and process engineering teams directly to the source.
| Variation Source | Typical Magnitude | Detection Method | Corrective Action |
|---|---|---|---|
| Die lubrication flow drop | +5–15% cycle time increase; onset gradual over 20–40 strokes | Cycle time trending up correlated with lube flow sensor signal | Restore lube flow; check nozzle condition; purge if contaminated |
| Speed setpoint drift | +3–8%; step-change when setpoint drifts or is changed by operator | Step-change in cycle time coinciding with speed controller log event | Restore setpoint; investigate cause of controller drift |
| Die wear (forming force increase) | +2–6%; gradual onset over hundreds of strokes | Cycle time trending up correlated with tonnage monitor trend increase | Flag die for inspection; schedule change when OEE impact crosses threshold |
| Material thickness variation | +3–10%; coil-lot-correlated onset | Cycle time shift correlated with coil lot change timestamp | Verify incoming material spec; notify purchasing if systematic |
| Counterbalance pressure drift | +4–12%; gradual onset with cyclical pattern | Cycle time variation with periodic waveform pattern from pressure oscillation | Adjust counterbalance pressure to specification; check accumulator |
Find the 8–15% Throughput Gap Hidden in Your Stroke Data
iFactory AI monitors every press stroke, detects UCL breaches in real time, and decomposes variation to its assignable cause — converting invisible Performance loss into a named, fixable problem.
Root-Cause Attribution: From Signal to Action
Variability decomposition produces a ranked attribution — the primary, secondary, and tertiary contributors to the measured variation in the current run. This ranking is what converts a cycle-time monitoring system from a reporting tool into a maintenance dispatch system.
Frequently Asked Questions
What data inputs does stroke-level cycle monitoring require?
The minimum inputs are a stroke counter signal and a timestamp from the press PLC, plus the nominal cycle time for the current die-speed combination. Supporting signals — lube flow, tonnage, counterbalance pressure, and speed setpoint — enable cause attribution beyond simple variation detection. Book a session to review your PLC signal availability before any commitment.
How does the system distinguish cycle-time variation from genuine micro-stops?
Micro-stops (press pauses of 1–30 seconds) and cycle-time variation (each stroke running longer) appear differently in the stroke timestamp data. A micro-stop produces a gap in the stroke log; variation produces a consistent elevation in per-stroke duration. iFactory AI separates both and attributes them to different OEE loss categories. Ask our team how micro-stop and cycle variation are reported on the same dashboard.
Can the control limits be set per die, or only per press?
Control limits are set per die-press-speed combination — because the same press running a different die at a different speed has a different natural variation distribution. A single press-level limit would generate excessive false alarms on complex dies and miss genuine signals on simple ones. See how per-die control limits are configured in a live walkthrough.
How is the output delivered to press shop ops teams?
Ops teams see a real-time cycle trend view on the press-side display and a shift summary on the shop supervisor dashboard, with attributed loss by cause category. UCL breaches generate an immediate alert and an auto-drafted work order with the attributed cause pre-populated. Ask our team how the display layout is configured for your shop floor setup.
Does cycle-time monitoring work on older press controllers without modern PLCs?
Yes. On presses without a modern PLC, iFactory AI uses an optical stroke counter or a current signature sensor on the main drive motor to derive a stroke timestamp — giving the same per-stroke resolution without controller replacement. Book a session to discuss the connection approach for your press vintage and controller type.
Stop Losing Throughput to Variation Nobody Can See
iFactory AI monitors every stroke, detects UCL breaches in real time, and attributes variation to its source — converting invisible Performance loss into a named, correctable problem. Book a session built around your press shop data.