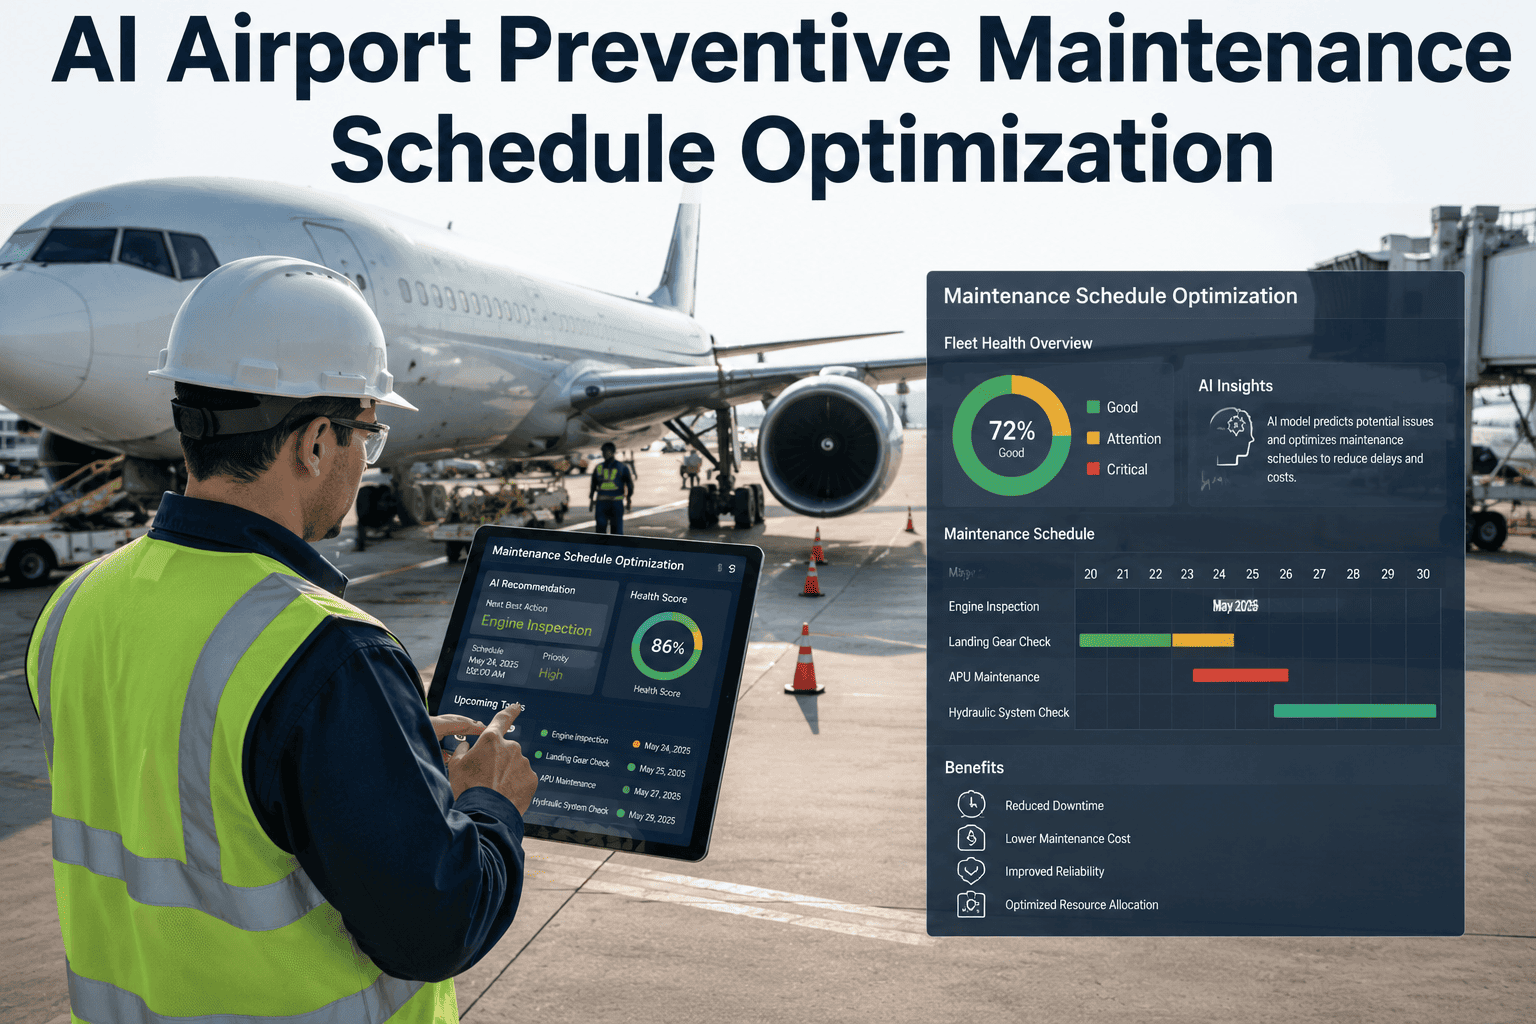
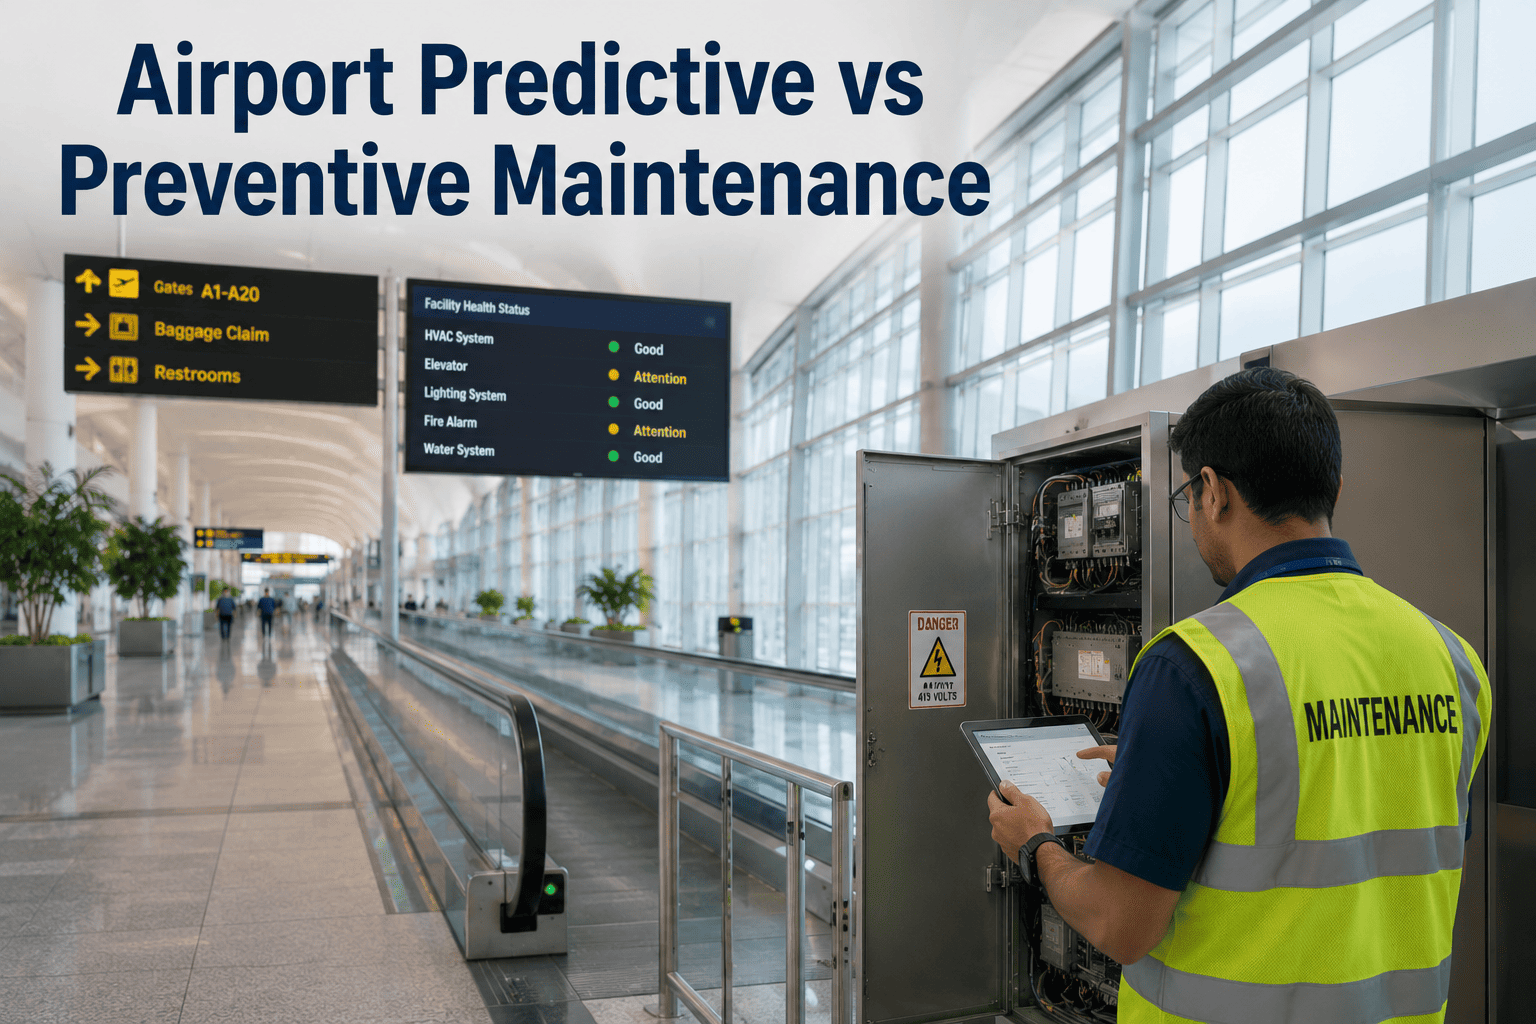
Most airport maintenance programs still run on a calendar that has nothing to do with how equipment actually ages. A jet bridge hydraulic pump gets torn down every ninety days whether its seals are degrading or not, while a baggage belt motor two gates over quietly develops a bearing fault that no fixed interval was scheduled to catch until it fails mid-bank. Fixed preventive maintenance intervals were built for a world without sensor data, and they solve the wrong problem — they guarantee attention on a schedule instead of guaranteeing attention where it is actually needed. AI-driven schedule optimization replaces the calendar with a model built from real asset condition, failure history, criticality, and the airport's own operational windows, and teams that want to see what that model reveals about their current asset base can start at iFactory support.
AI Maintenance Scheduling · Airport Operations
Airport Preventive Maintenance Schedule Optimization Driven by AI, Not by Calendar Dates
Fixed-interval PM protects against total failure but wastes labor on healthy equipment and still misses condition-driven breakdowns between visits. iFactory rebuilds the schedule around condition, criticality, failure history, and real operational windows — so maintenance happens exactly when it should, not just when the calendar says so.
Fixed Calendar PM
Day 30
Day 60
Day 90
Day 120
AI-Optimized PM
Skipped
Skipped
Flagged Day 71
Skipped
Why The Calendar Still Wins By Default
Four Reasons Fixed-Interval PM Persists Even Though Everyone Knows Its Limits
Airport reliability teams rarely defend fixed-interval PM on its merits. They defend it because it is the only scheduling method that does not require condition data, a model, or a change to a maintenance planning process that has been running the same way for a decade. That default has a real cost, and it shows up in four recurring patterns across terminal, airfield, and ground support maintenance programs.
01
Every Asset Ages On The Same Line
A fixed interval assumes a jet bridge used at a high-turn international gate wears at the same rate as one at a low-frequency regional gate. It does not, so one gets serviced too often and the other not often enough, on the exact same calendar entry.
02
Healthy Equipment Absorbs The Labor Budget
Technicians spend a meaningful share of scheduled hours opening up equipment that shows no sign of degradation, simply because the date arrived, while assets with active condition warnings wait for their own turn on the calendar.
03
Failures Still Happen Between Visits
A ninety-day interval offers no protection on day forty-five. Bearing wear, seal degradation, and electrical connection loosening do not wait for the next scheduled date, which is why fixed PM programs still see unplanned failures despite full compliance.
04
Operational Windows Get Ignored
A calendar date does not know that the terminal has three widebody arrivals scheduled that afternoon. Fixed PM frequently lands maintenance crews in the middle of peak operational periods simply because that is when the interval expired.
How The Engine Builds A Schedule
From Raw Asset Data To A Published Work Order Calendar
Step 1
Asset Registry And Baseline
Every monitored asset — jet bridges, baggage handling motors, HVAC units, escalators, electrical switchgear — is loaded into a structured registry with its manufacturer specifications, install date, and existing maintenance history as a starting baseline.
Step 2
Condition Data Ingestion
Sensor feeds, inspection reports, and prior work order data are continuously pulled into the platform, building a rolling condition score that updates as new readings and technician observations arrive.
Step 3
Failure Probability Modeling
The model compares current condition trends against historical failure curves for the same asset class, generating a probability window for when intervention becomes necessary rather than a fixed countdown date.
Step 4
Criticality Weighting
Assets flagged as operationally critical are prioritized in the queue ahead of redundant or low-impact equipment showing a similar condition trend, ensuring limited technician hours go to the highest-consequence risk first.
Step 5
Operational Window Matching
Recommended service dates are checked against the terminal's flight schedule and gate utilization data, shifting the proposed window to a period of lower operational impact wherever the failure probability allows the delay.
Step 6
Work Order Publication
A finalized work order is issued to the maintenance planning system with asset location, recommended action, priority level, and the reasoning behind the scheduled date, giving planners a decision they can audit rather than a date they must trust blindly.
Every Fixed-Interval Visit On A Healthy Asset Is Labor You Cannot Spend On The One That Is Actually Failing
See what an optimized schedule looks like against your own asset registry before committing to a platform change.
Fixed PM vs Condition-Based Scheduling
What Actually Changes When The Calendar Is Replaced
Factor
Fixed-Interval PM
AI-Optimized Scheduling
Trigger For Service
Calendar date reached, regardless of condition
Condition trend crosses a modeled risk threshold
Labor Allocation
Spread evenly across all assets on schedule
Weighted toward highest condition risk and criticality
Between-Visit Failures
Unprotected until the next scheduled date arrives
Flagged as soon as condition data crosses the threshold
Operational Timing
Set by calendar date, independent of flight schedule
Matched to actual low-traffic operational windows
Audit Trail
Date compliance record with limited condition context
Full reasoning trail linking data, model, and decision
Parts Consumption
Replaced on schedule even when remaining life is high
Replaced closer to actual end of usable service life
Reported Program Outcomes
What Reliability Teams See Across The First Year
01
Fewer
Unnecessary Service Visits
Assets showing healthy condition trends are pushed further out on the schedule, reducing visits performed purely because a date arrived.
02
Earlier
Detection Between Old Intervals
Condition thresholds catch developing faults on the days a fixed calendar would have offered zero coverage at all.
03
Lower
Peak-Hour Maintenance Conflicts
Recommended windows shift around known high-traffic gate and terminal periods instead of landing inside them by coincidence.
04
Longer
Usable Component Life
Parts are replaced closer to actual end of service life rather than on a fixed countdown that discards remaining usable life.
05
Clearer
Budget Justification
Every scheduled work order carries a documented condition and criticality reason, supporting maintenance budget requests with data rather than a compliance percentage alone.
06
Higher
Technician Time On High-Risk Assets
Hours previously spent on low-risk fixed visits are redirected to assets the model flags as approaching a real failure window.
Field Example
Reworking A Jet Bridge Fleet Off A Ninety-Day Fixed Interval
A mid-size international airport was maintaining its full jet bridge fleet on an identical ninety-day service interval regardless of gate utilization, which meant bridges at the busiest international gates and bridges at low-frequency regional gates were pulled offline for service on the same schedule. Two unplanned hydraulic failures in one quarter occurred on bridges that had passed their fixed inspection only five weeks earlier, both at high-turn gates.
The reliability team moved the fleet onto condition-based scheduling built from hydraulic pressure trends, cycle counts per gate, and prior failure history for each individual bridge rather than the fleet average. The model immediately separated the bridges into distinct risk tiers instead of one shared interval, and flagged two additional bridges showing early seal degradation that were more than a month away from their next fixed-interval date.
Maintenance windows for the flagged bridges were scheduled into confirmed low-traffic periods rather than fixed calendar dates, and the two developing seal issues were repaired before either produced an operational failure. Service frequency on the lowest-utilization bridges in the fleet was extended without incident, freeing technician hours that were redirected to the highest-risk gates the following quarter.
2 bridges
Seal degradation caught before failure
0
Unplanned hydraulic failures next quarter
Extended
Service interval on lowest-utilization bridges
Frequently Asked Questions
What Airport Maintenance Planners Ask Before Making The Switch
Does condition-based scheduling replace regulatory-mandated inspection intervals?
No. Certain inspections tied to FAA or airport authority requirements remain fixed regardless of condition data, and any optimization platform needs to respect those mandated dates rather than override them. What changes is everything outside that mandated floor — routine servicing, part replacement timing, and non-regulatory inspection frequency all shift to a condition-driven model, while regulatory compliance dates are tracked and enforced separately inside the same system. Airports typically keep a hybrid structure where mandated intervals are locked and everything else is optimized around them. Teams scoping this separation can walk through it with
iFactory support.
What happens to assets that have no sensors installed on them?
Assets without connected sensors are not excluded from optimization — they are scheduled using inspection-based condition inputs, technician observations logged at each visit, and comparative failure history from similar assets across the airport, which still produces a meaningfully sharper schedule than a flat calendar date. Sensor coverage is typically prioritized for the highest-criticality assets first, with inspection-driven scoring covering the rest of the registry until sensor deployment expands. This staged approach lets an airport start optimizing its full asset base on day one rather than waiting for full instrumentation.
How much historical maintenance data is needed before the model is useful?
The model begins generating condition scores as soon as an asset is registered and any existing work order history is imported, though accuracy improves meaningfully over the first several maintenance cycles as more real outcomes feed the failure probability curve. Airports migrating from an existing CMMS typically see immediate value from imported historical work orders alone, even before new sensor data starts accumulating. There is no minimum data threshold required to begin — the schedule simply becomes more precise the longer the system runs against real asset behavior.
Can the schedule account for a sudden change in flight volume or a new route?
Yes. Operational window matching pulls from current flight schedule and gate utilization data rather than a static traffic assumption, so a new route added to a gate or a seasonal change in flight volume shifts the criticality weighting and available maintenance windows for the assets affected. A gate moving from low to high utilization will see its associated jet bridge, baggage equipment, and HVAC assets re-weighted toward tighter monitoring automatically, without requiring a manual schedule rebuild from the maintenance team.
How long does it take to move an existing PM program onto this model?
Initial deployment typically runs four to six weeks, covering asset registry setup or import from an existing CMMS, integration with available sensor feeds and flight schedule data, and calibration of criticality tiers with the airport's reliability team before the first optimized schedule is published. Fixed regulatory intervals are mapped and locked during this same setup phase so nothing mandated slips through the transition. To scope a deployment timeline against your specific asset base,
book a demo.
Stop Servicing Healthy Equipment On A Date. Start Servicing What The Data Says Needs It.
AI-optimized preventive maintenance scheduling built from condition, failure history, criticality, and your real operational windows.