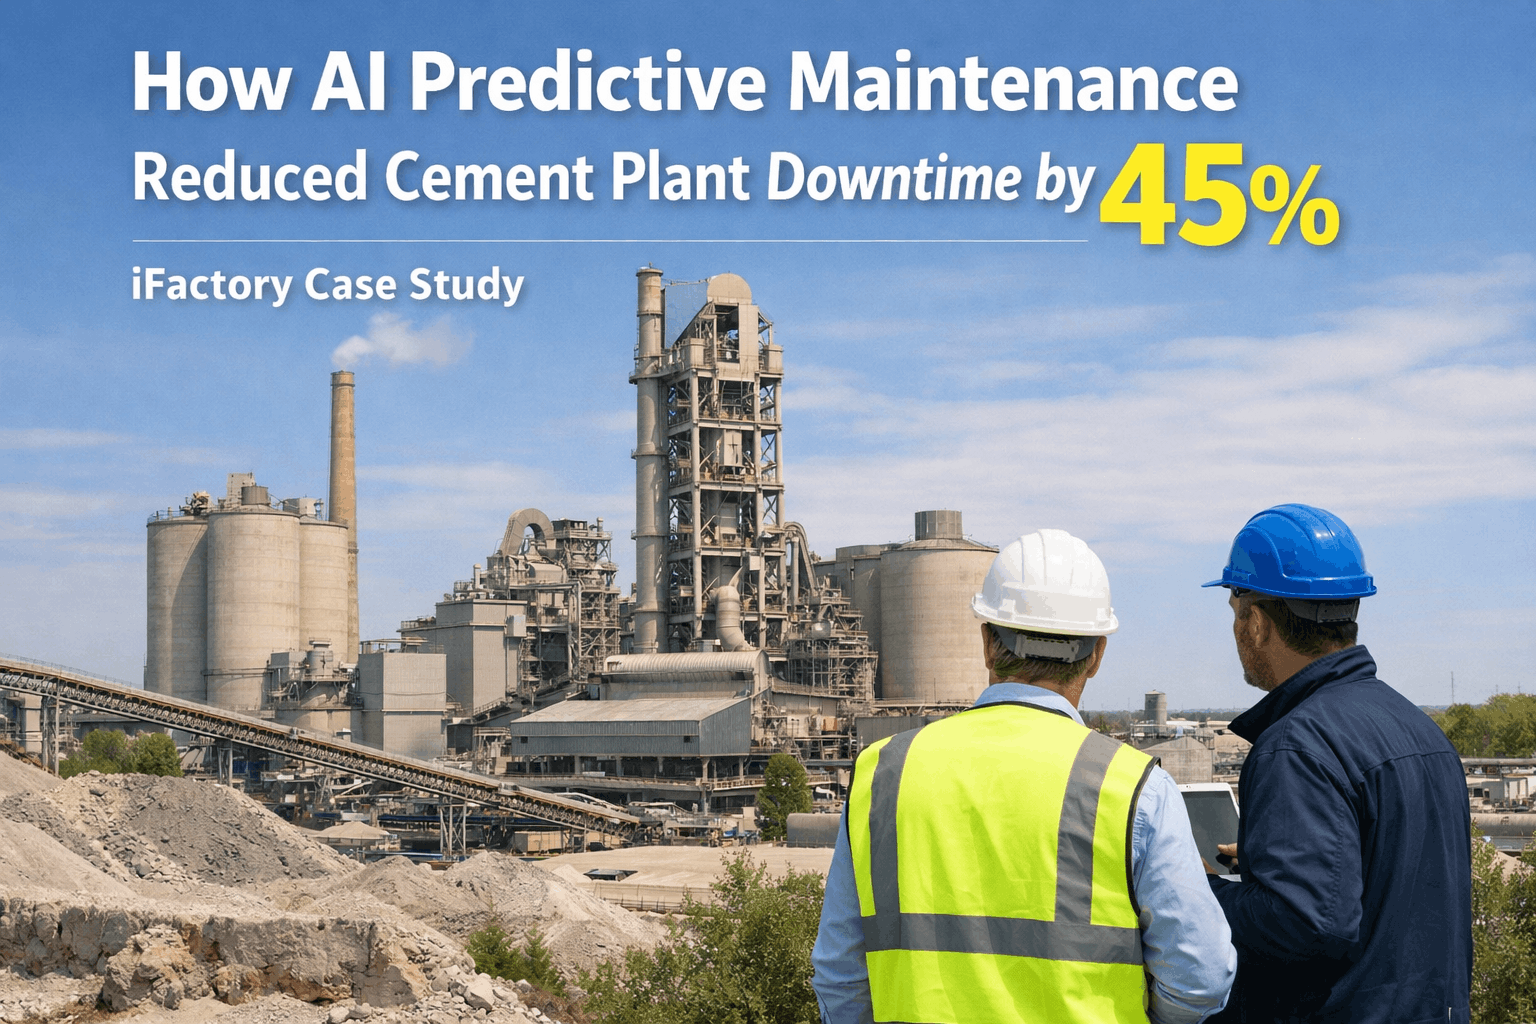
A cement plant rarely fails because of one dramatic event. It fails because three small warning signs — a kiln shell hot spot, a backlog of overdue lubrication rounds, and a near-miss in the raw mill area — sit in three different systems that never talk to each other. By the time a shift supervisor connects the dots, the plant has already lost a production day or, worse, someone has gotten hurt. iFactory's AI Operational Risk Dashboard pulls production, maintenance, quality, and safety signals into one continuously scored view, so plant leaders see where risk is actually building before it becomes an incident, and can act on it directly through iFactory support.
AI Risk Intelligence · Cement Plant Operations
One Risk Score for the Whole Plant, Updated Every Shift Instead of Once a Quarter
iFactory's Operational Risk Dashboard combines equipment condition, maintenance backlog, process deviation, and safety event data into a single prioritized risk view — so plant managers stop discovering problems after they've already cost a production day.
Kiln Refractory Zone 4
82
High Risk
Raw Mill Gearbox
57
Elevated
Clinker Cooler Grate
24
Stable
Why Risk Hides in Plain Sight
Most Cement Plants Track Risk in Four Separate Places That Never Get Compared
Production teams watch throughput and downtime logs. Maintenance teams watch work order backlog and CMMS alerts. Quality teams watch free lime and fineness trends. Safety teams watch incident reports and near-miss logs. Each function has a reasonable view of its own risk, but almost no plant has a single place where a reliability engineer or plant manager can see all four at once, ranked by how much they threaten this week's production plan. That gap is where costly surprises live — a bearing that was already flagged as degrading combines with a mill operator working a double shift and a slightly out-of-spec raw mix, and the combination is what actually causes the failure, not any single factor alone.
iFactory's risk dashboard was built specifically to close that gap. It doesn't replace the CMMS, the DCS historian, or the safety reporting system — it reads from all of them, applies a consistent scoring model across asset condition, process stability, and human factors, and presents plant leadership with one ranked list of what needs attention today, this week, and this quarter.
Four Risk Domains, One Score
How iFactory Builds a Composite Risk Score for Every Asset and Process Area
01
Production Risk
Throughput variance, unplanned stoppage frequency, and bottleneck drift across the pyroprocessing line are weighted against the current production plan so a slowdown in a critical-path asset scores higher than the same slowdown in a redundant one.
02
Maintenance Risk
Overdue preventive work orders, vibration and thermal trend deviations, and lubrication compliance gaps feed a condition score for every rotating and static asset, refreshed as new sensor and CMMS data arrives.
03
Quality Risk
Free lime excursions, fineness drift, and raw mix variability are tracked against control limits, since quality instability is frequently an early indicator of an upstream mechanical or process problem before it shows up as a failure.
04
Safety Risk
Near-miss frequency, overdue permit renewals, and confined space or hot work activity near flagged equipment are factored in, since degraded assets and elevated safety exposure very often occur in the same area at the same time.
Live Risk Matrix
Every Asset Plotted by Likelihood and Impact, Not Buried in a Spreadsheet Column
A number on a report is easy to skim past. A position on a matrix is not. iFactory plots every monitored asset and process area on a likelihood-versus-impact grid, so the handful of items that genuinely deserve attention this week are visually impossible to miss, instead of sitting as row 340 in a spreadsheet nobody opens.
Impact on Production
Silo Discharge Gate
Kiln Refractory Zone 4
ID Fan Bearing Set
Belt Scale Calibration
Raw Mill Gearbox
Preheater Cyclone Buildup
Packhouse Conveyor
Dust Collector Filter
Clinker Cooler Grate
Likelihood of Occurrence — Low to High
Stop Finding Out About Risk in the Monday Morning Meeting. Find Out While It's Still Small.
iFactory refreshes the plant-wide risk score continuously as new sensor, CMMS, quality, and safety data arrives, so the ranked list plant leadership sees is never more than a few hours stale.
Where the Signals Come From
Six Data Sources Feed the Composite Risk Score Every Shift
1
DCS and PLC historian data — kiln shell temperature, mill motor amperage, fan vibration, and preheater draft pressure trends are pulled continuously rather than sampled once a shift.
2
CMMS work order history — overdue preventive tasks, repeat corrective work orders on the same asset, and technician-reported findings are scored for how much backlog has accumulated on each equipment tag.
3
Condition monitoring sensors — vibration, thermal imaging, and oil analysis results on critical rotating equipment are compared against both fixed thresholds and each asset's own historical baseline.
4
Quality lab results — free lime, Blaine fineness, and raw mix chemistry results are checked for drift patterns that often precede a mechanical issue in the raw mill or kiln system by days or weeks.
5
Safety and permit systems — near-miss logs, overdue permits, and active hot work or confined space entries near already-flagged equipment raise the composite score for that zone.
6
Production scheduling data — the current run plan determines how much weight a given asset's risk score carries this week, since a redundant asset degrading matters less than a single-point-of-failure asset doing the same.
Before vs. After
Risk Visibility — Fragmented Reporting vs. iFactory Composite Scoring
Function
Fragmented Reporting
iFactory Risk Dashboard
Data Sources
Production, maintenance, quality, and safety data live in four separate systems
All four domains combined into one continuously updated composite score
Update Frequency
Risk reviewed in a weekly or monthly meeting using data that is already stale
Score recalculated continuously as new sensor, CMMS, and lab data arrives
Prioritization
Every function ranks its own list, and there is no shared view of what matters most
Single ranked list weighted against the current production plan for the whole plant
Early Warning
Combined risk factors are discovered only after an incident during root cause review
Compounding risk factors across domains are flagged while still small and separate
Accountability
Ownership of a cross-functional risk is unclear until it becomes an actual failure
Each flagged item is assigned an owner and tracked to closure inside the dashboard
Measured Outcomes
What Plant Leadership Sees After Deploying the Risk Dashboard
11 days
Average Early Warning Lead Time
Combining maintenance and process data typically surfaces a developing failure well over a week before it would have been caught by either domain alone.
34%
Fewer Unplanned Kiln Stoppages
Plants prioritizing the composite risk list instead of a single-department backlog report meaningful reductions in unplanned pyroprocessing line stoppages.
1 view
Consolidated From Four Systems
Production, maintenance, quality, and safety data are unified into a single ranked dashboard instead of four separate reports leadership has to reconcile manually.
19%
Reduction in Repeat Failures
Tracking flagged risks to a named owner and a closure date reduces the rate at which the same root cause reappears within the same quarter.
Under 4 hrs
Score Refresh Cycle
The composite risk score across all monitored assets and process areas recalculates well within a single shift, keeping the dashboard current for every handover.
42%
Faster Root Cause Identification
Having production, maintenance, quality, and safety history already correlated cuts the time investigators spend pulling data from separate systems after an event.
Field Case
Catching a Kiln Refractory Failure Eleven Days Before It Would Have Forced a Shutdown
A mid-sized cement plant running a single kiln line had a maintenance team that already knew Zone 4 refractory was wearing faster than expected, based on thermal imaging showing a gradual hot spot. Separately, the quality team was seeing intermittent free lime spikes that nobody had connected to the refractory finding, and the production team was quietly extending kiln feed rate to hit a monthly tonnage target. None of the three teams had flagged the combination as urgent on its own. iFactory's composite risk score, however, weighted all three signals together against the current production plan and pushed Zone 4 to the top of the plant-wide risk list eleven days before the hot spot would likely have progressed to a shell breach. The plant scheduled a controlled repair during an already-planned short stop instead of an emergency shutdown, avoiding both the unplanned downtime and the far larger repair scope a shell breach would have required.
11 daysAdvance warning before likely shell breach
3 domainsSignals correlated: maintenance, quality, production
0Emergency shutdowns required
Frequently Asked Questions
AI Operational Risk Dashboard — What Plant Managers Ask First
How is the composite risk score actually calculated?
Each asset or process area receives sub-scores across the four risk domains — production, maintenance, quality, and safety — based on how far current readings deviate from established baselines and control limits. Those sub-scores are then weighted according to the asset's role in the current production plan, so a bottleneck asset with a moderate deviation can outrank a redundant asset with a larger one. The composite score updates automatically as new data arrives from each connected system, rather than being recalculated manually.
Book a Demo to see the scoring model applied to your own plant data.
Do we need new sensors installed before this works?
In most cases, no. The dashboard is built to read from data your plant is already generating — DCS and PLC historian tags, CMMS work order records, quality lab results, and safety reporting logs. Where a specific asset would meaningfully benefit from additional condition monitoring, such as vibration sensing on a critical fan bearing, iFactory can recommend targeted instrumentation, but this is an enhancement rather than a prerequisite for getting the dashboard running.
Can the risk dashboard integrate with our existing CMMS and DCS systems?
Yes — iFactory connects to the major CMMS platforms and DCS or historian systems commonly used across cement operations through standard integration methods, and can also ingest quality lab and safety reporting data through file-based or API connections depending on what your current systems support. The goal is to sit on top of what you already run rather than replacing any of it.
Contact support to confirm compatibility with your specific system stack.
Who typically uses this dashboard day to day?
Plant managers and reliability engineers use it as their primary morning review tool to decide where to direct attention that shift, while maintenance planners use the underlying asset-level detail to justify prioritizing one work order ahead of another. Safety managers reference the safety sub-scores when deciding where extra oversight is warranted for planned hot work or confined space entries, and executives typically view a summarized version during periodic operational reviews.
How long does it take to get a working risk score for our plant?
A single-line cement plant with existing CMMS and DCS data already being logged typically has an initial composite risk view running within two to four weeks, covering data connection, baseline calibration against your historical performance, and validation against known recent incidents. Plants with multiple lines or less digitized quality and safety records generally take four to eight weeks depending on how much manual data cleanup is required.
Book a Demo for a timeline specific to your plant configuration.
Risk Doesn't Announce Itself. It Accumulates Quietly Across Four Systems Until It Doesn't.
See your plant's production, maintenance, quality, and safety signals combined into one ranked risk view — live in as little as two weeks.