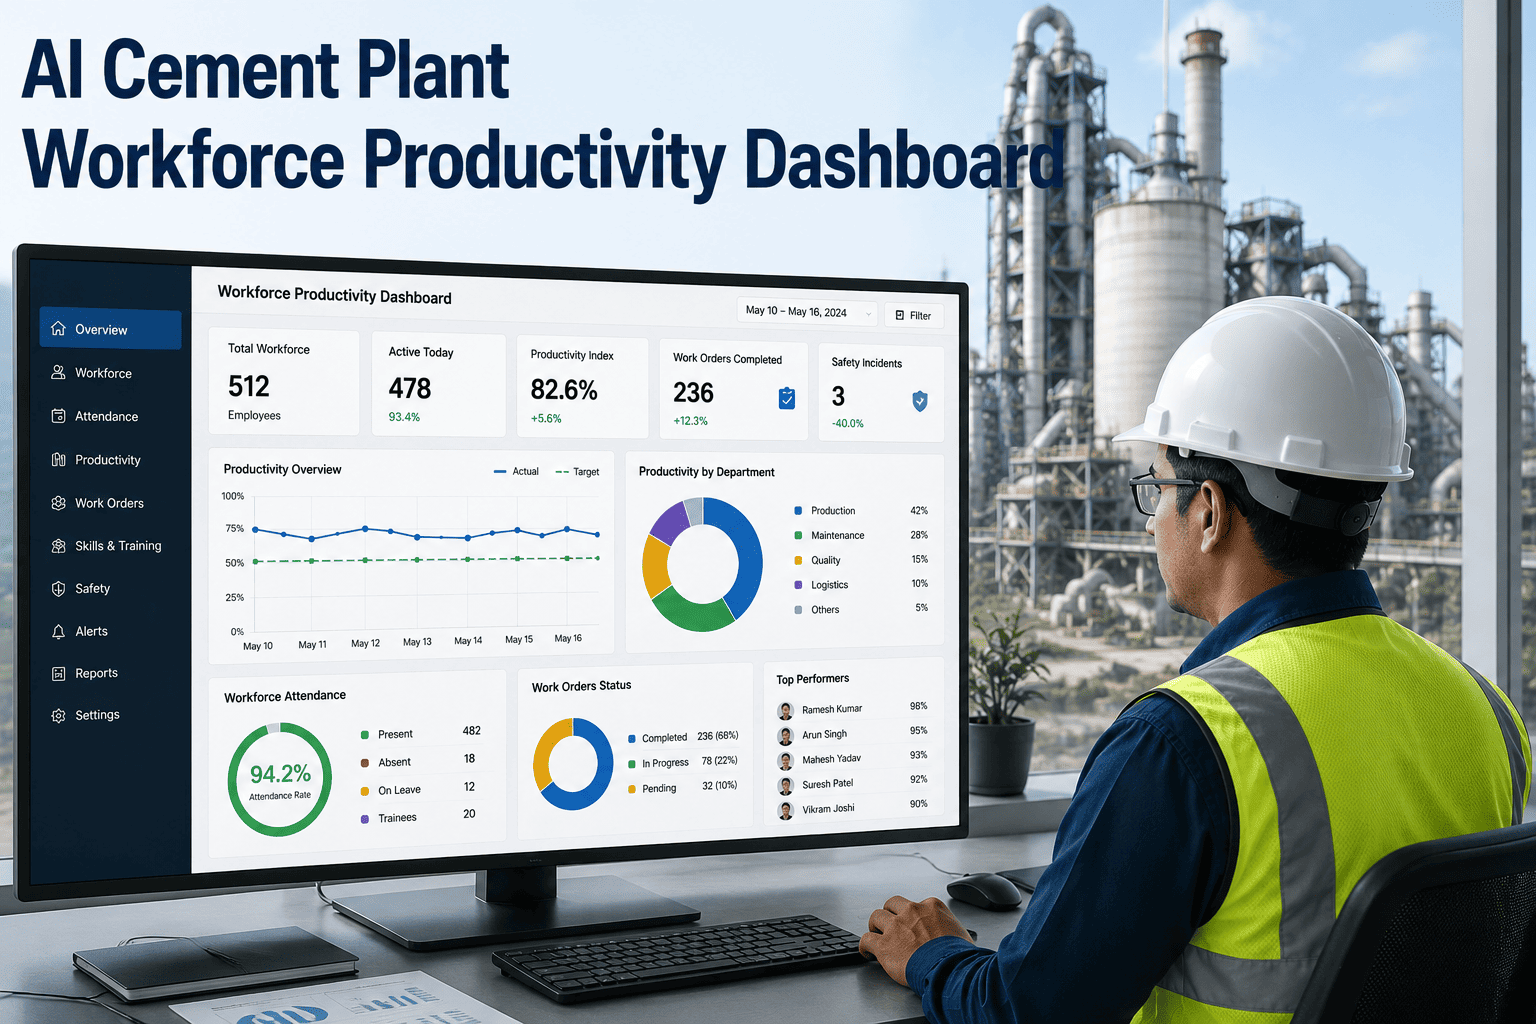
Cement plant labor costs are among the largest controllable line items in the operating budget, yet most plants still measure workforce productivity through headcount and overtime totals rather than any real sense of how effectively that time is being used. A maintenance team can log a full shift of hours without anyone knowing whether those hours went toward planned, value-adding work or toward waiting on parts, searching for tools, or redoing a job that was not done right the first time. Book a demo to see how workforce productivity analytics closes that gap.
Headcount Tells You Who Showed Up. It Doesn't Tell You What Actually Got Done.
iFactory tracks how maintenance and production time is actually spent across your cement plant, turning vague productivity assumptions into a clear, role-by-role picture of planned work, wrench time, and avoidable delay.
Most Plants Can Report Labor Cost but Not Labor Effectiveness
Payroll systems are excellent at answering how many hours were worked and how much they cost. They are almost useless at answering the more important question: how many of those hours went toward productive, planned work versus time lost to waiting, searching, rework, or administrative delay. Industry studies on maintenance workforce utilization have long suggested that a meaningful share of a technician's shift, often a third or more in plants without structured tracking, is consumed by non-wrench activities that have nothing to do with the skill the technician was hired for.
This gap matters because it hides in plain sight. A plant that feels chronically short-staffed may not actually have a headcount problem, it may have a utilization problem, where the existing team is spending too much of its time on activities that better planning, better parts logistics, or clearer work instructions could eliminate. Without visibility into how time is actually spent, that distinction is impossible to make, and the default response to feeling short-staffed is almost always to request more headcount rather than to fix the underlying utilization issue.
This matters even more in a labor market where skilled maintenance technicians for cement operations are difficult to recruit and expensive to retain. Adding headcount to compensate for a utilization problem does not just cost more in salary, it also adds training overhead, onboarding time, and management complexity, all to solve a problem that better scheduling and parts logistics might have addressed at a fraction of the cost. Plants that get ahead of this distinction tend to make far more targeted, defensible staffing decisions than plants that simply react to complaints of being overwhelmed.
Four Productivity Dimensions the Dashboard Measures by Role
Rather than reducing productivity to a single overall score, the dashboard tracks distinct dimensions that each point toward a different kind of fix, since a low wrench time ratio and a high rework frequency call for completely different corrective actions even though both ultimately reduce effective output.
A Typical Breakdown of an Unmanaged Maintenance Shift
The exact split varies by plant, crew, and shift, but the general pattern below reflects what utilization analysis commonly reveals once a plant looks closely at how a full shift actually breaks down, rather than assuming most of the shift was spent on the work order it was assigned to cover.
| Activity | Typical Share of Shift | Improvement Lever |
|---|---|---|
| Hands-on repair work | Roughly half of available time | Protect through better scheduling and parts staging |
| Travel between job sites | Meaningful daily share | Route planning and geographic work grouping |
| Waiting on parts or tools | Meaningful daily share | Pre-staged kits tied to scheduled work orders |
| Rework on prior jobs | Smaller but recurring share | Root cause review of repeat rework by technician |
| Administrative documentation | Smaller but recurring share | Simplified digital work order closeout process |
iFactory breaks down wrench time, travel, waiting, and rework by technician and by crew so your next staffing decision is based on utilization data instead of a hunch.
Book a DemoA Four-Stage Path to Workforce Productivity Visibility
Plants new to this kind of tracking sometimes worry the rollout will be disruptive to daily operations. In practice the stages below layer onto existing CMMS and mobile workflows rather than requiring technicians to adopt an entirely new system, which keeps the transition manageable for crews who are already stretched thin.
Spreadsheet Tracking Versus Automated Workforce Analytics
Plants that have never formally tracked utilization sometimes assume a spreadsheet-based approach is close enough to get started. In practice the two approaches diverge quickly once a plant tries to act on the data, since a manual process built on self-reported estimates rarely holds up to the same level of scrutiny or timeliness that automated tracking provides.
| Dimension | Manual Spreadsheet Tracking | Automated Workforce Analytics |
|---|---|---|
| Data source | Self-reported time entries, often approximate | System timestamps from work order and mobile activity |
| Update frequency | Weekly or monthly manual compilation | Continuous, updated as work orders progress |
| Comparability across crews | Inconsistent categorization between supervisors | Standardized categories applied consistently plant-wide |
| Actionability | Historical summary, reviewed after the fact | Live view that can inform same-week scheduling decisions |
What Improved Utilization Visibility Typically Delivers
These improvements typically build on each other over successive quarters rather than appearing all at once. Fixing the largest delay category first tends to produce the most visible early gain, with smaller, secondary improvements following as the plant works through the remaining causes identified in the initial baseline.
Common Questions About Workforce Productivity Dashboards
Will tracking productivity data feel like surveillance to the maintenance team?
This is a legitimate concern and depends heavily on how the data is introduced and used. When utilization data is framed and used as a tool to fix broken processes, missing parts kits, poor scheduling, unclear work instructions, technicians generally respond well because the data validates frustrations they already experience daily but have never been able to quantify. Where this goes wrong is when the same data gets used purely for individual performance scoring or discipline without addressing the systemic delays technicians do not control. Plants that get the most value from this data lead with process improvement and treat individual comparisons as a secondary, carefully handled use case. Book a demo to see how the data is typically framed for maintenance teams.
How is wrench time actually measured without technicians manually logging every minute?
Wrench time is estimated primarily from work order timestamps and mobile app activity rather than requiring technicians to manually log every minute of their day, which would itself become an administrative burden that eats into productive time. When a technician starts and closes a work order through a mobile device, that activity provides a timestamp anchor, and the gaps between assigned jobs, travel time, and documented delays such as waiting for a part, fill in the rest of the picture. The estimate is not perfectly precise to the minute, but it is accurate enough to reveal meaningful patterns and trends over weeks and months, which is what actually drives process improvement decisions.
Can this data help decide whether we actually need to hire more technicians?
Yes, this is one of the most valuable applications of workforce utilization data. A plant considering additional headcount can look at current wrench time ratio and completion rates to determine whether the existing team has meaningful unused capacity trapped in avoidable delays, in which case fixing those delays may close the gap without new hires, or whether the team is already operating near its practical capacity ceiling, in which case additional headcount is genuinely justified. This turns a staffing decision that was previously based on gut feeling and complaint volume into one grounded in an actual utilization figure that finance and operations can both examine. Contact support to discuss using utilization data for staffing decisions.
Does this apply to production operators as well as maintenance technicians?
Yes, while maintenance wrench time tends to be the most common starting point because delays are especially visible and costly in that function, the same underlying principle applies to production operators and other plant roles. Tracking how operator time splits between active process monitoring, administrative reporting, and unplanned troubleshooting can reveal similar opportunities, such as excessive time spent manually compiling shift reports that could be automated, freeing operators to spend more attention on the process itself. The specific metrics differ by role, but the goal of replacing assumption with actual utilization data applies equally across the workforce.
How does workforce productivity data connect to overtime cost control?
Overtime frequently traces back to schedule slippage caused by the same delay categories that suppress wrench time during regular hours, waiting on parts, poorly sequenced job assignments, or rework that pushes planned work past shift end. By identifying which specific delay category is driving the most schedule slippage, a plant can target the actual cause of overtime rather than simply restricting overtime hours administratively, which often just shifts the same unfinished work to the next shift without solving the underlying problem. Plants that address the root delay tend to see overtime decline as a natural consequence rather than through a policy mandate that frustrates the team. Book a demo to see overtime and utilization data connected in one view.
Replace Staffing Guesswork With a Real Picture of How Time Is Spent
iFactory gives your plant a role-by-role view of wrench time, delay, and rework so every staffing and scheduling decision is backed by actual utilization data.