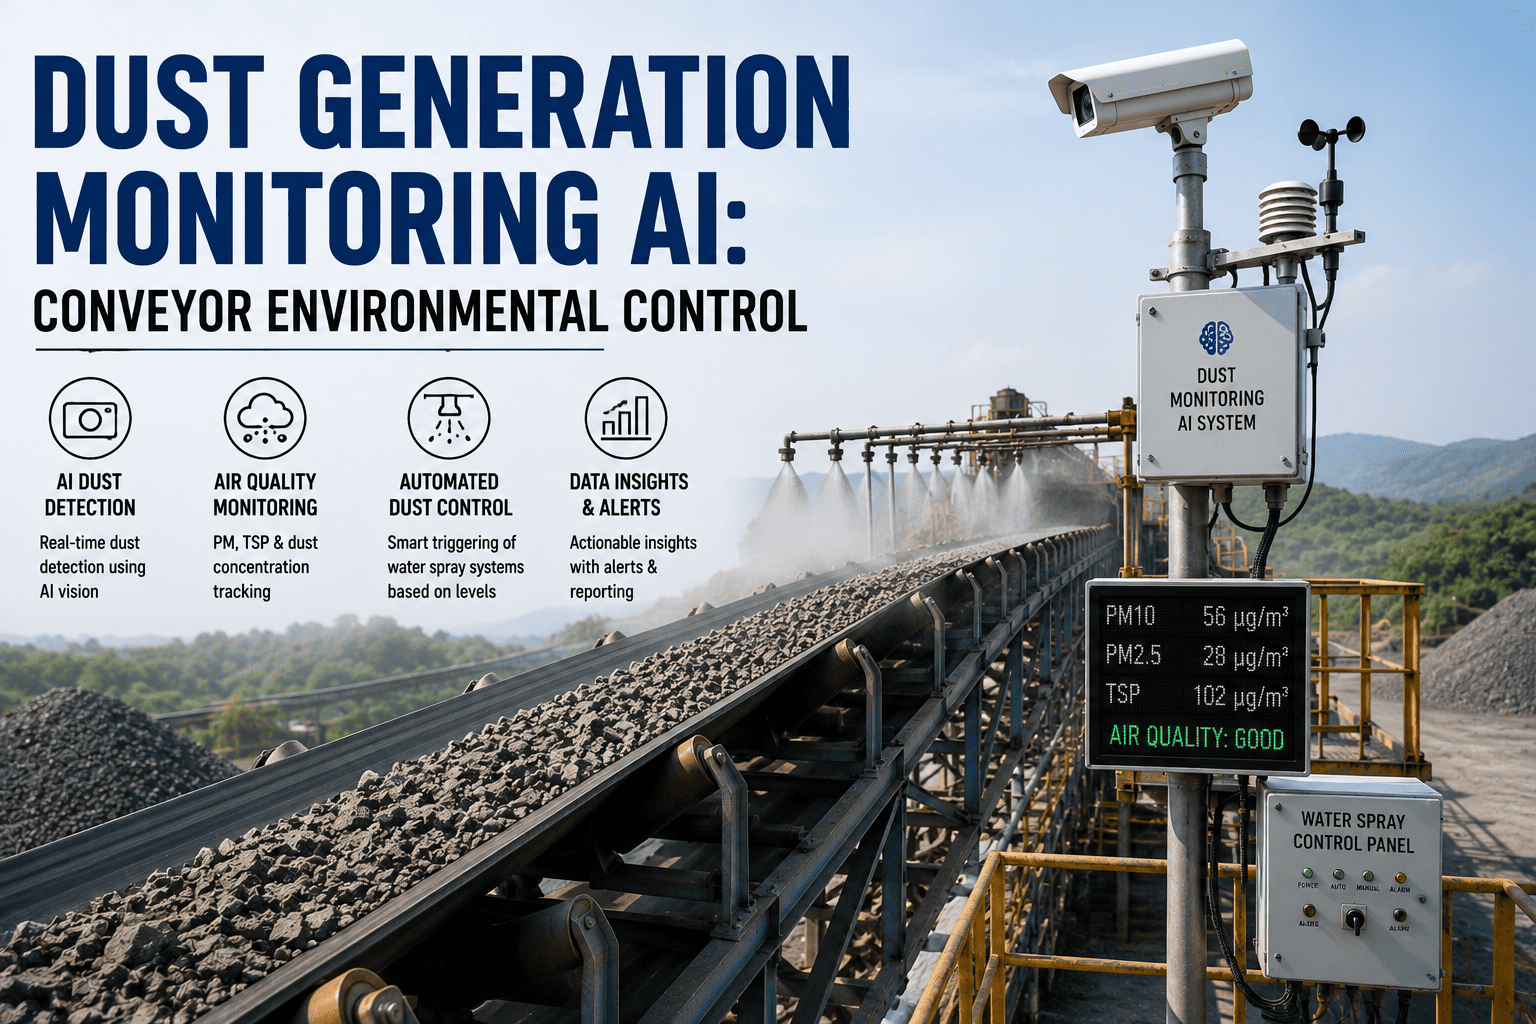
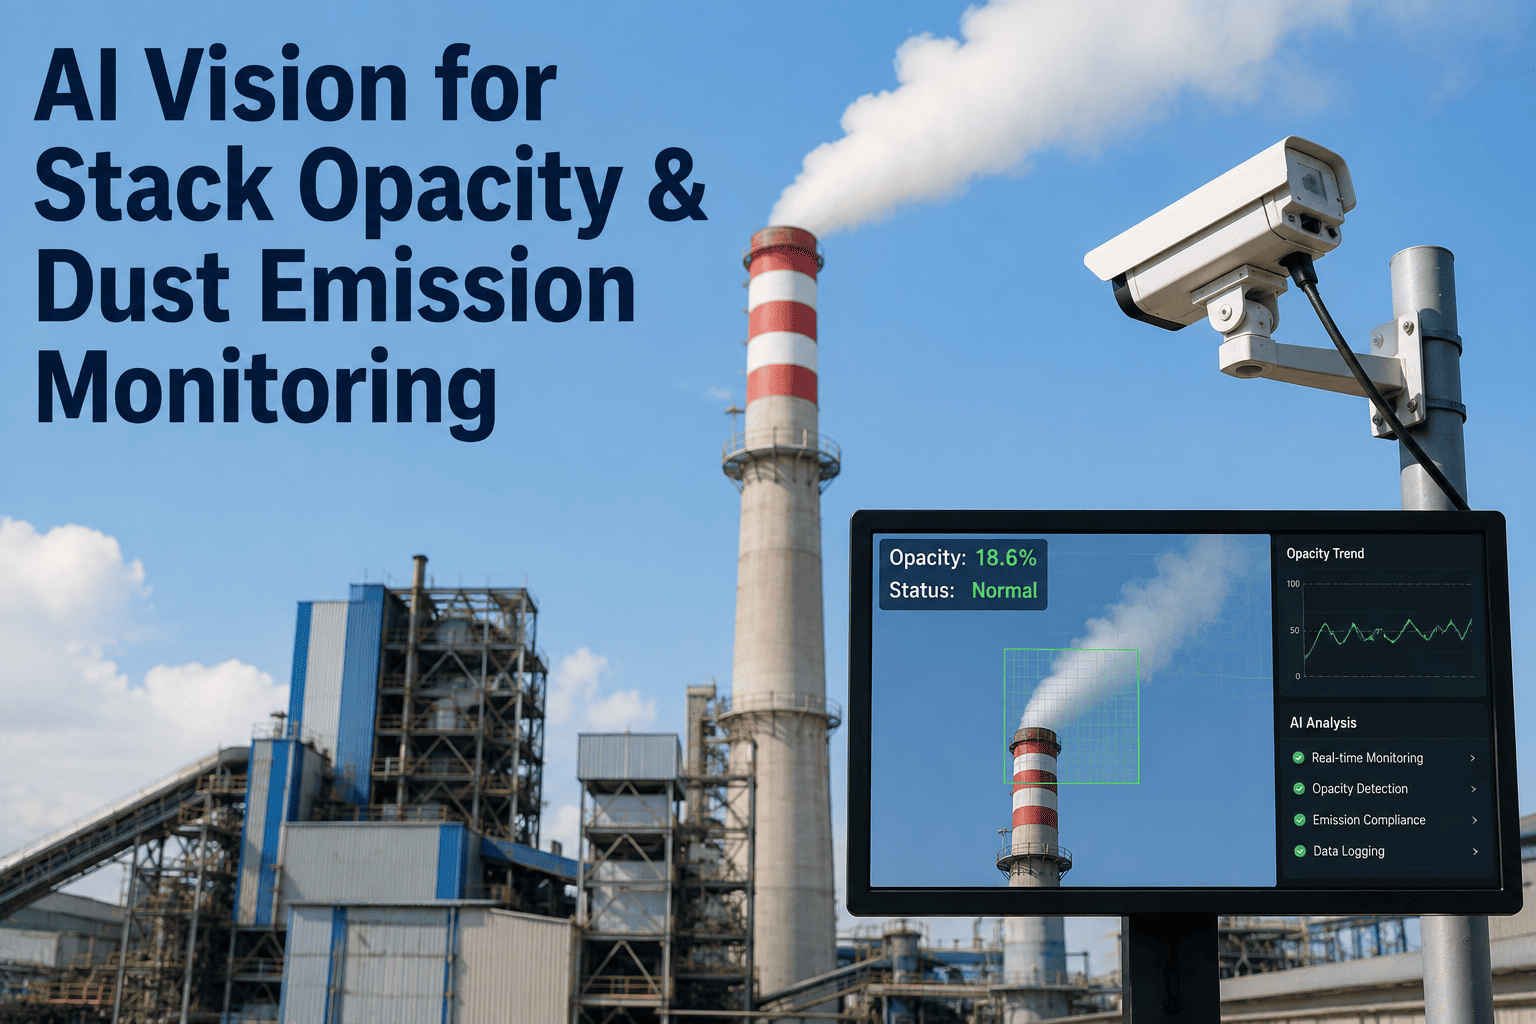
A visible dust cloud rolling off a transfer point is the kind of thing an inspector notices from the road, and by the time it is visible to the naked eye, the plant is usually already past the opacity limit written into its air permit. Most cement plants manage dust with fixed suppression schedules and periodic walkdowns, which means the system runs the same way whether the belt is dry and dusty or damp and quiet. AI vision changes that by watching for the dust event itself — spotting a cloud forming at a transfer point, tracing it back to the source, and triggering suppression before an inspector or a compliance monitor ever sees it. This article breaks down how that detection actually works, what regulatory exposure looks like without it, and you can also book a demo to see it running against your own conveyor network.
CEMENT OPERATIONS · AI VISION CONVEYOR · ENVIRONMENTAL COMPLIANCE
Catch Dust Events Before They Become Compliance Violations
Fixed suppression schedules protect against average conditions, not the transfer point that starts generating visible dust on a dry, windy afternoon. AI vision watches every conveyor continuously and reacts to the actual event.
70%
Of conveyor fugitive dust originates at transfer and load points
6%
EPA opacity limit typical of a Method 9 visible emissions standard
Seconds
Time between AI detection and automated suppression activation
Why Fixed Dust Suppression Schedules Fall Short
Most dust control systems on cement conveyors run on a timer or a fixed spray rate — water suppression cycles on a schedule, and dry fog systems activate whenever the belt is moving, regardless of whether the material is actually generating a visible plume. That approach wastes water and energy during wet or low-dust conditions, and it still misses the moments when dust generation spikes: a dry batch of raw material, a gap in the wind screen, a transfer chute running slightly out of alignment. Fugitive dust incidents cluster around exactly these unpredictable conditions, which is why a schedule built around averages consistently underperforms during the events that actually trigger a compliance issue.
The gap is not a lack of suppression capacity — most plants already have water sprays or dry fog systems installed. The gap is knowing exactly when and where to activate them at full capacity, rather than running them continuously or on a guess.
Where Dust Actually Originates on a Conveyor System
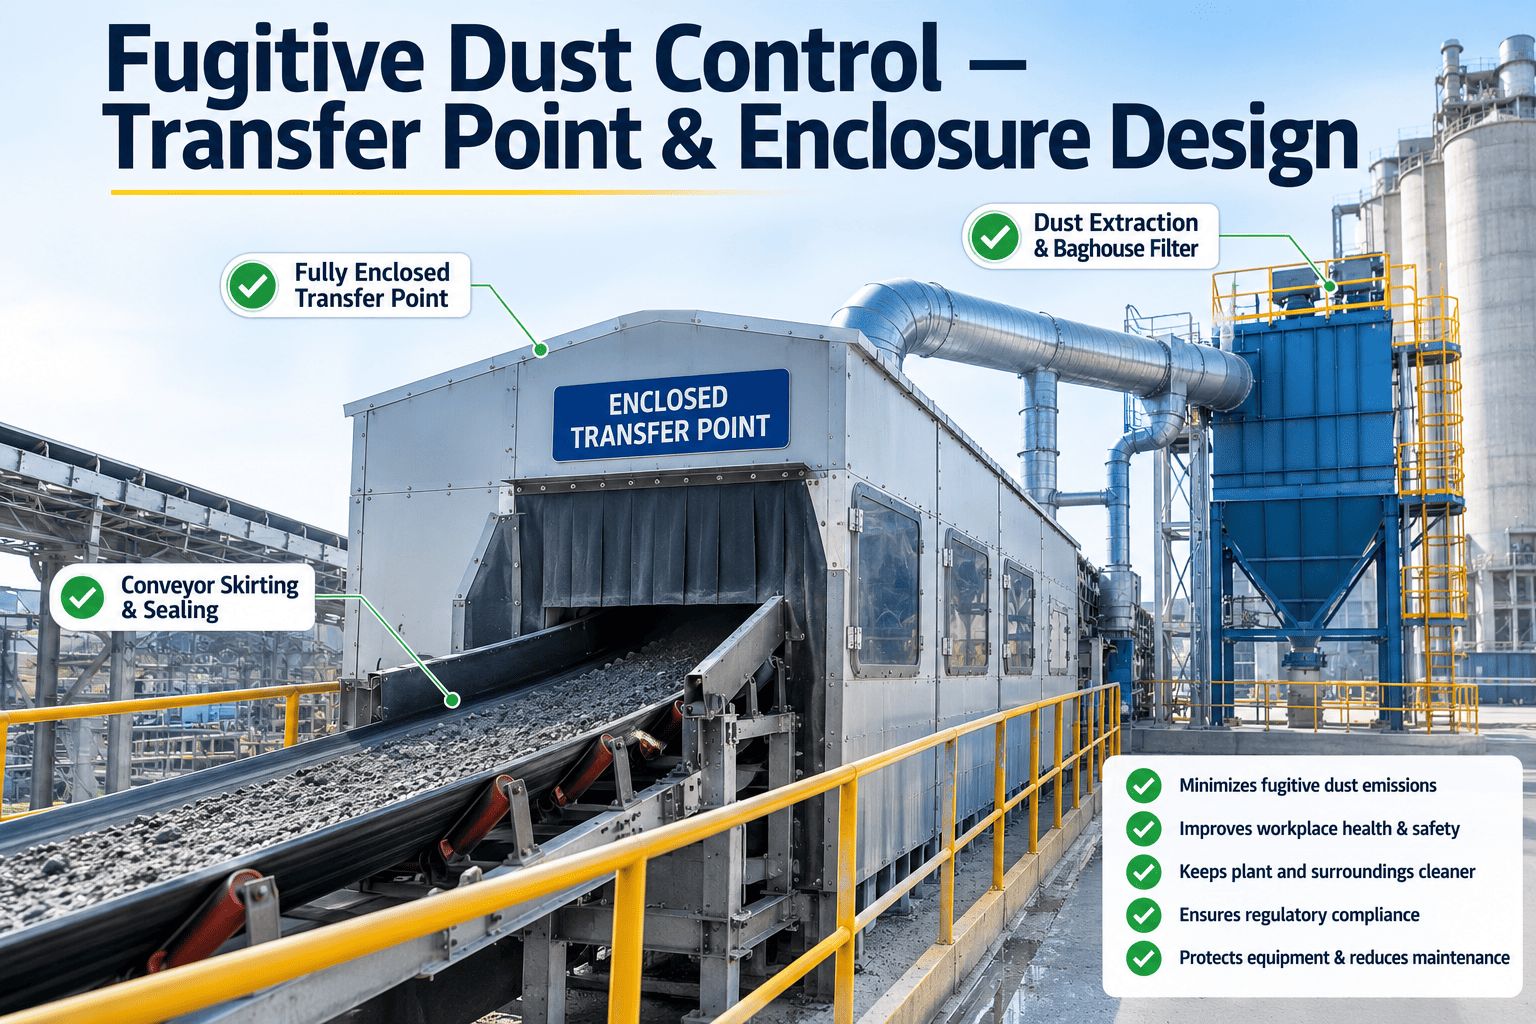
Dust generation is not evenly distributed along a conveyor — it concentrates at a small number of points where material changes direction, speed, or containment, and identifying the actual source is what makes targeted suppression possible instead of blanket spraying the entire line.
1
Transfer Points and Chutes
Material free-falling between belts generates the highest dust volume on the system, especially when chute liners are worn and material impacts at an unintended angle.
2
Belt Loading Zones
The point where material first lands on the belt sees turbulent air displacement, pushing fine particulate outward if skirting and containment are not sealed properly.
3
Belt Return and Cleaning Stations
Carryback material dislodged by belt cleaners generates a secondary dust source along the return run that is frequently overlooked in suppression planning.
4
Discharge and Stockpile Interfaces
Material dropping onto an open stockpile is exposed to wind, and the resulting fugitive dust is often the most visible plume from outside the plant fence line.
5
Screening and Crushing Interfaces
Where a conveyor feeds into a crusher or screen, vibration and impact generate fine particulate that escapes through gaps in enclosure panels.
Regulatory Exposure: What Dust Actually Puts at Risk
Fugitive dust is not just an environmental nuisance — it is directly tied to specific regulatory standards that carry real enforcement consequences for cement operations.
| Regulatory Standard |
What It Governs |
Typical Exposure |
| EPA Method 9 Visible Emissions |
Opacity limits on visible plumes from process equipment |
Notice of violation, escalating fines on repeat readings |
| NSPS Subpart F/OOO |
Fugitive emissions standards for cement plants and nonmetallic minerals |
Corrective action plans, potential permit modification |
| State Fugitive Dust SIP Rules |
Reasonable precaution requirements for material handling |
Local inspection citations, community complaint escalation |
| Title V Operating Permit Conditions |
Facility-specific dust control commitments tied to permit |
Permit review triggers, compliance monitoring plan revisions |
Turn Dust Compliance From a Walkdown Into a Live Feed
iFactory watches every transfer point and load zone continuously, so a developing dust event gets caught and suppressed before it becomes a visible emissions reading — not after.
Detection Methods Compared
Plants use a mix of technologies to monitor dust, and each comes with a different trade-off between coverage, response speed, and cost.
| Detection Method |
What It Measures |
Response Speed |
Coverage |
| Fixed Particulate Sensors |
PM concentration at a single monitored point |
Fast at the sensor location |
Limited to sensor placement |
| Periodic Opacity Readings |
Visible plume density at inspection time |
Slow — point-in-time only |
Whole stack or process area |
| AI Vision Camera Monitoring |
Visual dust cloud formation across multiple points |
Near real-time, continuous |
Every monitored transfer point simultaneously |
| LIDAR-Based Plume Tracking |
Dust plume density and dispersion direction |
Real-time |
Wide-area, weather-dependent |
From Detection to Automated Suppression
The value of catching a dust event only exists if the response is fast enough to matter. AI vision closes that loop by triggering suppression automatically rather than waiting for a person to see the plume and respond.
Step 1
Continuous Visual Monitoring
Cameras positioned at transfer points, load zones, and discharge areas capture a continuous feed of the material flow and surrounding air.
Step 2
Dust Cloud Recognition
AI vision models trained to distinguish airborne dust from normal material movement flag the moment a plume begins forming, rather than waiting for it to become dense enough for the eye.
Step 3
Source Localization
The system identifies which specific point along the conveyor the plume is originating from, distinguishing a chute issue from a loading zone issue automatically.
Step 4
Targeted Suppression Activation
Water spray or dry fog suppression is triggered at the identified source point specifically, rather than activating the entire line's suppression system.
Step 5
Event Logging for Compliance Records
Every detected event, its source, and the suppression response is logged automatically, building the documentation trail regulators expect during an inspection or audit.
40%
Typical reduction in suppression water use with targeted activation
24/7
Continuous coverage versus periodic manual walkdowns
100%
Of detected events automatically logged for compliance records
Conditions That Make Dust Events More Likely
Dust generation is not constant — certain conditions raise the risk of a visible plume well above baseline, and knowing which ones apply on a given day helps prioritize where monitoring attention matters most.
A
Dry Season Material Moisture
Raw material with low moisture content generates significantly more airborne fine particulate at every transfer point than material handled during wetter periods.
B
Wind Direction and Speed
Even well-contained transfer points can generate a visible plume when wind carries dust past a partial enclosure, especially at open stockpile interfaces.
C
Worn Chute Liners and Skirting
A liner or belt skirt that has worn past its intended tolerance changes material flow geometry, increasing dust generation even when suppression rates stay unchanged.
D
Feed Rate and Belt Speed Changes
A temporary increase in throughput or belt speed to meet production targets can push a transfer point past the dust generation level its suppression system was calibrated for.
Where to Position Detection Cameras for Best Coverage
Camera placement determines how much of the actual dust-generation area gets monitored, and a poorly positioned camera can miss the exact moment a plume forms even if it is pointed generally at the right conveyor section. The goal is line-of-sight coverage of the material stream itself, not just the surrounding structure.
1
Angle Toward the Material Stream, Not the Structure
A camera aimed at the chute housing rather than the falling material misses the moment dust actually becomes airborne, which is the signal the detection model needs.
2
Account for Lighting Changes Across the Day
Transfer points near open bays or windows see lighting shift significantly between morning and afternoon, and camera placement should minimize glare or shadow interference during peak-risk hours.
3
Cover Both the Source and the Dispersion Path
A second camera angle capturing where dust travels after leaving the source point helps confirm whether containment measures like wind screens are actually working.
Reducing False Positives Without Missing Real Events
An early concern for most plants is whether steam, condensation, or normal material spillage will trigger unnecessary suppression activations. This is a tuning question more than a technology limitation, and it is worth addressing directly before rollout rather than discovering it after the system is live.
Tune 1
Establish a Site-Specific Visual Baseline
Training the model against your own conveyor's normal operating appearance — including steam, shadows, and typical material spillage — reduces false triggers far more effectively than a generic model.
Tune 2
Set Confidence Thresholds by Location
A transfer point with a history of dust events can run a more sensitive threshold than a low-risk section, avoiding unnecessary suppression cycles across the whole network.
Tune 3
Review Flagged Events During the First Weeks
A short review period where flagged events are checked against footage lets the model's thresholds be refined quickly, rather than left static from the initial configuration.
What This Looks Like in Practice
Before
A Citation From a Routine Site Visit
A cement plant's stockpile transfer point had a worn chute liner that was redirecting material flow slightly off-center. The resulting dust plume was intermittent and only visible under certain wind conditions, so it went unnoticed during scheduled walkdowns. A state inspector observed the plume during a routine visit and issued a visible emissions citation, triggering a corrective action review.
After
The Same Fault Caught in Minutes
With AI vision monitoring the same transfer point, the intermittent plume was flagged the first time it formed. The system localized the source to the worn liner, triggered suppression automatically, and logged the event — giving maintenance a documented reason to schedule a liner inspection before the wear caused a repeat event or a citation.
Getting Started: What to Prioritize First
A
Map Your Highest-Risk Points
Start with the transfer points and load zones closest to the property line or most frequently cited in past inspections, rather than trying to cover the entire conveyor network at once.
B
Audit Existing Suppression Coverage
Confirm which points already have water spray or dry fog systems installed, since AI vision detection is most valuable when it can trigger suppression that already exists.
C
Pull Your Recent Compliance History
Reviewing past citations or complaint records helps prioritize which points carry the most regulatory risk and should be monitored first.
D
Establish an Event Logging Baseline
Even before full automation is in place, a documented log of dust events builds the compliance record that demonstrates the plant is actively managing the risk.
Frequently Asked Questions
How does AI vision tell the difference between dust and normal conveyor activity?
The models are trained on the visual characteristics that separate airborne particulate from expected material movement — dust behaves differently in the air than falling or moving bulk material, showing distinct motion patterns, density, and dispersion. Because the system watches continuously rather than at scheduled intervals, it can flag a plume the moment it begins forming instead of waiting for it to become dense enough for a person to notice from a distance.
Can this integrate with the water spray or dry fog systems we already have installed?
Yes — in most deployments, the goal is to activate existing suppression infrastructure more precisely rather than replace it. Detection triggers the specific spray zone nearest the identified dust source, which typically reduces total water usage compared to a fixed-schedule system while improving the actual suppression response at the moment it matters. Reach out through
support if you want to walk through your current suppression setup.
Does this help during a regulatory inspection or audit?
Continuous event logging is one of the most valuable outcomes for compliance purposes. Instead of relying on periodic opacity readings or manual walkdown notes, the system maintains a timestamped record of every detected dust event, its source, and the suppression response — documentation that demonstrates active management of fugitive dust risk rather than a reactive posture after a citation.
What weather conditions affect detection accuracy?
Low visibility conditions such as heavy fog or precipitation can reduce camera-based detection accuracy, which is why some deployments pair vision monitoring with a secondary particulate sensor at the highest-risk points. In most operating conditions, including wind-driven dust events that are the hardest to catch manually, vision-based detection performs reliably across day and night operation.
How quickly can this be deployed across our conveyor network?
Most plants start with a small set of high-risk transfer points rather than the full network, which allows detection accuracy to be validated before expanding coverage. A phased approach typically shows results within the first few weeks at the initial monitored points, and you can
book a demo to see how a phased rollout would map to your specific conveyor layout.
See Dust Events Before They Reach the Fence Line
iFactory's AI vision monitors every transfer point continuously, localizes the source of every dust event, and triggers targeted suppression automatically — turning compliance from a walkdown into a live, documented feed.