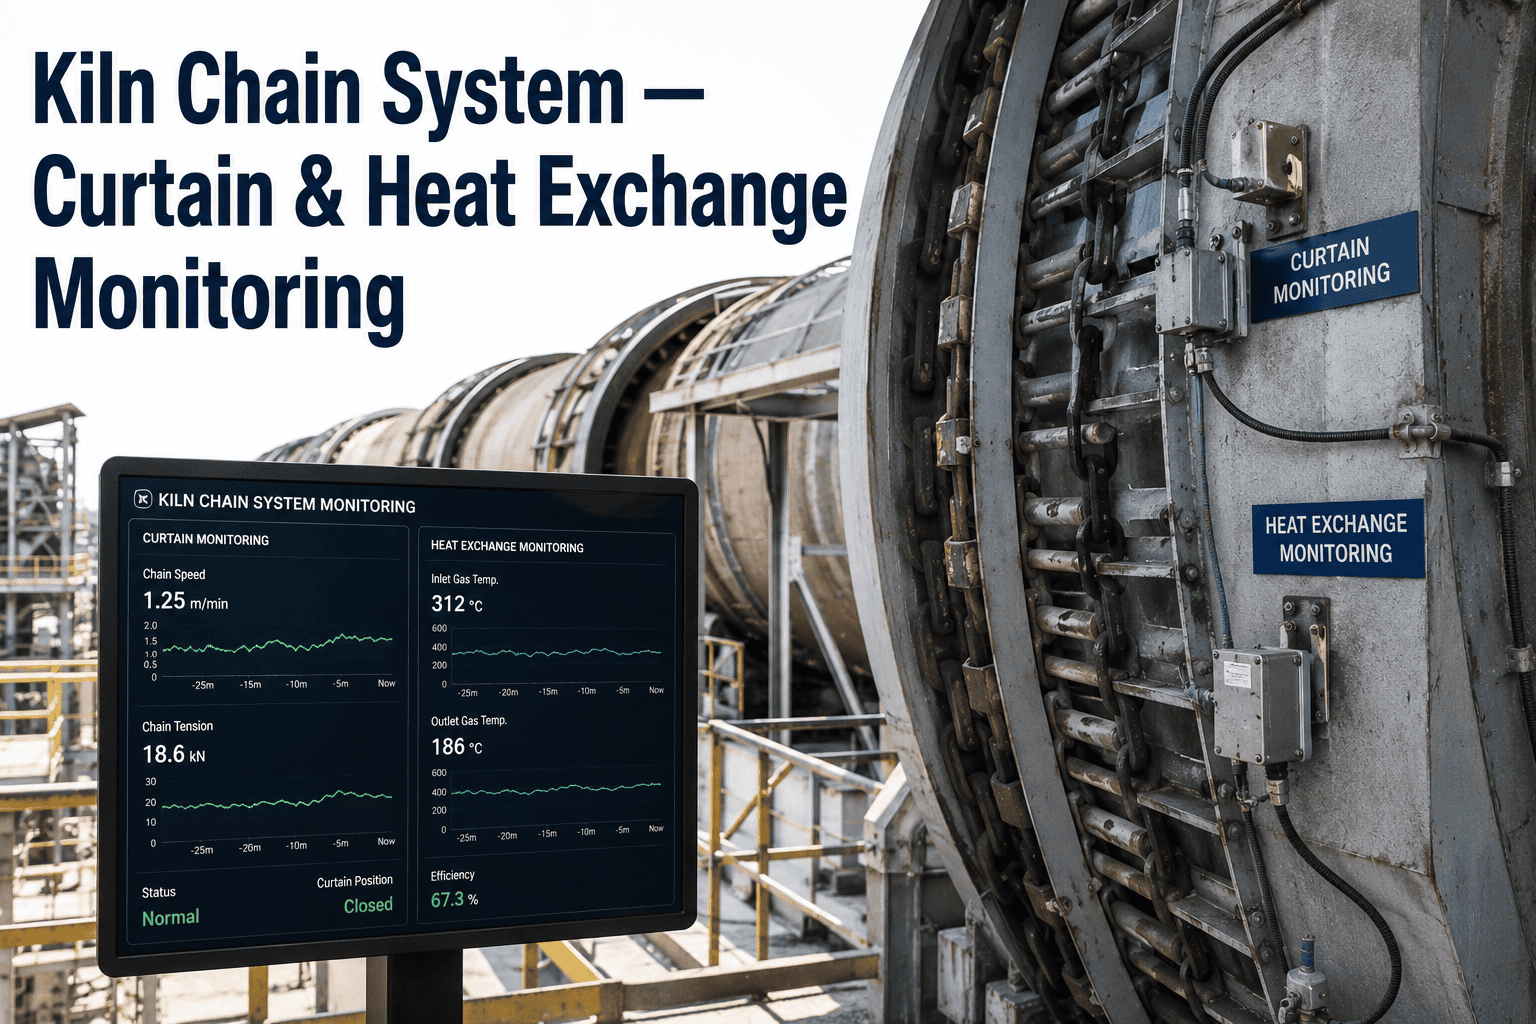
Inside the back end of every wet and semi-wet process kiln hangs a curtain of steel that does more heat exchange work than almost any other single component in the pyroprocessing line. A properly designed chain system can lower specific heat consumption by roughly 300 kcal per kilogram of clinker, yet most plants still judge chain condition by an annual visual count during a shutdown. By the time missing chain is obvious to the eye, fuel consumption has already been drifting upward for months. iFactory's kiln monitoring AI tracks chain-zone temperature profiles continuously, flagging heat-exchange degradation long before the next planned inspection. Book a chain-zone monitoring demo to see the drift on your own kiln's exit gas temperature.
The Chain Zone Is Your Kiln's Largest Hidden Heat Exchanger
Continuous chain-zone temperature and gas-path monitoring catches wear, breakage, and heat-exchange degradation between shutdowns, not just during them.
Why the Chain System Still Matters
Chain systems were pioneered nearly a century ago to solve one problem: slurry entering a wet-process kiln carries roughly 30% moisture that has to be driven off before calcination can begin. The chains remain the most direct answer to that problem in wet and semi-wet operations still running today.
typical output increase attributed to chain heat exchangers versus chainless drying
specific heat consumption reduction achievable with a properly designed chain system
exit gas temperature reduction from roughly 1,500 meters of installed chain
of total kiln length typically occupied by the chain system in the back end
Inside the Chain Zone: A Section-by-Section Map
The chain zone is not one uniform curtain. It is a sequence of distinct sections, each doing a different job as slurry moves from wet feed to dried, calcining-ready material.
Curtain Chain vs. Garland Chain
The two dominant chain configurations trade differently on thermal effect, pressure drop, and maintenance burden — which is why most modern chain zones lean almost entirely on curtain chain design today.
- Length roughly 70% of kiln inner diameter, one end fixed
- Fully immerses in slurry during part of each rotation
- Pressure drop of roughly 1–2 mm H2O per meter installed
- Standard configuration across most modern wet-process kilns
- Both ends fixed, hanging in a loop across the section
- Thermal effect roughly 1.5 times higher than curtain chain
- Pressure drop of roughly 2–3 mm H2O per meter installed
- Largely phased out due to difficulty maintaining hang pattern
Stop Guessing When Chain Wear Started
See your chain-zone exit gas temperature trended against historical baseline, with drift flagged the week it starts — not the shutdown it gets discovered.
Five Ways Chain Condition Degrades Between Shutdowns
Chain wear is gradual and cumulative, which is exactly why annual visual counts miss the pattern that continuous temperature trending catches early.
Abrasive wear rate
Typical loss runs 80–120 grams per tonne of clinker on wet kilns, higher on dry kilns, gradually thinning link cross-section.
Chemical attack
Alkali and sulfur compounds in the gas stream corrode chain links, accelerating wear beyond pure mechanical abrasion.
Localized breakage
Individual chain strands break loose and drop, leaving gaps in the curtain that immediately reduce heat exchange surface.
Hang-pattern drift
Uneven wear shifts how the curtain hangs across the cross-section, concentrating gas flow through low-resistance gaps.
Dust return imbalance
Worn chain sections handle dust return less effectively, increasing carryover load on downstream dust collection.
How Continuous Chain-Zone Monitoring Works
Baseline temperature mapping
Gas-path and shell temperature sensors establish a baseline profile across every chain-zone section at known chain condition.
Continuous exit-gas tracking
Exit gas temperature is trended continuously, since rising temperature at stable feed rate is the earliest signal of lost heat-exchange surface.
Zone-by-zone deviation scoring
The AI model isolates which section is drifting from baseline, narrowing inspection focus before the next shutdown opportunity.
Fuel and output correlation
Specific heat consumption and output trends are correlated against chain-zone drift to quantify the real cost of degradation.
Replacement planning
Wear trend data feeds replacement scheduling, so chain purchase and installation align with actual degradation, not a fixed calendar interval.
What Changes With Continuous Chain-Zone Visibility
Matching Chain Material to Zone Conditions
Not every section of the chain zone sees the same combination of abrasion, chemical attack, and temperature. Material selection by zone is one of the most overlooked levers for extending replacement intervals.
Signs Your Chain Zone Needs Attention Now
These indicators typically appear well before a scheduled shutdown, and each one is visible in continuous monitoring data long before it would be caught on a visual walk-down.
Exit gas temperature trending upward at a stable feed rate over consecutive weeks
Specific heat consumption creeping higher without a corresponding raw material or fuel change
Increased dust carryover load reported by downstream baghouse or dust collection systems
A single zone reading diverging from its historical baseline while neighboring zones stay flat
Kiln draught or ID fan load shifting outside its normal operating band without a process change
Longer-than-normal interval since the last full chain-zone replacement relative to wear-rate trend
Frequently Asked Questions
Can monitoring detect a single broken chain strand, or only zone-wide wear?
Both. Zone-wide wear shows up as a gradual shift in the baseline temperature profile over weeks, while a sudden localized break typically produces a sharper, more immediate deviation in that specific section's gas-path reading, which the model flags separately from long-term drift.
Does this apply to dry-process and preheater kilns without chain systems?
This specific monitoring approach targets wet and semi-wet process kilns where chain heat exchange remains central to operation. Dry-process and preheater kilns use different heat exchange mechanisms, which our team can walk through if your plant runs a mixed fleet.
How much fuel is typically at stake from undetected chain wear?
A properly functioning chain system can hold specific heat consumption roughly 300 kcal per kilogram of clinker lower than a degraded one. On a kiln running continuously, even a partial loss of chain surface compounds into a meaningful fuel cost increase over a full campaign before anyone notices on the utility bill.
Will this change our chain replacement schedule or budget?
It typically shifts replacement from a fixed calendar assumption to an evidence-based schedule. Some sections wear faster than expected and get replaced sooner; others hold condition longer than the standard interval assumed, spreading spend more efficiently across the campaign.
How is the monitoring system installed without a dedicated outage?
Sensor installation on the shell and gas path is scheduled during a routine planned stop, and baseline calibration runs during normal operation afterward. Book a demo to walk through installation timing against your outage calendar.
The Bottom Line on Chain Zone Visibility
The chain system was engineered as a near-invisible workhorse, and most plants still monitor it that way — once a year, by eye, during a shutdown. Continuous temperature trending turns that blind spot into a live metric, catching heat-exchange degradation while it is still a fuel-cost problem instead of a structural one. The chains have not changed since the 1930s. The way you watch them should have.
See Your Chain Zone's Real Condition
Book a 30-minute scoping call. iFactory maps your current exit-gas temperature against expected baseline and shows where heat exchange is already slipping.