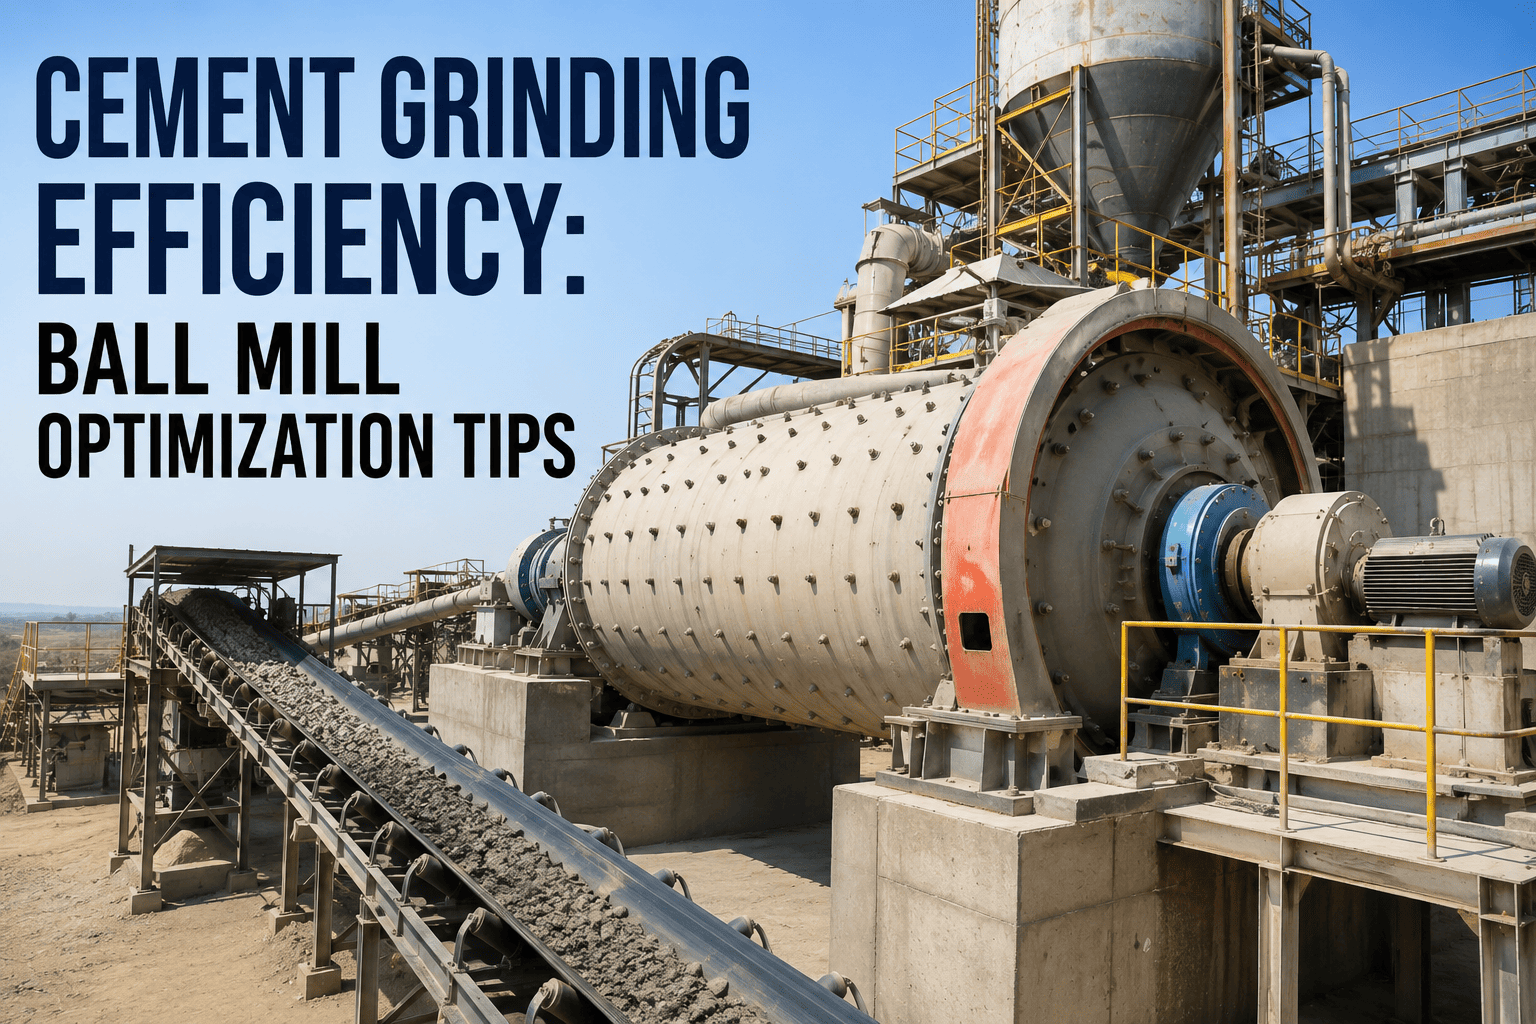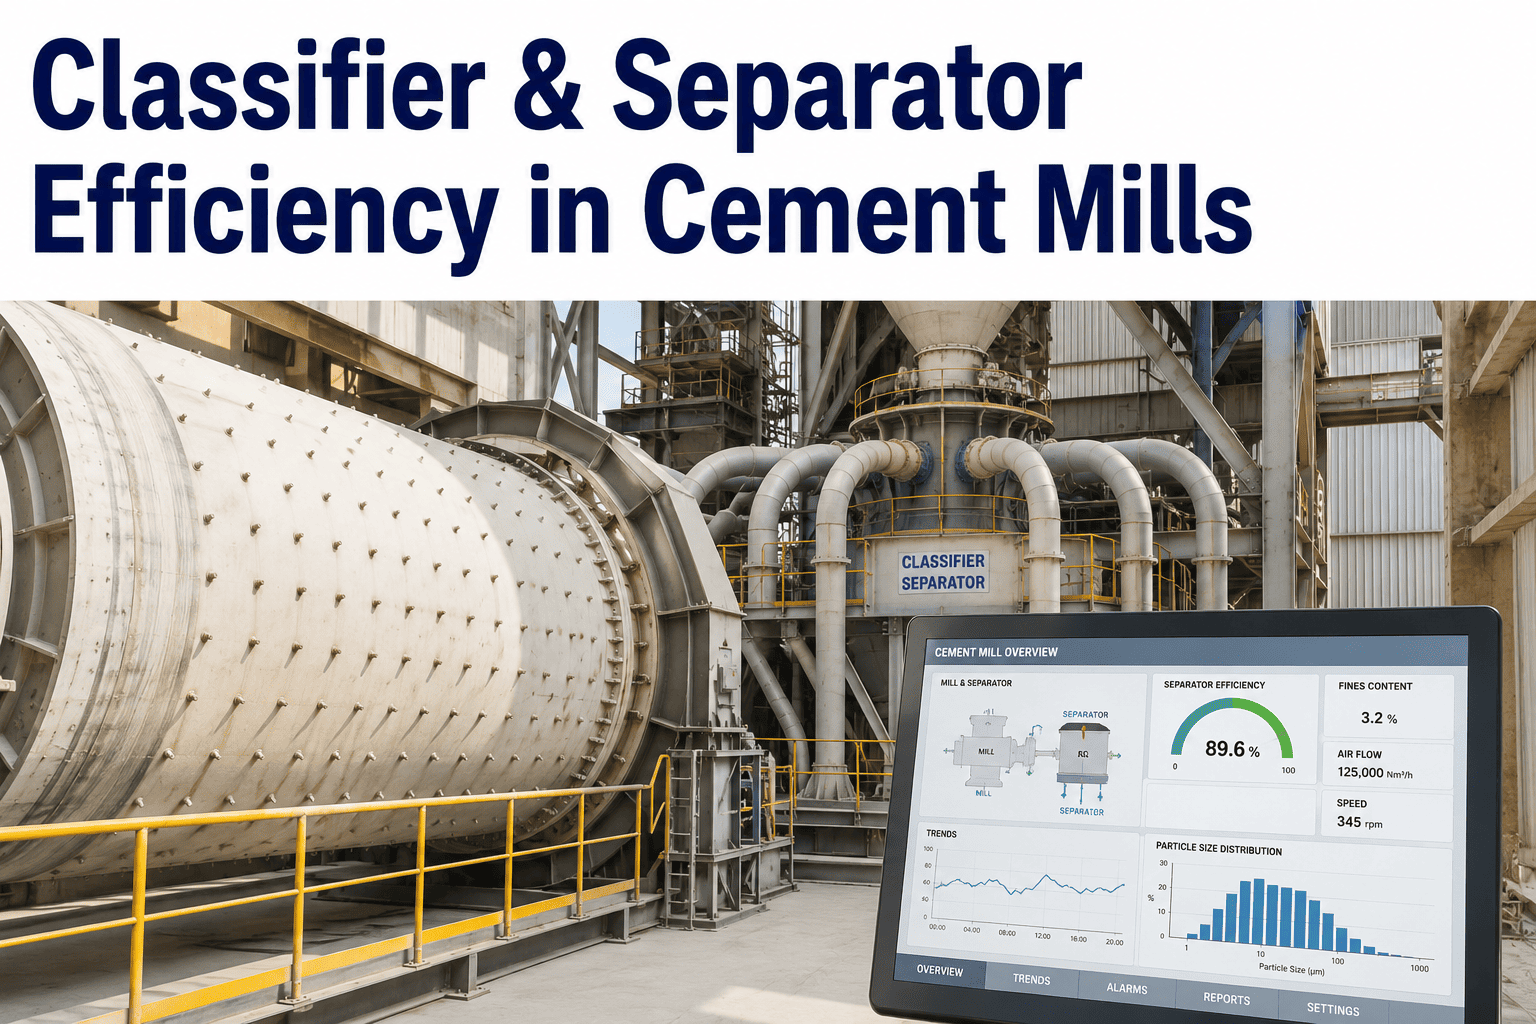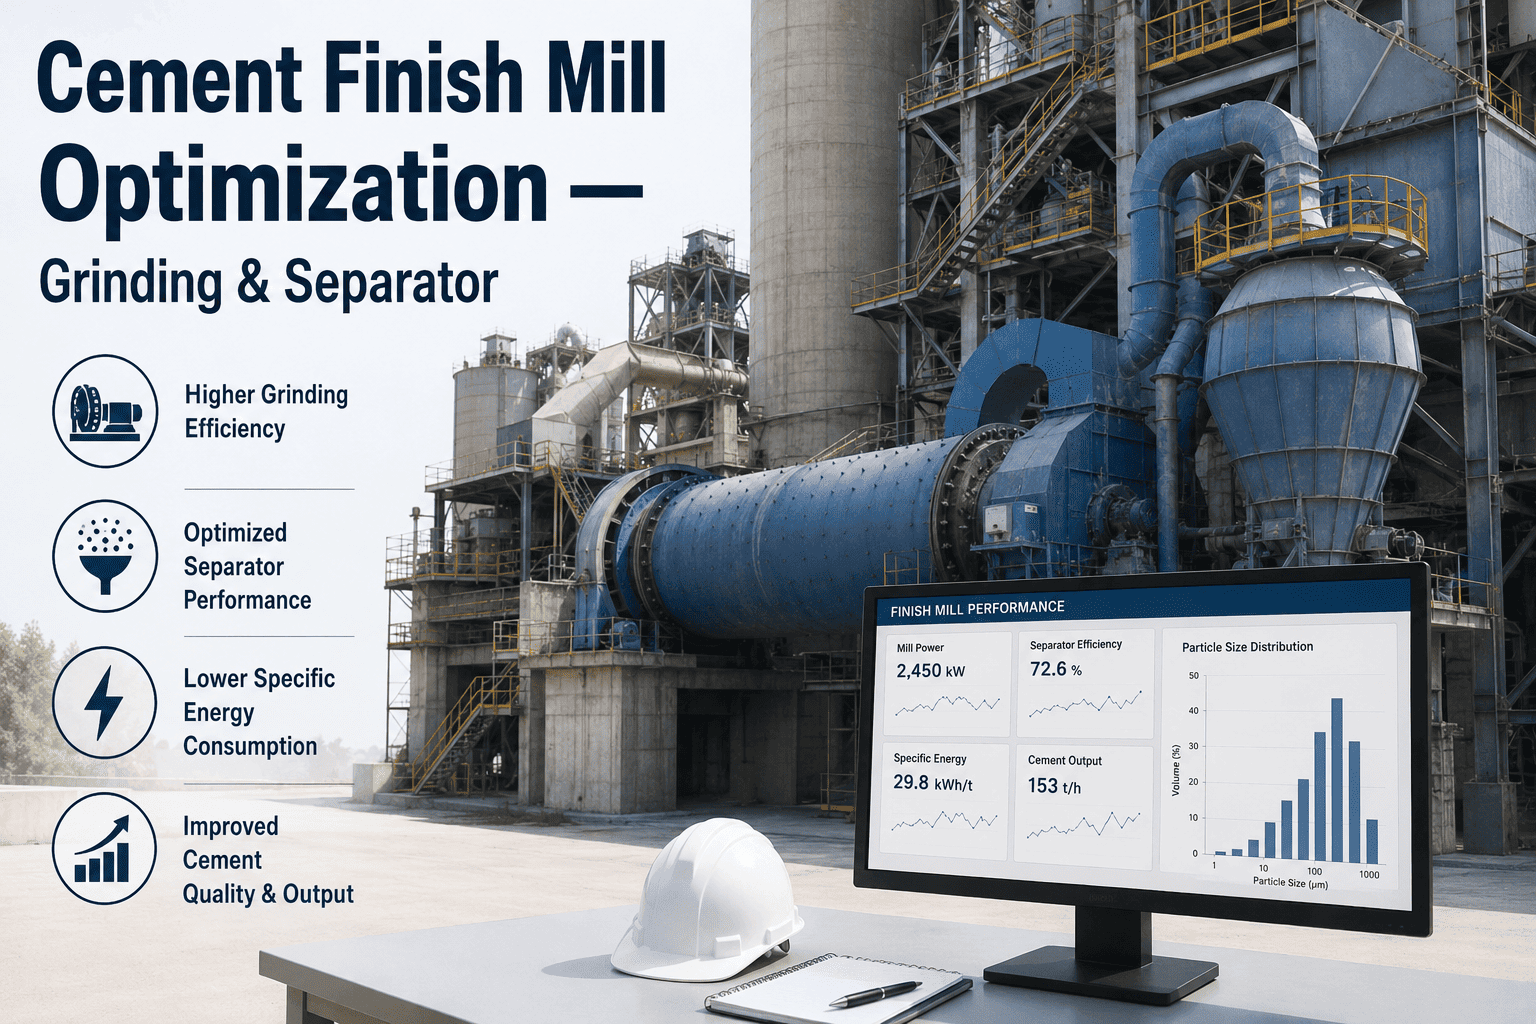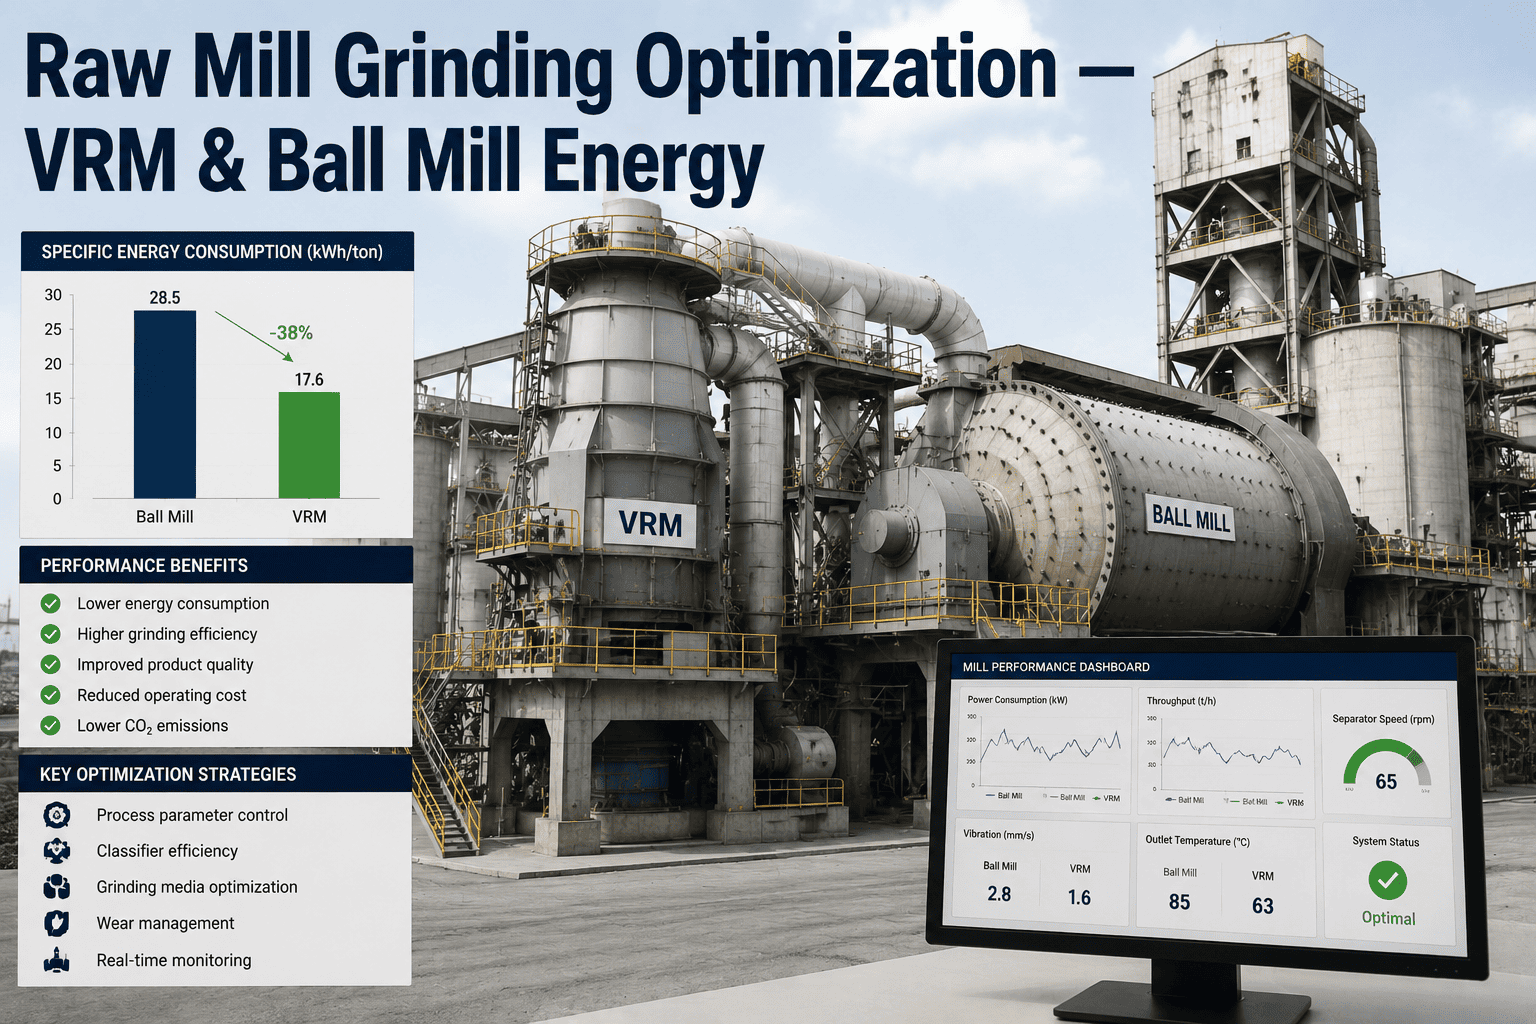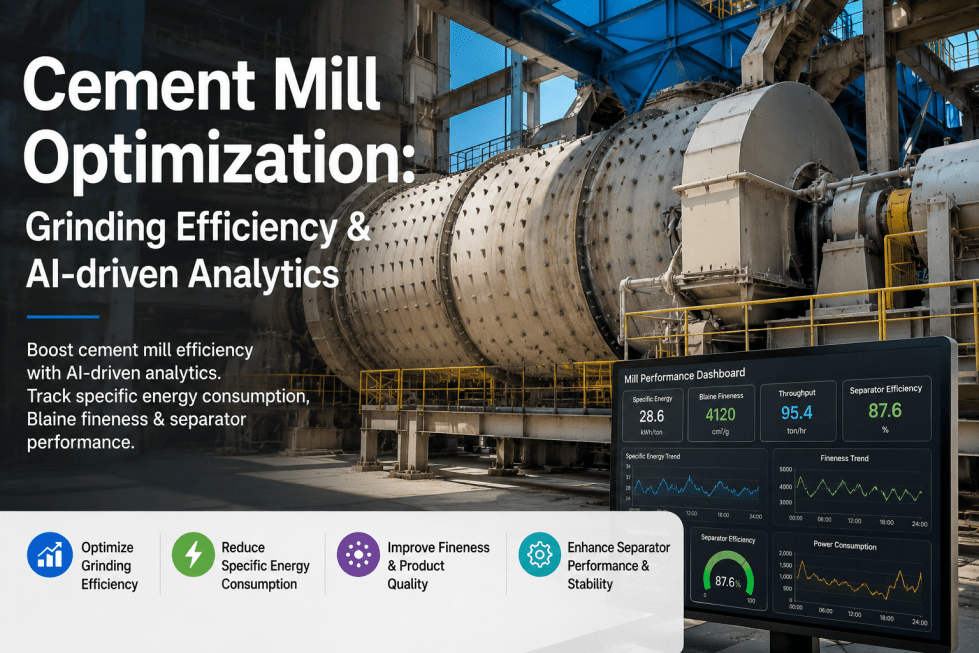
A cement mill separator makes one decision, over and over, thousands of times a minute: does this particle leave as finished product, or go back through the mill for another pass. When that decision is made well, the mill grinds only what still needs grinding. When it drifts, the circuit quietly starts re-grinding cement that was already fine enough, the recirculation factor climbs, and power consumption rises without anyone changing a single setpoint. The Tromp curve is how a plant reads that decision after the fact, and a short working session with our team can show what that same picture looks like when it's built continuously from your own mill data instead of a once-a-quarter test.
Cement · Grinding Circuit Optimization
Separator Efficiency: Reading the Tromp Curve and Taming the Recirculation Factor
Cut point drift and a creeping recirculation factor rarely announce themselves — they show up months later as higher specific power consumption and a mill that seems to be working harder for the same output. This breaks down what the Tromp curve actually measures, how the recirculation factor connects to it, and how a plant can watch both without waiting for the next manual sampling campaign.
3
numbers on a Tromp curve that summarize separator health
100-250%
typical circulating load range in a healthy closed ball mill circuit
Weeks
how long a widening cut can go unnoticed between sampling campaigns
Why This Gets Missed
A Separator Can Fail Quietly For Months Before Anyone Runs a Test
Most grinding circuits only get a formal Tromp curve evaluation when someone already suspects a problem — output has slipped, power draw looks high for the tonnage, or a customer complaint points at fineness consistency. Between those evaluations, the separator keeps running on whatever speed and air settings were last tuned for a feed and clinker grindability that may no longer match today's raw materials. A rotor that was cutting cleanly at 3200 Blaine in one campaign can be running with a noticeably wider cut a few weeks later once clinker hardness or gypsum content shifts, and nothing on a standard control room screen flags that change directly. What operators do see is secondary: mill amps creeping up, output softening, or the recirculation factor climbing on the load cell readings, all of which get attributed to the mill before anyone looks at the classifier sitting right after it.
Reading the Curve
Three Numbers the Tromp Curve Reduces Separator Health To
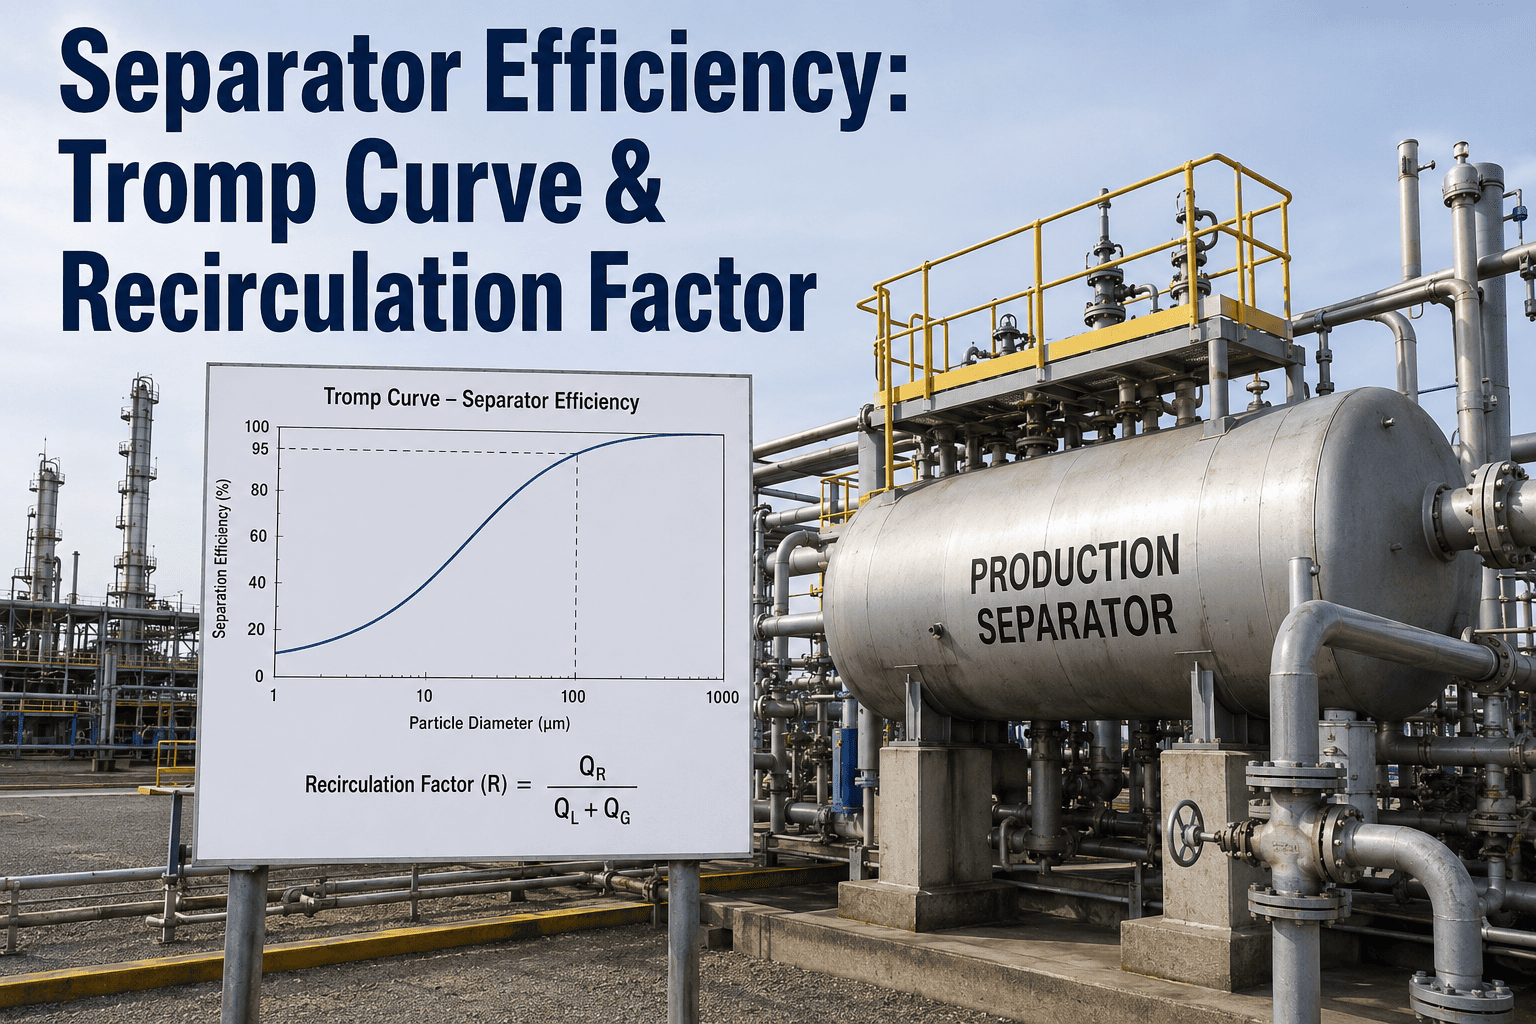
A Tromp curve is built by comparing the particle size distribution of the separator feed against its fines and coarse reject streams, and it looks intimidating the first time someone sees the plotted line. In practice it collapses down to three numbers a plant operator or process engineer actually needs to track, and each one points at a different kind of fix.
Cut Point
The particle size where a grain has an equal chance of leaving as product or being sent back as reject. This sets the practical fineness of the finished cement and has to track the clinker grindability and target Blaine, not sit fixed at a value tuned months ago.
Sharpness
How steep the curve rises around the cut point. A sharp separation sends coarse material back and lets fines through cleanly; a shallow one misclassifies in both directions, mixing coarse grains into the product stream and fine ones into the reject stream at the same time.
Bypass
The floor of the curve at the fine end — the percentage of particles that were already fine enough to leave but got sent back to the mill anyway. This is the most expensive of the three because every bypassed grain re-enters the mill, consumes grinding capacity, and often bypasses again on its next pass through the separator.
The Circuit-Level View
Where the Recirculation Factor Comes From, and Why It Moves
The recirculation factor (often called circulating load) is the ratio of coarse material returned to the mill against fresh feed entering the circuit, and it is the clearest downstream symptom of what the Tromp curve is describing upstream. A closed-circuit ball mill with a well-tuned separator typically settles somewhere between 100% and 250% circulating load, while a vertical roller mill's internal separator commonly runs a much higher circulation factor across its nozzle ring, sometimes in the range of 15 to 25 times fresh feed. Neither number is inherently good or bad on its own — what matters is whether the load is doing useful work, carrying coarse particles back for another grinding pass, or whether a large share of it is fine material that bypassed the cut and is simply being reground for no benefit. A rising recirculation factor with a stable or falling bypass usually means the mill needs attention; a rising recirculation factor alongside rising bypass almost always means the separator does.
Field Diagnosis
Matching a Control Room Symptom to Its Separator Cause
Most separator problems show up first as a mill symptom, which is exactly why they get chased in the wrong place. This checklist connects the two.
| What the Control Room Sees | Likely Separator Cause | What to Check First |
|---|---|---|
| Output dropping at a constant feed rate | Cut point has widened, coarse material recirculating without being reduced | Rotor speed against current clinker grindability |
| Fineness inconsistent between samples | Sharpness has degraded, curve misclassifying near the cut point | Separator air flow and feed distribution across the rotor |
| Mill power rising without output gain | Bypass climbing, fines being reground with no benefit | Fines fraction in the coarse reject stream |
| Recirculation factor drifting upward over weeks | Cut point and bypass both moving, compounding gradually | Trend of cut size against feed rate over recent weeks |
| Blaine holding steady while power climbs | Load balance between mill and separator no longer matched | Circulating load against installed separator capacity |
See Your Own Cut Point, Sharpness, and Bypass Trended Over Time
Most plants have only ever seen a Tromp curve as a single snapshot from the last sampling campaign. A short session shows what the same three numbers look like tracked continuously against your mill's actual feed and power data.
Applied Example
How a Slow Cut-Point Drift Turned Into a Six-Week Power Problem
A finish mill circuit had been running comfortably at a fixed separator speed for several months, tuned against a clinker source that ground easily. When the plant switched to a harder clinker blend from a different quarry face, nobody adjusted the separator, since nothing in the control room pointed at it directly. Over roughly six weeks, the cut point drifted wider as the rotor kept classifying at a speed suited to the old material, the recirculation factor climbed from a comfortable range toward the high end of normal, and bypass crept up alongside it. Mill power consumption per ton rose gradually enough that it looked like normal variation until a Blaine complaint from a customer triggered a manual sampling campaign. The Tromp curve from that campaign showed a cut point roughly 15 microns wider than target and a bypass nearly double its usual level. A rotor speed adjustment matched to the new clinker grindability brought both back in range within a single shift, and specific power consumption dropped back to its prior baseline almost immediately — the fix was fast once someone knew where to look, and the six weeks of extra energy spent regrinding already-fine cement were the actual cost of not seeing it sooner.
Manual Testing vs Continuous Tracking
Two Ways to Know Where Your Separator Actually Stands
A physical Tromp curve test built from laser particle size analysis of feed, fines, and reject samples remains the most detailed single snapshot of separator performance available, and it stays useful as a periodic reference point. The limitation isn't accuracy, it's frequency — most plants can only justify running that sampling campaign a handful of times a year, which leaves long windows where a drifting cut point goes unmeasured.
Manual Tromp Test
High detail on the day it's run, but only a single point in time between infrequent sampling campaigns.
Fixed-Interval Trending
Catches large shifts if the interval happens to align, but still misses gradual drift between scheduled checks.
Continuous Signal Tracking
Infers cut point, sharpness, and bypass from the mill's existing feed, power, and fineness signals every cycle.
What It Actually Costs
Where a Wide Cut and a High Recirculation Factor Show Up on the Energy Bill
Grinding is the single largest electrical load in most cement plants, and the separator sits at the exact point in the circuit where wasted grinding energy either gets caught or gets compounded. A bypass level running higher than it should be doesn't just waste the energy spent on the original grind — it sends that material back through the mill for a second, sometimes third pass, consuming grinding media wear and mill capacity that could otherwise be processing fresh feed. Over a full production run, even a modest increase in bypass translates into a measurable rise in specific power consumption per ton of cement, the kind of change that rarely triggers an alarm on its own but adds up clearly across a monthly energy report. A recirculation factor that has quietly climbed past its normal range compounds the same effect, since more of the mill's total throughput is reground material rather than fresh feed being processed for the first time.
Separator tuning has always suffered from being invisible until it's expensive. A process engineer can read a Tromp curve perfectly well once the samples are in hand, but very few plants have the manpower to run that sampling campaign every week across every mill on site. What changes when the same three numbers get tracked continuously from existing process signals is the response time — a cut point that starts drifting on a Tuesday gets caught that week instead of showing up as a power consumption anomaly in next month's report.
Devraj Malhotra
Grinding Systems and Process Optimization Consultant · 16 years in cement process engineering
Before You Start
What to Confirm Before Adding Continuous Separator Monitoring
A short readiness check shows how quickly existing mill data can turn into a live Tromp curve view.
| Question | Why It Matters |
|---|---|
| When was the last physical Tromp curve test run on this separator? | Gives a reference point to validate continuous tracking against |
| Are feed rate, mill power, and fineness already logged in the historian? | These are the core signals used to infer separator performance continuously |
| Does rotor speed change with clinker source or stay fixed? | Shows how often the cut point is likely drifting from target today |
| Who currently reviews recirculation factor trends, and how often? | Defines the workflow a continuous alert needs to fit into |
Common Questions
Separator Efficiency and Recirculation Factor — Frequently Asked
These are the questions process teams tend to ask first when they start looking closely at Tromp curve behavior and circulating load.
Do I still need to run physical Tromp curve tests if I add continuous tracking?
Yes, periodic physical sampling still has a role because it gives a fully independent, lab-verified check on particle size distribution that continuous tracking uses as a calibration reference. What changes is how often the plant is flying blind between those tests, since inferred cut size, sharpness, and bypass can be watched every cycle instead of a handful of times a year. Most teams end up running physical tests less frequently once continuous tracking is in place, using them to confirm the model rather than as the only source of truth. Book a demo to see how the two work together on an active circuit.
Is a high recirculation factor always a sign of a problem?
No, a high circulating load is normal and often intentional, especially on vertical roller mills where the internal separator is designed to run a much higher circulation factor across the nozzle ring than a ball mill circuit would. The distinction that matters is whether that recirculating material is genuinely coarse and needs another grinding pass, or whether a meaningful share of it is fine material that bypassed the separator and is simply being reground for no benefit. Tracking bypass alongside the recirculation factor is what separates a healthy high-circulation circuit from an inefficient one. Ask our team about interpreting your circuit's normal range.
Can separator performance be tracked without installing new sensors?
In most plants, yes, since the signals needed to infer cut size, sharpness, and bypass — feed rate, separator speed, air flow, product fineness, and mill power — are already being logged by the existing control system for other purposes. The work is in connecting those existing signals into a model that reconstructs separator behavior between physical sampling campaigns, rather than adding new instrumentation to the classifier itself. Some circuits benefit from a small amount of additional fineness sampling to sharpen the model early on. Book a session to review what your current historian already captures.
Does this apply to both ball mill separators and vertical roller mill classifiers?
Yes, both circuit types use a dynamic classifier and the same underlying principles apply, even though the typical circulating load ranges look very different between them. A ball mill circuit closed with a high-efficiency separator commonly runs a circulating load between 100% and 250%, while a vertical roller mill's internal separator operates against a much higher circulation factor by design. The engine tracking cut point, sharpness, and bypass is configured against the normal range for the specific mill type rather than a single fixed target. Contact support to confirm fit for your mill configuration.
How quickly does fixing a drifted cut point usually show up in power numbers?
Once a separator adjustment is made — typically a rotor speed or air flow change matched to current clinker grindability — the effect on bypass and recirculation factor is usually visible within the same shift, since the classifier's separation behavior responds almost immediately to the change. Specific power consumption per ton takes a little longer to stabilize as the mill works through the material already in circulation, but a clear downward trend is common within a day or two. The larger cost isn't the fix itself, it's the weeks a drift can run undetected before someone notices the symptom in a monthly energy report. Book a call to see this applied to your own circuit's data.
Stop Waiting for the Next Sampling Campaign to Find Out Where Your Separator Stands
iFactory reconstructs cut point, sharpness, and bypass from the feed, power, and fineness signals your mill already produces, turning recirculation factor management from a quarterly test into a number your team can watch every day.