Specific power consumption sounds like a simple term, electricity used per tonne of product, but the figure gets surprisingly inconsistent between plants and even between months at the same plant once you look closely at how it was actually calculated. One plant measures it against clinker output, another against finished cement, and a third includes auxiliary loads that a competitor excludes entirely. None of these approaches is wrong exactly, but comparing them directly without knowing the measurement boundary is how a lot of misleading benchmarking happens. Getting clear on the definition, the boundary, and what affects the number is what makes specific power consumption useful internally, even before any external comparison enters the picture, and if you want to work through how your own plant currently calculates it, you can review your measurement approach with our team.
Understand What Specific Power Consumption Actually Measures
A clear technical guide to the definition, measurement boundaries, and product mix effects behind specific power consumption, so the figure means the same thing every time it gets reported.
Definition and Formula, Stated Precisely
The formula itself is simple, but every useful application of it depends on being explicit about exactly which energy and which output are included.
Measurement Boundaries That Change the Number
Two plants can report the same underlying operating efficiency and still show different specific power consumption figures purely because of where the measurement boundary was drawn.
| Boundary choice | What it includes | Effect on the figure |
|---|---|---|
| Clinker-only boundary | Raw mill, kiln, and preheater loads only | Isolates kiln-line efficiency specifically |
| Full cement boundary | Clinker stage plus cement grinding and packing | Higher figure, reflects full production |
| Including auxiliary loads | Lighting, compressed air, and utility systems | Adds a smaller but consistent overhead to the figure |
| Excluding standby losses | Only active production periods counted | Lower figure than one including idle or startup periods |
None of these boundary choices is inherently more correct, but mixing them across different reporting periods or comparing across plants using different boundaries produces a misleading trend line.
What Equipment-Level Data Adds to the Picture
A single plant-wide specific power consumption figure averages away the differences between individual process stages, each of which responds to different operating factors.
Review Your Own Measurement Boundary
Share how your plant currently defines specific power consumption and we will check it against common industry approaches.
How Product Mix Changes the Figure Without Any Efficiency Change
A shift in product mix, such as producing more blended cement with supplementary materials, can move specific power consumption up or down even if every piece of equipment is running exactly as efficiently as before.
Tracking product mix alongside specific power consumption is what prevents a genuine production mix shift from being misread as an efficiency improvement or decline.
Benchmarking Cautions Worth Keeping in Mind
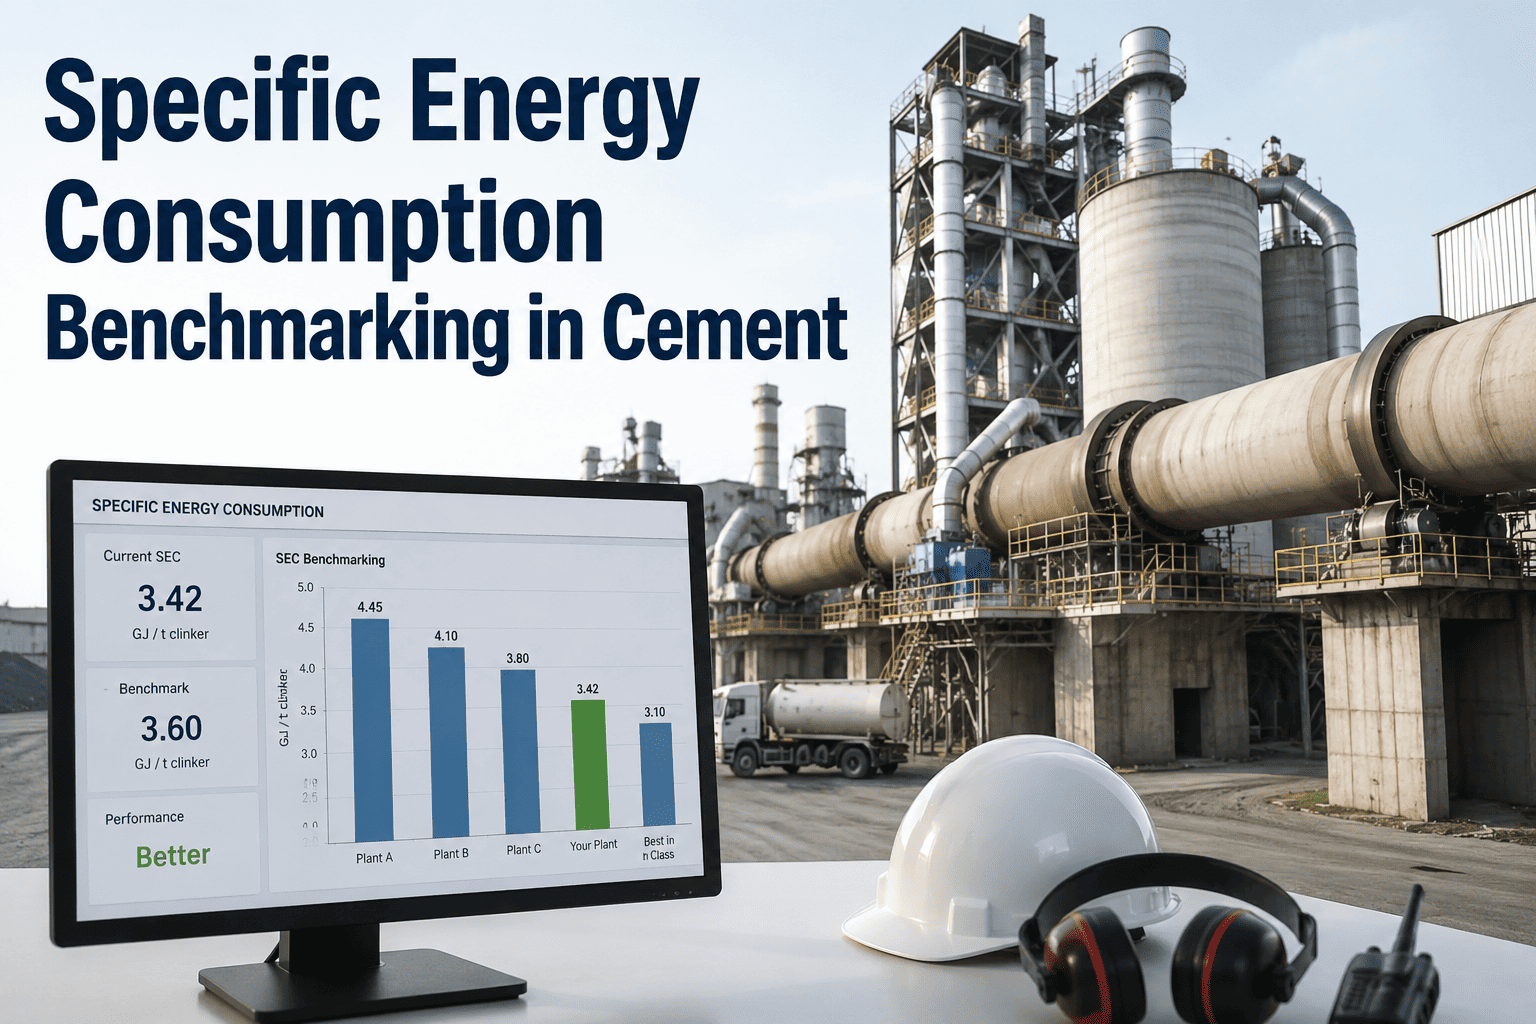
External benchmarks are useful for context, but comparing your own figure directly against a published industry number carries real risk if the boundaries do not actually match.
What iFactory Cement and Energy Specialists Recommend
iFactory cement and energy specialists who work with plants on energy reporting consistently recommend documenting the exact measurement boundary used for specific power consumption in writing, since the most common source of confusion is not the calculation itself but disagreement over what was actually measured.
They also note that stage-level tracking, rather than a single plant-wide figure, is what actually helps identify where an efficiency gain or loss originated, since the plant-wide number alone cannot distinguish a kiln issue from a cement mill issue.
What Plant Teams Ask About Specific Power Consumption
Get Clarity on Your Plant's Specific Power Consumption
Book a session with iFactory AI to review your measurement boundary and build stage-level tracking for specific power consumption.