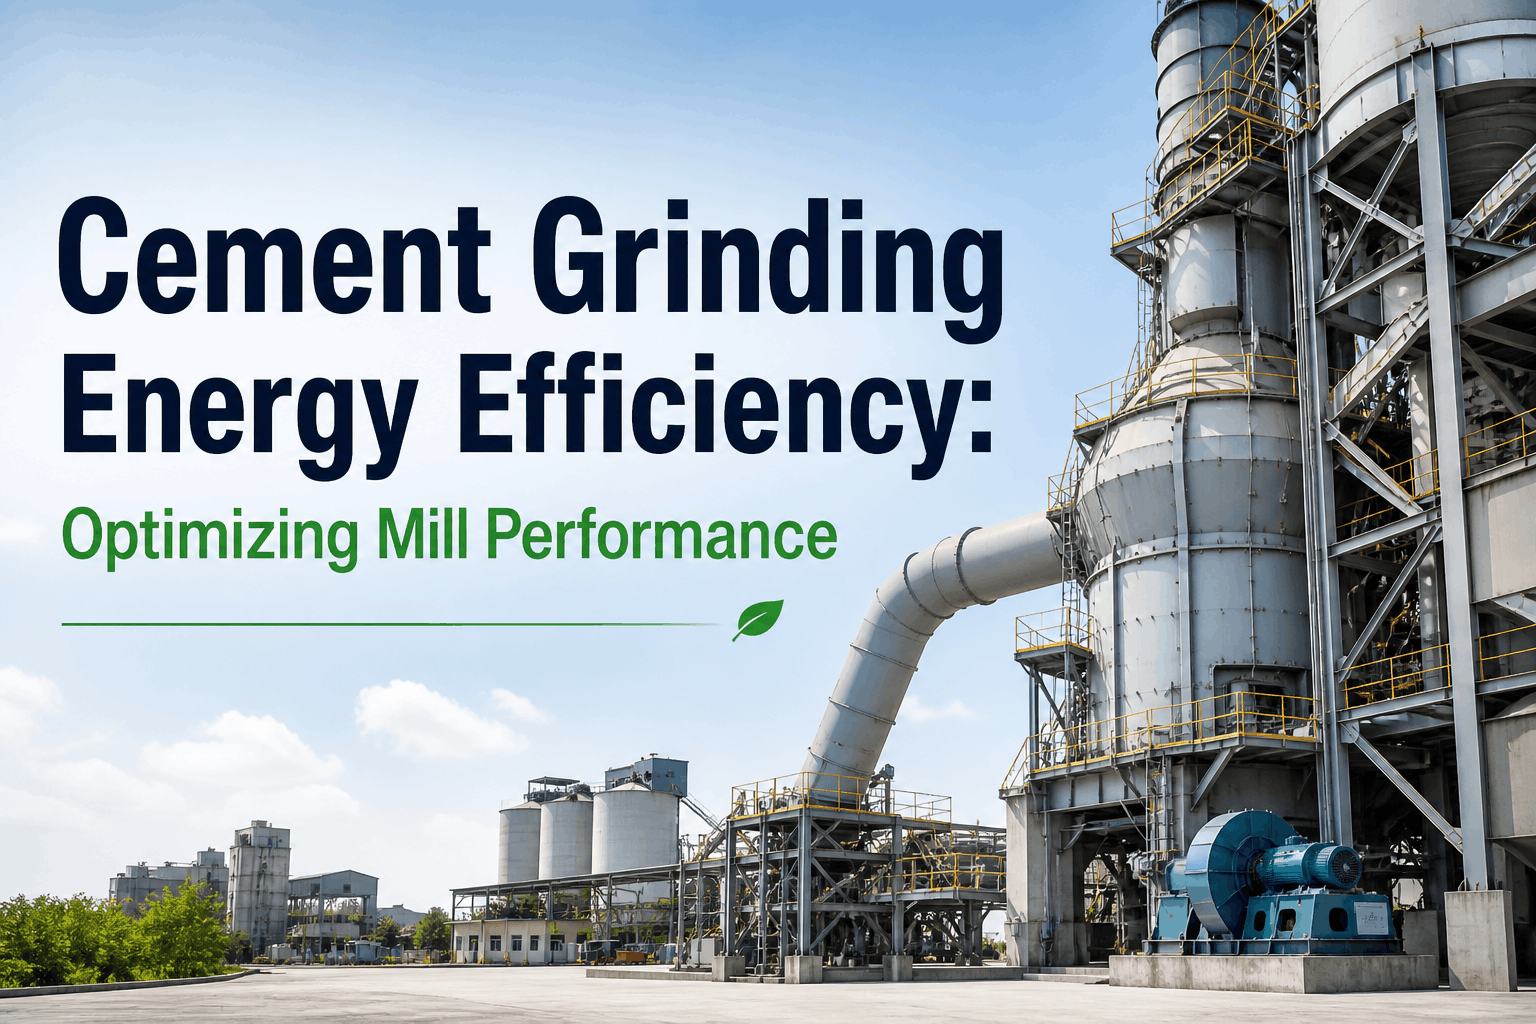
A vertical roller mill rarely dies of a single dramatic failure. It fades — a few kWh per ton at a time, a few microns of table liner at a time, a fraction of a millimeter per second of vibration at a time — until throughput has quietly dropped eight to twelve percent and nobody can point to the day it started. VRMs now carry the majority of grinding duty in most modern cement plants, which means every gram of wear on a roller tyre or every millimeter lost off the dam ring translates directly into lost margin at plant scale. This article walks through the table, roller, and separator parameters that actually determine VRM performance, and how continuous condition tracking with iFactory catches the drift long before it shows up as a throughput problem.
CEMENT & RAW GRINDING · VRM PERFORMANCE
Your VRM Is Either Grinding At Its Design Point Or Quietly Drifting Away From It
Table condition, roller wear, and separator tuning interact constantly — a worn liner changes bed depth, an unstable bed increases vibration, and rising vibration accelerates wear across the whole mill. iFactory tracks all three simultaneously against your production data, so the drift gets caught in days, not during the next planned outage.
Six Components That Decide Your VRM's Fate
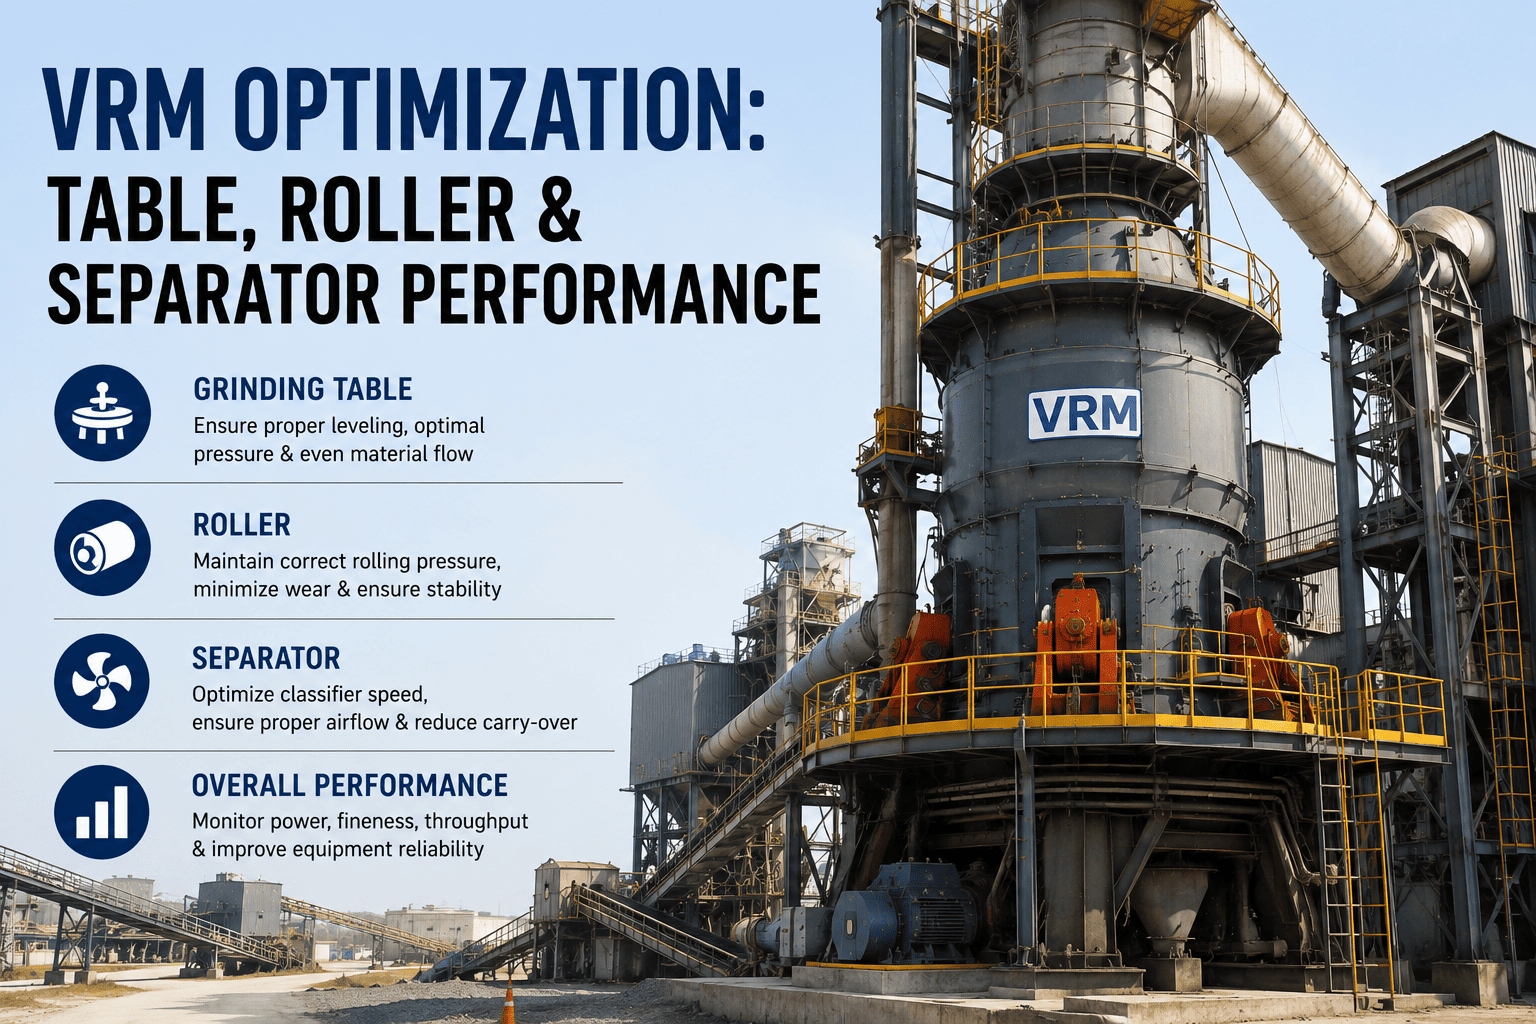
Every VRM optimization conversation eventually comes back to the same six mechanical elements. Understanding how they interact is the foundation for reading any trend chart your mill produces, because a deviation in one almost always has its root cause in another.
1
Grinding Table — the rotating surface that carries the material bed under the rollers and sets the foundation for every downstream parameter.
2
Grinding Rollers — apply hydraulic compressive force to the bed; tyre profile and thickness directly set grinding pressure and nip geometry.
3
Dam Ring — the rim around the table edge that holds the material bed at the correct depth and controls the reject rate.
4
Nozzle Ring — sets the velocity of hot gas entering the mill, fluidizing ground material and carrying it up toward the classifier.
5
Hydraulic System — accumulators maintain consistent roller loading pressure; pre-charge decay here is one of the most common causes of a vibration trip.
6
Separator / Classifier — the dynamic cage that returns oversize particles to the table, setting final product fineness and recirculating load.
Why VRM Now Dominates Modern Grinding Circuits
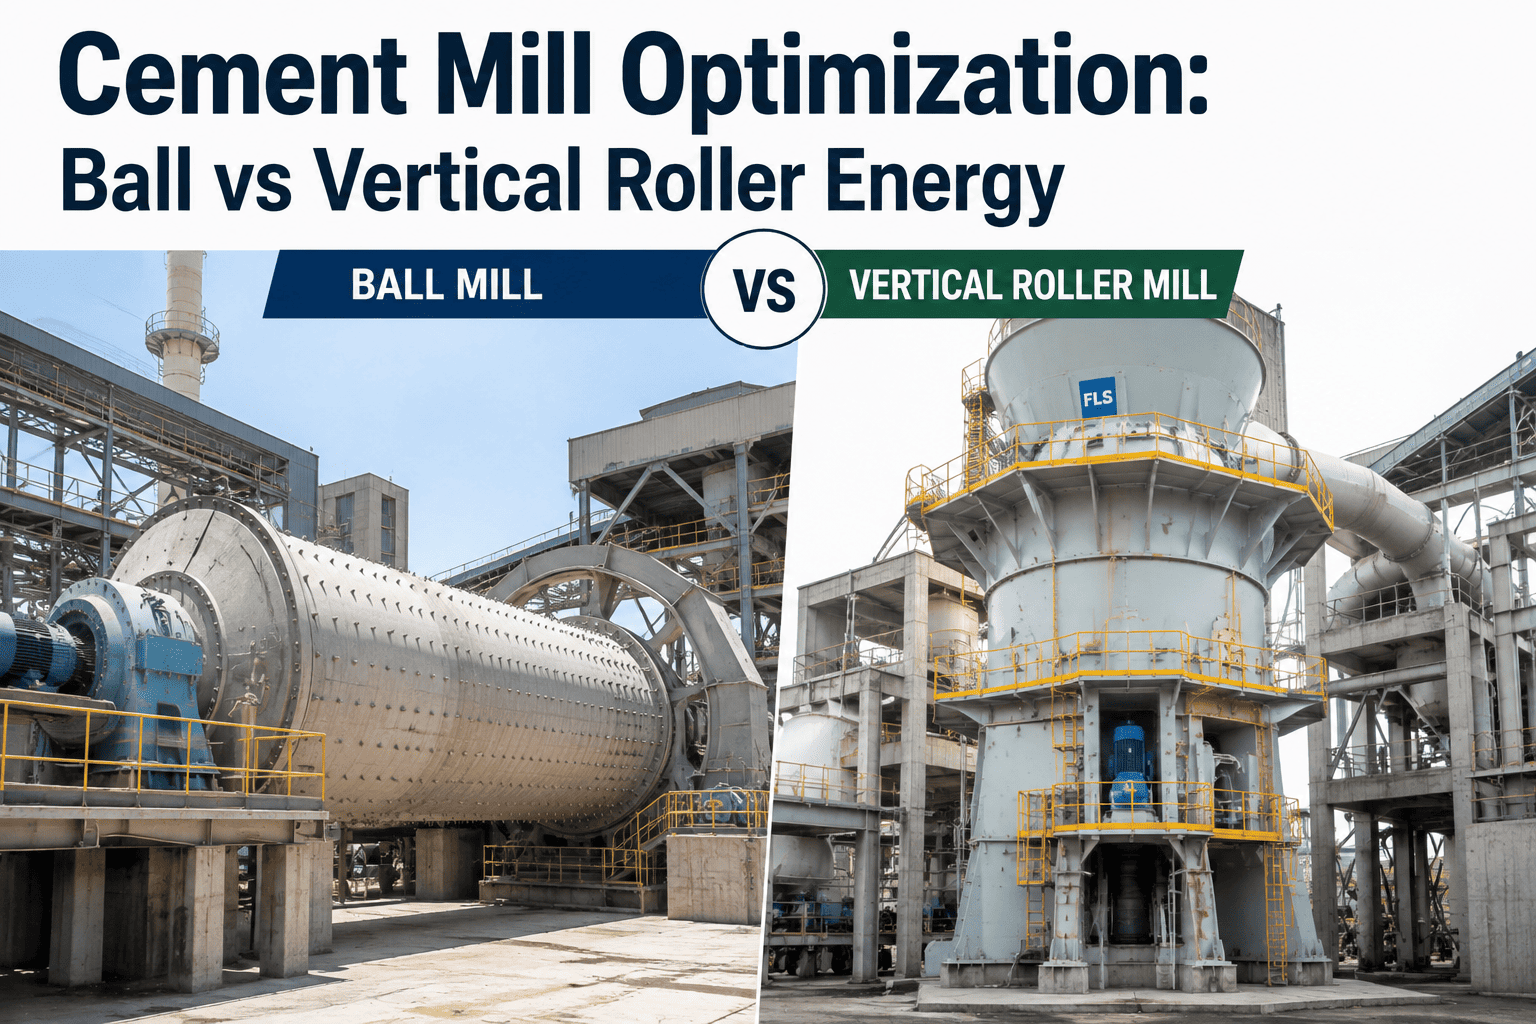
The shift toward vertical roller mills over the past two decades was not a fashion choice — it was a direct response to how much energy a compression-grinding bed saves compared with the impact-and-attrition mechanism inside a ball mill. Bed compression grinding is fundamentally more efficient at converting applied force into particle breakage, and it shows up directly in the numbers: a VRM installation typically needs fifty to seventy percent less floor space than an equivalent-capacity ball mill circuit, and it can cut energy consumption by twenty to thirty percent for the same throughput and fineness target. A VRM also folds drying, grinding, and classification into a single machine, using hot kiln exhaust gas to dry raw material with moisture content as high as fifteen percent without any separate drying stage. That combination of efficiency and footprint is exactly why VRMs now carry roughly seventy percent of the electrical grinding load inside a typical modern cement plant — which also means that a percentage point of lost efficiency on a VRM carries a far larger financial consequence than the same percentage point lost on a smaller ball mill circuit.
Operating Parameters And Their Target Ranges
Most VRM process upsets show up first as a deviation in one of these five measured parameters, well before they show up as a fineness or throughput complaint. Trending them continuously against a known-good baseline is the fastest way to catch a developing problem while it is still a cheap fix.
| Parameter |
Typical Stable Range |
What A Deviation Usually Means |
| Dam Ring Height |
2.5 – 4% of table diameter |
Too low starves bed depth; too high risks choking and rising differential pressure |
| Bed Depth Stability |
Consistent, no cyclic surging |
Surging bed depth signals dam ring wear or feed rate instability |
| Mill Vibration |
Below manufacturer trip threshold |
Rising trend usually traces to roller wear, hydraulic pressure loss, or an unstable bed |
| Differential Pressure (DP) |
Stable within design band |
Climbing DP often points to nozzle ring blockage or excess material recirculation |
| Hydraulic Accumulator Pre-Charge |
Within 8–15% of rated annual decay |
Undetected decay leads to roller bounce and sudden vibration trips |
These five parameters rarely move in isolation. In practice, a deviation in dam ring height shows up first as a bed depth change, which then drives vibration and differential pressure in the same direction within a matter of hours or days. Reading them as a connected system, rather than as five independent gauges on a control room screen, is what separates a plant that catches drift early from one that only discovers it once fineness or throughput has already been affected.
The Three Condition Zones That Drive VRM Efficiency
Rather than tracking dozens of individual readings in isolation, the most effective VRM programs organize condition monitoring into three zones. Each zone has its own failure signature, its own inspection cadence, and its own effect on specific energy consumption.
Zone 01
Table And Bed Stability
A five percent increase in dam ring height can raise bed thickness by fifteen to twenty percent, which shows how sensitive this single component is to wear and adjustment. As table liner segments wear, the effective bed depth and roller nip geometry shift, and product fineness can drift six to fourteen percent before an operator notices anything on a routine check. Holding dam ring height and liner profile within their optimal band can cut specific energy consumption by up to ten percent on its own, making table condition arguably the single highest-leverage parameter on the entire mill. Bed instability rarely stays contained to fineness alone — a surging bed almost always shows up in the vibration trend within days, which is why table condition should be the first place any deviation investigation starts.
Zone 02
Roller Wear And Hydraulic Health
Roller tyres retire on wear, not on a fixed calendar, yet many plants still schedule replacement by the month rather than by cumulative tonnes processed — a practice that either retires tyres with twelve to twenty percent of usable life still on them, or lets wear run past the safe window into a structural failure. A single emergency roller tyre change can cost four times more than a planned one once expedited logistics and unplanned downtime are added up. Hydraulic accumulator pre-charge pressure decays gradually every year under normal operation, and once it goes undetected it shows up as roller bounce or a sudden mill vibration trip that idles the whole line. Because the roller and the hydraulic system share the same load path, wear and pressure loss compound each other — a slightly worn tyre needs slightly more hydraulic force to maintain grinding pressure, which accelerates accumulator fatigue in turn.
Zone 03
Separator And Classifier Tuning
The dynamic classifier sitting above the grinding table decides how much material gets accepted as product versus rejected back to the table for another pass, and every unnecessary reject is energy spent twice. Separator vane wear and cage speed drift gradually, the same way roller tyres and table liners do, which is why classifier inspection belongs on the same structured cadence rather than being left until fineness complaints force an unscheduled check. A well-tuned separator paired with stable bed depth is what actually lets a VRM approach its design specific energy consumption instead of settling permanently a few kWh per ton above it. Because separator performance interacts with recirculating load, an underperforming classifier also inflates the apparent throughput requirement on the table itself, masking the true production capacity of the mill.
The Cost Of Waiting Until The Next Scheduled Outage
A single unplanned VRM trip does not stay contained to the mill itself — because most cement lines run one dominant grinding asset per stage, an outage on that mill frequently idles the entire kiln line behind it, turning a mechanical problem into a full production stoppage. Industry data from plants running structured condition programs shows unplanned stoppages from undetected hydraulic pressure loss alone averaging eighteen hours and roughly $140,000 in lost production per event, while a full unplanned mill trip from an undiagnosed root cause can cost upward of $500,000 once emergency repairs, expedited parts, and lost output are all counted. Predictive systems that catch a developing roller bearing failure two weeks in advance turn that same event into a planned swap during an already-scheduled stop, at a fraction of the cost and with zero unplanned downtime. That gap — between a $500,000 emergency and a routine planned task — is the entire financial argument for treating VRM condition monitoring as a continuous discipline rather than a quarterly inspection checklist.
Track Table, Roller, And Separator Condition In One View
iFactory links liner thickness, roller tyre profile, hydraulic pressure trends, and separator condition to your production data automatically, flags approaching-limit wear before it becomes a forced outage, and shows exactly which zone is costing you kWh per ton right now.
Reading The Warning Signs Before They Become An Outage
VRM problems escalate through recognizable stages, and the cost of intervention rises sharply at each one. Catching a signal at the early stage is a scheduling decision; missing it until the critical stage is an emergency shutdown.
Early
Vibration trending upward by a fraction of a millimeter per second with production otherwise unchanged — usually the first measurable sign of table or roller wear beginning to progress.
Developing
Differential pressure creeping outside its stable band alongside a slowly rising kWh per ton figure — frequently traces to nozzle ring restriction or a bed depth that has started to surge.
Developing
Product fineness drifting outside specification with feed rate and classifier speed unchanged — a strong indicator that table liner or dam ring wear has altered the bed geometry.
Critical
Sudden roller bounce or a vibration trip shutting the mill down without warning — almost always traced back to hydraulic accumulator pre-charge that decayed undetected for months.
Critical
Throughput down eight to twelve percent from baseline with no single alarm ever having fired — the signature of wear that accumulated quietly across the table, rollers, and separator at once.
What A Structured Condition Program Delivers
These are not theoretical numbers. Cement producers who moved from calendar-based VRM maintenance to continuous, data-linked condition tracking report consistent, measurable gains across availability, energy, and unplanned downtime.
99.2%
Mill availability achieved after structured condition monitoring, up from a 94.5% baseline
18%
Reduction in specific power consumption within six months of deployment
14 days
Advance warning delivered ahead of a roller bearing failure, enabling a planned swap instead of an emergency stop
20–30%
Typical reduction in spare parts inventory once replacement shifts from calendar-based to condition-based
Building A VRM Condition Program In Four Steps
Moving from reactive troubleshooting to a structured condition program does not require a full instrumentation overhaul on day one. Most plants start with the data they already generate and expand from there once the first round of savings validates the approach.
01
Register Every Wear Component Individually
Track each roller tyre position and each table liner segment as its own asset record rather than logging a single mill-level average, since wear is rarely uniform across the table.
02
Set Approaching-Limit And Condemn Thresholds
Configure two alert levels per wear point — one that gives a six to eight week ordering window, and one that triggers immediate scheduling — so parts are never expedited at emergency premium prices.
03
Link Wear Data To The Production Record
Correlate liner and roller wear trends directly against kWh per ton and fineness data, so a specific energy deviation immediately surfaces its most likely mechanical root cause.
04
Review Vibration And Hydraulic Trends Weekly
Treat vibration and accumulator pressure the same way a safety metric is treated — reviewed on a fixed cadence rather than only after a trip has already occurred.
Frequently Asked Questions About VRM Optimization
What is the correct dam ring height for a vertical roller mill?
Dam ring height is typically set between 2.5 and 4 percent of the table diameter, though the exact figure depends on material properties, gas velocity, and mill load. Because a five percent change in dam ring height can shift bed thickness by fifteen to twenty percent, adjustments should be made incrementally and verified against vibration and differential pressure trends before locking in a new setting. You can review your mill's specific configuration by requesting a
demo of iFactory's VRM analytics.
How often should roller tyres and table liners be inspected?
Wear should be measured against cumulative tonnes processed rather than a fixed calendar interval, since throughput and material hardness both affect wear rate significantly. Most structured programs take thickness and profile readings on a regular short cycle, typically every one to two weeks, with automated alerts firing well before a segment reaches its condemn limit.
What usually causes a sudden VRM vibration trip?
The most common root cause is hydraulic accumulator nitrogen pre-charge pressure that has decayed gradually over months without being checked, eventually allowing roller bounce under normal operating loads. Unstable bed depth from dam ring or liner wear is the second most frequent cause, which is why vibration, hydraulic pressure, and bed stability should always be reviewed together rather than in isolation — treating any one of them as an independent alarm tends to miss the actual chain of cause and effect.
How much energy can a well-optimized VRM save compared to a poorly maintained one?
Holding dam ring height, liner condition, and separator tuning within their optimal ranges can reduce specific energy consumption by up to ten percent from table and bed control alone, with broader condition-monitoring programs reporting overall reductions in the range of ten to eighteen percent once roller and hydraulic health are included as well.
What data does a VRM condition monitoring platform need to get started?
The essential inputs are vibration readings, differential pressure, mill power draw, throughput, and a wear history for rollers, table liners, and the separator. Most plants begin seeing actionable trends within the first few weeks of connecting this data. Contact
iFactory support to scope the exact connections required for your mill configuration.
Stop Discovering VRM Wear After It Costs You Production
iFactory connects to your CMMS and mill instrumentation to track table, roller, and separator condition continuously, correlate every deviation with its most likely root cause, and give your team the six to eight week ordering window that turns emergency shutdowns into planned outages. Whether you run a single VRM or a full fleet across multiple plants, the same view lets you compare specific energy and wear rates side by side and replicate whatever your best-performing mill is already doing right.