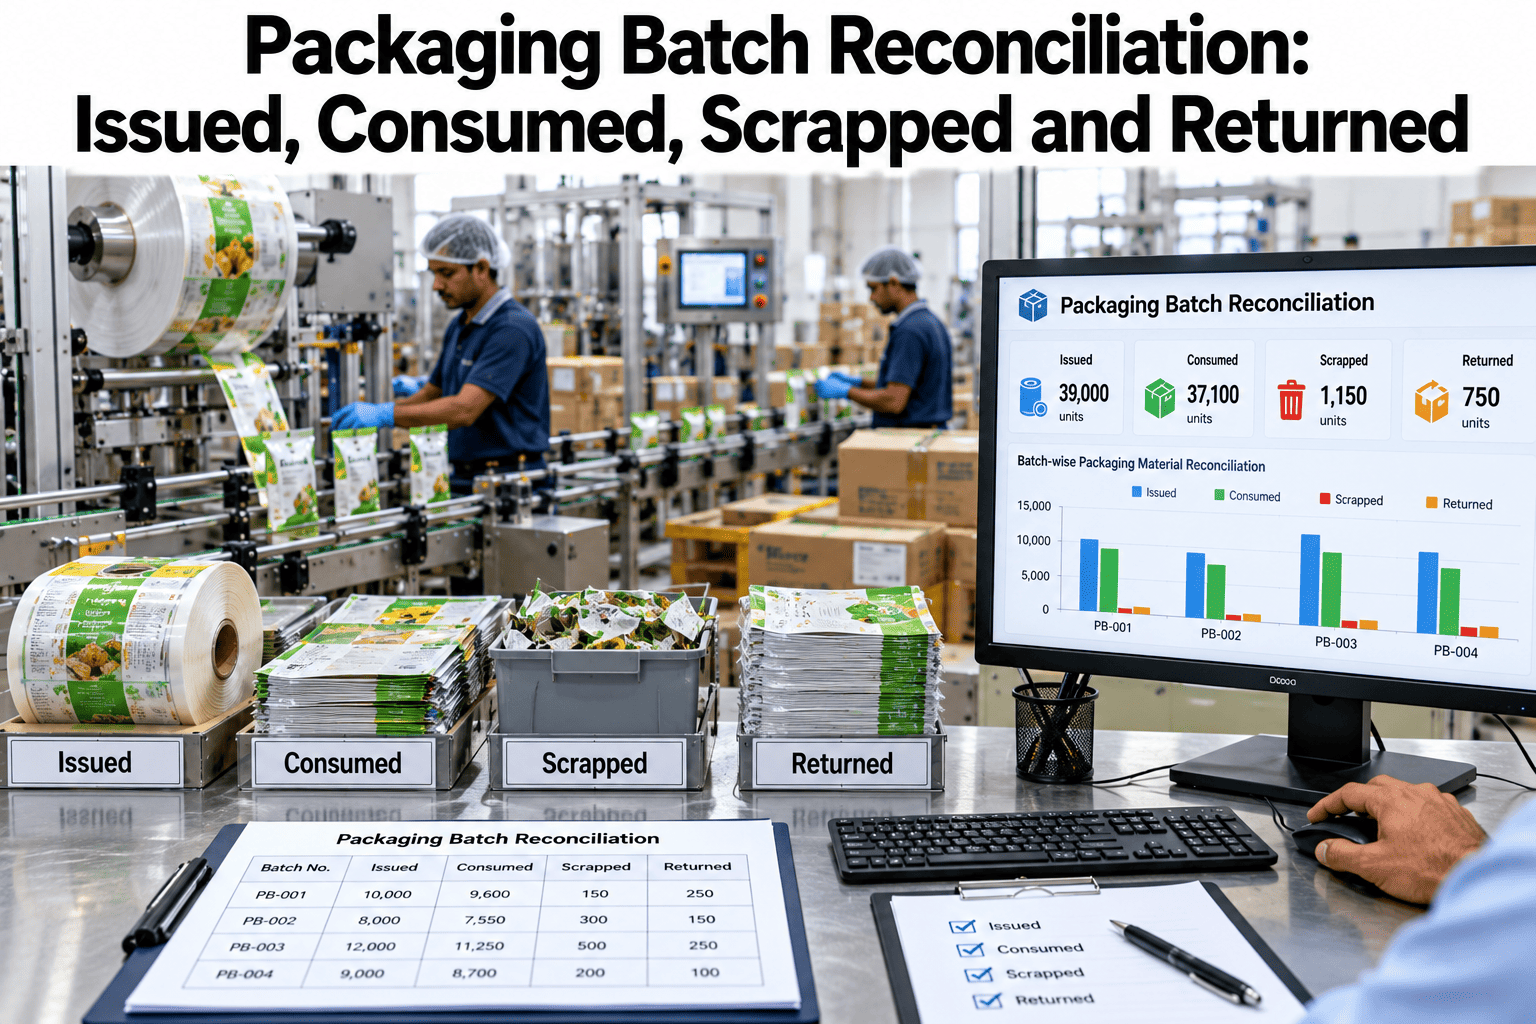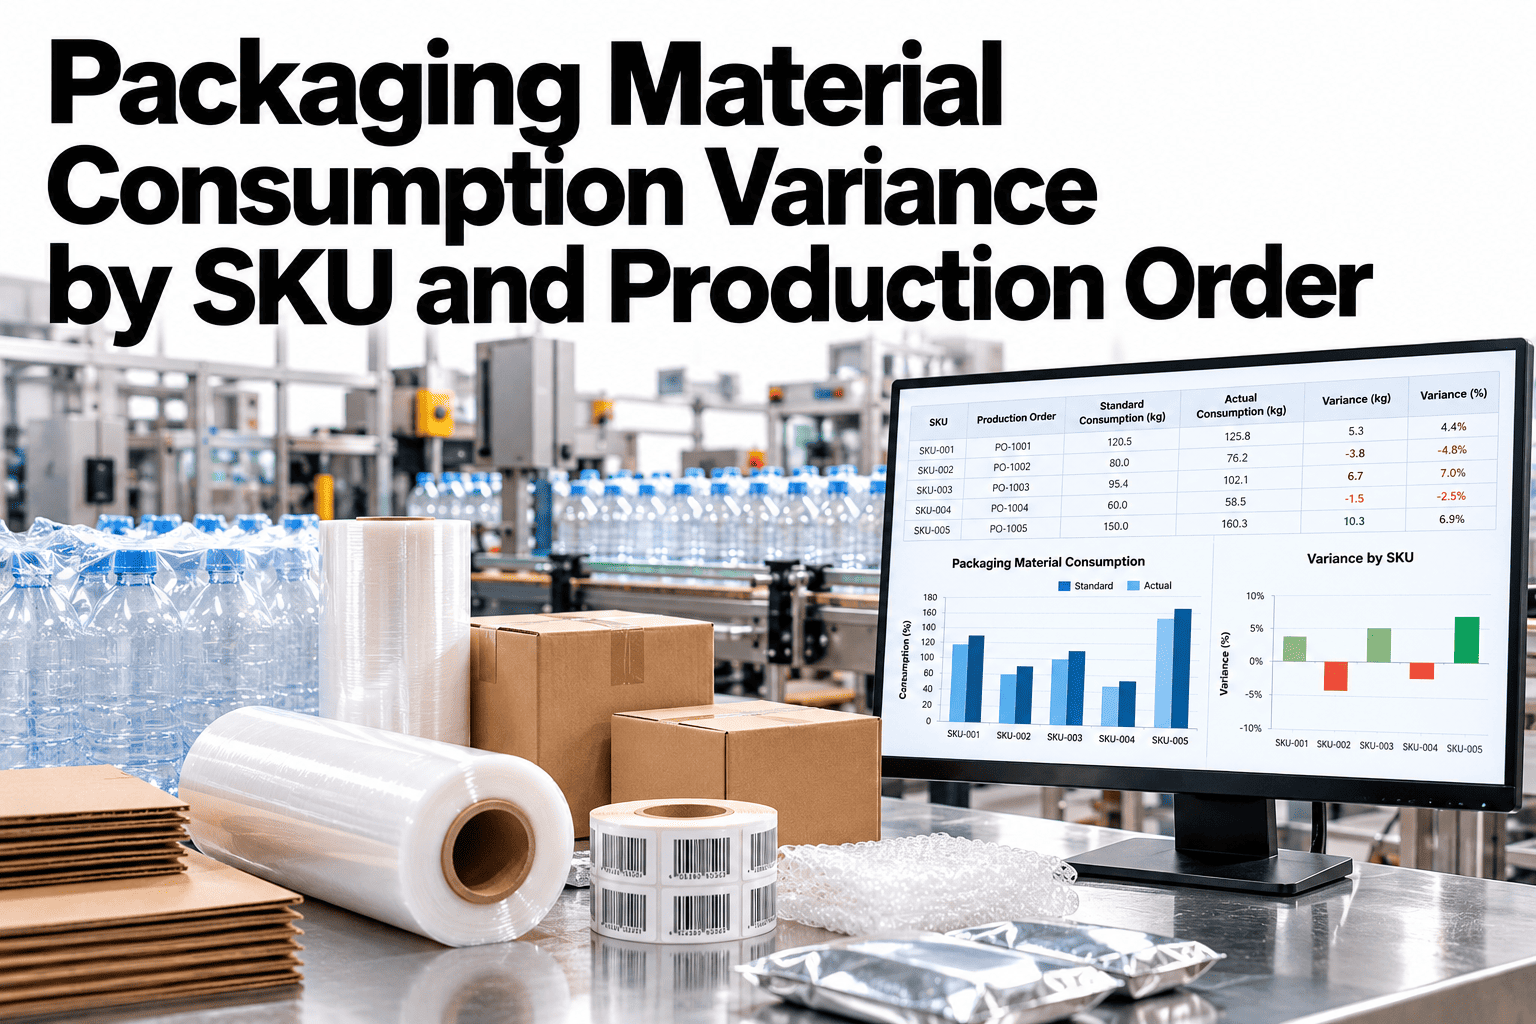
A packaging line that consistently uses six percent more film than its bill of materials says it should is not necessarily running badly; it might be running exactly as it always has, while the BOM itself was set years ago against assumptions nobody has revisited since. Material consumption variance only becomes useful once it is tracked by SKU and production order, because a plant-wide average blends a well-controlled line in with a chronically over-consuming one and tells nobody which is which. The fix usually starts with simply seeing the gap, by order, instead of guessing at it. See material consumption variance broken down by your own SKUs.
See Where Packaging Material Actually Goes
iFactory AI tracks standard versus actual material usage by SKU and production order, separating real scrap and changeover waste from an outdated BOM assumption.
Standard Usage Is an Assumption, Not a Fact
A bill of materials encodes an assumption about how much film, board, or label stock a run should consume, and that assumption can quietly go stale as equipment ages, suppliers change, or a line's actual changeover pattern shifts, which means a variance report comparing actual usage to a years-old BOM is often measuring the wrong thing.
Three Sources of Variance, Read Separately
Not every unit of variance has the same cause, and lumping them together makes the real problem harder to find.
BOM Assumption Drift
The standard itself no longer reflects current equipment, supplier material, or line setup.
Scrap
Material consumed but not converted into finished, saleable packaging output.
Changeover Waste
Material lost during setup and changeover between production orders or SKUs.
True Overuse
Consumption genuinely exceeding standard due to a process or equipment issue.
Break Down Your Own Variance by SKU
Book a 30-minute session and see standard-versus-actual material consumption broken down by your own SKUs and production orders.
Reading a Variance by Its Pattern
The shape of a variance across orders usually points to which of the three sources is driving it.
| Pattern | Likely Source | Where to Act |
|---|---|---|
| Consistent small overage across every order | BOM assumption drift | Revisit the standard itself |
| Spikes tied to short production runs | Changeover waste | Review setup procedure and run-length scheduling |
| Variance tied to one specific supplier lot | Material quality variation | Check incoming material against supplier spec |
| Growing trend over several weeks | Equipment wear affecting material usage | Inspect the specific line or station |
From Order Data to Variance Report
Variance reporting runs against the same production order and material consumption data your plant already generates.
Rolling Out on the Packaging Floor
iFactory AI connects to your existing material issuance and production order system to build variance reporting without a separate data entry process.
What Unresolved Variance Actually Costs
A few percentage points of material variance sound small until they are multiplied across a full production year, and the cost difference between the worst-performing and best-performing SKU is usually far larger than a plant-wide average would suggest.
Variance Trend Over a Quarter
Tracking variance over time, not just as a single snapshot, shows whether a correction actually worked.
Expert Review
The first variance review on a new SKU breakdown usually turns up at least one BOM standard that was set years ago and never revisited, and correcting that single number often closes more of the reported variance than any process change on the floor.
Frequently Asked Questions
Does this require re-entering our current BOMs?
No, existing BOM data is imported from your current system and used as the comparison standard rather than re-entered manually. Support can confirm what BOM data is already available.
How is scrap separated from true material overuse?
Scrap events are tagged separately where your production system already logs them, so the variance report distinguishes scrapped material from material consumed into finished product.
Can this flag when a BOM standard itself needs updating?
Yes, a consistent small variance across every order on a SKU is flagged as a likely BOM assumption issue rather than an operational one, pointing directly at the standard to review. See a BOM-flagging example on a call.
Does this work across multiple packaging material types?
Yes, film, carton, label, and corrugate consumption are all tracked using the same variance structure, reported separately by material type and SKU.
Can this connect to our sustainability reporting?
Material consumption data tracked here can support sustainability and material-reduction reporting, since reduced variance directly reduces total material consumed. Ask support how this ties into sustainability tracking.
Find the Variance, Then Fix the Right Thing
iFactory AI tracks packaging material consumption variance by SKU and production order, separating BOM drift from real waste. Book a demo on your own data.