Six Sigma for FMCG DMAIC Methodology for Defect Reduction
By Seren on June 2, 2026
A snack food line producing 12-gram chip bags is seeing 4.2% of packs weigh in at 11.3 grams or less enough underfill to trigger a retailer fine and enough giveaway on the overfilled bags to cost $180,000 annually in lost margin. A beverage plant running 600 cans per minute is logging seal-defect rates of 1,200 ppm, resulting in one spoiled shipment per month, a $90,000 write-off every quarter. These are FMCG defect problems and they share a common structure: the process is running inside specification limits on paper, but the distribution has shifted far enough that the tail is crossing the threshold thousands of times per shift. Six Sigma DMAIC is the methodology built to fix exactly this kind of problem. It does not guess. It measures, analyses, improves, and controls with data at every step. And when AI layers on top of the DMAIC framework, defect reduction moves from a project-based improvement event to a continuous, self-correcting production capability. This article walks through every phase with FMCG-specific application.
Six Sigma DMAIC · AI-Enhanced Quality Control · FMCG Defect Reduction
Cut FMCG Defect Rates by 40–70% Using DMAIC Powered by AI.
iFactory's AI platform integrates with your production lines, SCADA systems, and quality databases to accelerate every DMAIC phase — from real-time Define-phase data collection through Control-phase automated process adjustment.
Sigma level typical for FMCG packaging lines equivalent to 6,200 defects per million opportunities
15–30%
Revenue loss from quality-related waste in FMCG operations DMAIC directly addresses this cost
6:1
Average ROI ratio for Six Sigma projects in consumer goods every dollar invested returns six in defect reduction
50–70%
Defect reduction achieved by AI-enhanced DMAIC projects versus 25–40% for traditional DMAIC alone
Why DMAIC Is the Right Framework for FMCG Defect Reduction
FMCG manufacturing presents a specific class of quality problem. The processes are high-speed, the volumes are massive, the raw materials are variable (agricultural products, seasonally shifting inputs), and the tolerance windows are narrow. A chip line running at 120 bags per minute cannot stop to investigate every underweight pack. A beverage filler operating 600 cans per minute needs to know, in real time, whether the fill-head distribution has drifted and by how much. This is not a problem that inspection-based quality control can solve; by the time you inspect the defect, you have already produced thousands of units. DMAIC works for FMCG because it does not rely on inspection. It relies on understanding the process variables that cause the defect and controlling them at the source.
Traditional Quality Control vs DMAIC Approach in FMCG
Traditional QC
Approach
Inspect finished product. Remove defects after they occur. Acceptable Quality Level (AQL) sampling.
Data Usage
Pass/fail data from lab tests. No integration with process parameters. Historical, not predictive.
Reactive. Defect detected hours or days after production. Root cause investigation takes weeks.
DMAIC + AI
Approach
Measure and control process inputs. Prevent defects before they occur. Process capability (Cp/Cpk) driven.
Data Usage
Real-time process parameter streams fused with quality data. AI identifies multivariate root causes in minutes.
Cost Profile
Six:1 ROI typical. Reduction in giveaway, write-offs, inspection labour, and compliance risk.
Speed
Proactive. Drift detected in real time. Root cause identified in hours. Automated control response.
Define Phase — Scoping the Right Problem
The Define phase establishes what will be improved, by how much, and within what boundaries. In FMCG, the most common pitfall is scoping too broadly — "reduce all packaging defects" — when the data shows that 80% of losses come from one packaging lane on one production line. A well-scoped Define phase uses production data to identify the specific defect type, line, shift, and material lot where the problem concentrates. The output is a Project Charter with a clearly bounded problem statement, the defect metric (DPMO, defect rate, or yield), the target improvement, and the financial benefit projected.
01
Problem Statement
Define the specific defect, its current frequency, the financial impact, and the process boundary
02
SIPOC Map
Suppliers-Inputs-Process-Outputs-Customer mapping clarifies scope and identifies where data must be collected
03
CTQ Definition
Critical-to-Quality characteristics translate the customer requirement into measurable process parameters
04
Project Charter
Business case, problem and goal statements, team roles, milestone timeline, and financial projection
05
Baseline Sigma
Current process sigma level calculated from defect rate — provides the baseline against which improvement is measured
FMCG Example: Define Phase for a Fill-Weight Defect Project
Problem Statement
Line 3 (12-oz bag format) is producing 3.8% underweight packs and 7.2% overweight packs. Underweight triggers regulatory non-compliance and retailer penalties. Overweight represents 2.1% margin loss. Total annualized cost: $340,000.
Goal Statement
Reduce underweight rate from 3.8% to below 0.1% and overweight rate from 7.2% to below 2.0% within 8 months. Achieve Cpk of 1.33 or greater. Target savings: $280,000 annually.
Baseline Sigma
Current baseline: 3.2 Sigma with 1.5-sigma shift. DPMO = 38,000 (underweight) + 72,000 (overweight). Total DPMO = 110,000. Target: reduce to 3,400 DPMO (4.5 Sigma).
DMAIC Acceleration · AI Root Cause Analysis · Real-Time SPC
Accelerate Your DMAIC Project Timeline by 40% with AI-Powered Data Analysis.
iFactory's quality platform provides automated data collection, real-time SPC charting, and AI-driven root cause identification that compresses the traditional 6-month DMAIC cycle into 3-4 months for FMCG lines.
The Measure phase establishes the current state with statistical rigour. In FMCG, this means designing a data collection plan that captures both the output (defect rate, fill weight, seal strength) and the process inputs (temperature, pressure, line speed, raw material batch) at sufficient frequency to support the Analyse phase. Key deliverables include a Measurement System Analysis (MSA) to ensure the gauges are reliable, a baseline process capability study (Cp, Cpk, Pp, Ppk), and a data collection plan that maps every potential X variable to the Y output. AI enhances the Measure phase by automatically fusing data from PLCs, checkweighers, vision systems, and lab databases — creating a unified time-series dataset without manual data pulling.
Measure
Deliverable
FMCG Application
MSA
Gauge R&R study to confirm measurement system is capable (GRR < 30%)
Analyse is where DMAIC delivers its highest value. This phase identifies the critical X variables — the process inputs that exert statistically significant influence on the defect Y. FMCG processes typically have dozens of potential Xs: raw material viscosity, ambient temperature, line speed, fill-head pressure, conveyor tension, sealing jaw temperature, dwell time, and more. Traditional DMAIC uses hypothesis testing, regression, and designed experiments (DOE) to isolate the vital few from the trivial many. AI enhancement brings correlation analysis across hundreds of variables simultaneously, identifying interaction effects and non-linear relationships that classical statistics would miss. The output is a statistically validated list of critical Xs, their target ranges, and their contribution to the defect.
Tool 01
Fishbone / Ishikawa
Structured brainstorming
Cause-and-effect diagram organized into 6 Ms: Man, Machine, Material, Method, Measurement, Mother Nature (environment). For an FMCG seal-defect problem, branches would include jaw temperature, film tension, dwell time, seal bar wear, film batch, and ambient humidity.
FMCG use: Seal-defect analysis on form-fill-seal packaging machines
Tool 02
FMEA
Risk prioritisation
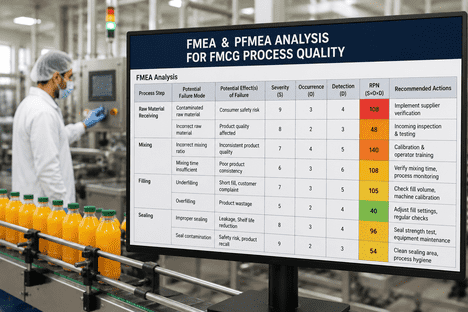
Failure Mode and Effects Analysis scores each potential failure mode by Severity, Occurrence, and Detection to calculate the Risk Priority Number (RPN). FMCG teams focus on modes with RPN > 100. AI augments FMEA by updating occurrence probabilities from real-time production data.
2-sample t-test, ANOVA, chi-square, and correlation analysis validate whether observed differences in defect rates between shifts, lines, or material lots are statistically significant. AI extends this with multivariate analysis that detects interaction effects between X variables.
FMCG use: Comparing defect rates across shifts, raw material suppliers, and line speeds
"
In high-volume food manufacturing, the difference between a 3-sigma and a 5-sigma process is not better inspection. It is identifying the three process variables that actually drive 90% of the defect variation and controlling them within their natural tolerance windows.
Improve Phase Designing and Implementing the Solution
The Improve phase takes the critical Xs identified in Analyse and defines the optimal operating ranges, then implements process changes to maintain those ranges. In FMCG, this frequently involves a combination of equipment adjustment (fill-head recalibration, sealing jaw temperature setpoint change), process parameter specification (raw material temperature range at the filler), and control system modification (PLC logic update to reject product when X variables drift outside tolerance). Designed Experiments (DOE) are commonly used in this phase to determine the optimal settings for multiple Xs simultaneously. AI improvement brings adaptive process optimization — where the system continuously learns from the relationship between X settings and Y outcomes and adjusts the target operating window as raw material or environmental conditions shift.
Improve Phase: FMCG Fill-Weight Case Study Before and After
Baseline (Before)
Underweight Rate3.8%
Overweight Rate7.2%
Cpk0.72
Annual Loss$340K
Improvement Actions
1. Fill-head recalibration
All 24 fill heads recalibrated to tolerance of ±0.3g. Worn seals replaced on 6 heads.
2. Temperature control
Product temperature range at filler specified at 18–22°C. Pre-heat system installed on supply line.
3. PLC logic update
Automated reject when pressure drifts >2% from setpoint. Real-time SPC rule implemented.
4. Operator training
All 3 shift teams trained on new setpoints, SPC chart interpretation, and escalation protocol.
Results (After)
Underweight Rate0.04%
Overweight Rate1.8%
Cpk1.41
Annual Savings$285K
Control Phase — Sustaining the Gains
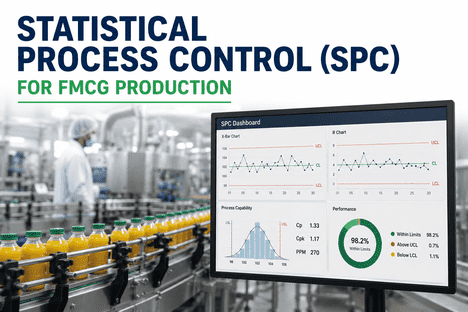
Control is the phase where DMAIC projects most commonly fail. The new process settings are implemented, defect rates drop, and the team moves on to the next project — then six months later the defect rate has drifted back toward baseline because the Control plan was not maintained. In FMCG, an effective Control phase includes Statistical Process Control (SPC) charts with clearly defined control limits and rules, a process documentation update, a training programme for operators and maintenance, a response plan for out-of-control conditions, and a periodic audit schedule. AI-enhanced control introduces automated SPC with real-time rule enforcement, automatic notification when a process is trending toward a control limit, and closed-loop process adjustment where the system can return parameters within defined safe boundaries without human intervention.
Control Element
Traditional Approach
AI-Enhanced Approach
SPC
Paper charts filled out by operators. Rules checked manually. Alarms triggered by visual inspection.
Real-time SPC with automated rule application (Western Electric rules). Alerts sent to mobile devices. Charts updated every production cycle.
Response Plan
Paper-based escalation matrix. Response times vary by shift. No automated containment.
Automated escalation with time-based rules. Auto-hold produced product when limits breached. Digital containment log.
Audit
Quarterly internal audit. Shelf-life and stability checks at fixed intervals.
Continuous automated audit. AI compares live data against control plan. Audit report generated on-demand.
Documentation
Revised SOPs in paper binders. Updated control plan in quality management system.
Digital SOPs accessed via tablet at line. Control plan embedded in iFactory Shift Logbook with electronic sign-off.
How iFactory AI Accelerates Each DMAIC Phase
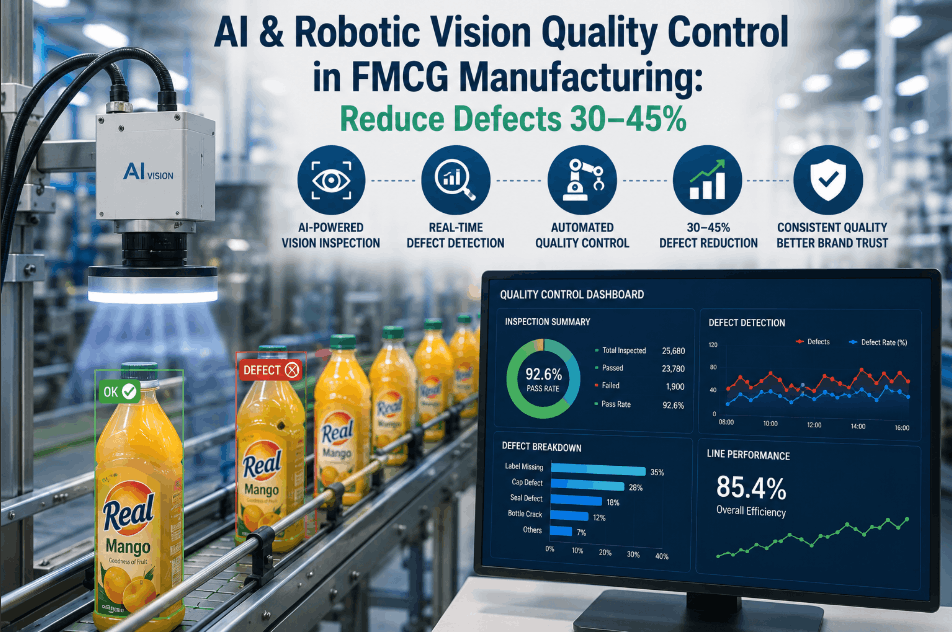
iFactory's platform is purpose-built to support Six Sigma DMAIC projects in FMCG manufacturing. The Shift Logbook module provides digital data capture for every production shift — replacing paper logs and ensuring that the Measure phase starts with clean, structured data rather than handwritten notes that take weeks to compile. The AI Vision Camera module detects visual defects — underfill, foreign material, seal defects, label misalignment — in real time at full line speed, feeding defect data directly into the Analyse phase without lab delays. The OEE Analytics module tracks overall equipment effectiveness across the six big losses, helping the Define phase identify which defect type is costing the most. And the Statistical Quality Control module provides real-time SPC charting with automated rule enforcement for the Control phase.
iFactory Product Modules Supporting DMAIC
Define
OEE Analytics — identifies the biggest loss category (availability, performance, or quality) to scope the right project. Production Monitoring — provides line-level data to bound the problem.
Measure
Shift Logbook — structured digital data collection per shift. Quality Control Management — centralised defect logging. PLC Sensor Integration — automated data from checkweighers, vision systems, temperature sensors.
Analyse
Statistical Quality Control — automated capability analysis and hypothesis testing. Automated Analytics Reporting — correlation and trend identification. AI Vision Camera — real-time defect classification and root cause patterns.
Improve
Work Order Management — track improvement implementation. Preventive Maintenance — schedule and verify equipment adjustments. Digital Twin AI — simulate process changes before implementation to predict impact on defect rates.
Control
SPC — real-time control charts with automated rule enforcement. Shift Logbook — digital sign-off on control plan compliance. Incident Reporting — capture and escalate any deviations from control limits with root cause analysis.
From 3.2 Sigma to 4.8 Sigma in One DMAIC Cycle — With iFactory AI.
iFactory gives FMCG quality teams the digital infrastructure to run DMAIC projects faster, with better data, and with sustained results. Accelerate your defect reduction programme. Book a Demo to see an AI-enhanced DMAIC dashboard on your production data, or Talk to an Expert to discuss a Six Sigma deployment roadmap.
A traditional DMAIC project in FMCG typically runs 4-8 months depending on scope, data availability, and team experience. The Define and Measure phases take 4-6 weeks, Analyse takes 4-8 weeks, Improve takes 6-12 weeks (including solution implementation and validation), and Control is ongoing. With AI-enhanced data collection and analysis using iFactory's platform, the timeline can be compressed by approximately 40% — particularly in the Measure and Analyse phases where automated data fusion and multivariate analysis replace manual data pulling and hypothesis testing. Book a Demo to see how the platform accelerates each phase.
For the Measure phase, a minimum of 25-30 data points per subgroup (e.g., per shift, per production run) is recommended for meaningful capability analysis. For the Analyse phase, the data set should span at least 3-4 weeks of production to capture normal process variation across shifts, raw material lots, and environmental conditions. iFactory's platform can ingest partial data and begin generating insights immediately — the models improve as data accumulates, but the DMAIC team does not need to wait months to start. A partial-data DMAIC project with 2 weeks of high-quality data is more useful than a full-data project that takes 6 months to launch. Talk to an Expert to assess your current data readiness.
Yes — DMAIC applies to any process with a measurable output and controllable inputs. For mixing processes, the Y might be blend uniformity or viscosity, with Xs including ingredient temperature, mixing speed, mixing time, and order of addition. For frying, the Y might be moisture content or oil absorption, with Xs including oil temperature, belt speed, product thickness, and oil age. The same five-phase structure applies; only the specific measurement systems and control variables differ. iFactory's PLC Integration and Statistical Quality Control modules adapt to any process with sensor data. Book a Demo to see how the platform can be configured for your specific FMCG process.
iFactory integrates with existing PLCs, SCADA systems, checkweighers, vision inspection systems, and lab information management systems (LIMS) through standard industrial protocols (OPC-UA, Modbus, MQTT) and REST APIs. Data from existing quality databases can be imported via CSV or direct database connection. The platform does not replace your existing systems — it aggregates data from them into a unified DMAIC workspace. Integration typically takes 2-4 weeks per line and can run in parallel with existing quality workflows. Talk to an Expert to review your current system architecture and plan the integration scope.
Run DMAIC Projects 40% Faster with AI-Powered Data Collection, Analysis, and Control.
iFactory gives FMCG teams the digital infrastructure to execute Six Sigma DMAIC at scale — real-time SPC, automated root cause analysis, and sustained control across every production line. Book a Demo to see an AI-enhanced DMAIC dashboard on your line data, or Talk to an Expert for a Six Sigma deployment roadmap.