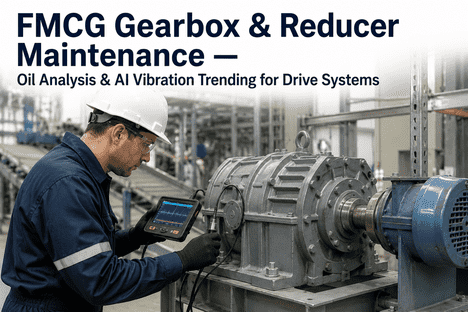
FMCG Gearbox & Reducer Maintenance Oil Analysis & AI Vibration Trending for Drive Systems
By Seren on June 27, 2026
A beverage bottling plant in the Southeast operated 14 critical gearboxes across its primary filling line a 34-station rotary filler, a six-head capper, a label applicator, and a case packer. Each gearbox ran 18 hours per day, six days per week, year-round. The maintenance manager followed the OEM-recommended oil change schedule: change the ISO 220 gear oil every 2,000 operating hours and inspect the gear teeth during annual plant shutdowns. In early 2024, the filler drive gearbox a 75 HP helical-bevel unit driving the main filler turret developed an audible whine during the Wednesday morning startup. The vibration reading on the output bearing housing was 7.2 mm/s RMS, trending from a baseline of 2.1 mm/s. The maintenance team ordered a replacement gearbox at $18,400 with a 14-week lead time and scheduled a changeover during the July plant shutdown. When the gearbox was opened in the repair shop, the root cause was immediately visible: severe tooth pitting across three teeth on the intermediate gear, with spalling that had already propagated into the tooth root. The oil analysis report from the quarterly sample drawn 12 days before the whine was first audible had shown an iron particle count of 1,280 ppm and a ferrous density index of 3.8, both well above the alarm thresholds of 400 ppm and 1.5 FDI. The report had been generated, filed, and not reviewed because the maintenance manager had not configured the alarm notifications in the oil analysis laboratory's reporting portal. The gearbox was operating with a known, measurable, and escalating contamination signature for 12 days while the damage progressed from pitting to spalling — tripling the repair cost from an estimated $4,200 for bearing and gear replacement to $15,800 for complete gear train replacement. That three-to-one cost escalation was not a mechanical failure. It was an information failure. And it is the reason that iFactory integrates oil analysis data and vibration trending into a single AI-driven gearbox health platform that alerts the maintenance manager when laboratory data indicates developing damage before the gearbox tells you in a language you cannot ignore.
An Oil Analysis Report Sat Unread for 12 Days While a Gearbox Destroyed Itself. iFactory Integrates Oil Data and Vibration Trending Into a Single AI Health Platform That Alerts You Before Damage Escalates.
AI-driven gearbox health monitoring for FMCG drive systems — combining oil analysis particle counting and wear debris analysis with continuous vibration trending to detect tooth pitting, bearing wear, and gear train degradation at the first measurable indicator, not the first audible symptom.
Cost multiplier when gearbox faults progress from early-stage bearing and gear replacement to complete gear train replacement — every dollar of detected early damage avoids three dollars of escalated repair cost
60-75%
Of gearbox failures in FMCG drive systems are preceded by measurable oil contamination or vibration trend changes that go undetected because oil analysis data and vibration data are managed in separate systems with separate alarm thresholds
400 ppm
Alert threshold for iron particle count in gearbox oil analysis — a reading above this level indicates active gear tooth wear that should trigger immediate investigation before pitting progresses to spalling
14-18
Critical gearboxes on a typical FMCG primary packaging line — filler drives, capper drives, labeler drives, case packer drives, and conveyor transfer drives — each requiring integrated oil and vibration monitoring for comprehensive health assessment
Why Gearbox Degradation in FMCG Drive Systems Follows a Predictable but Undetected Progression — and Why Oil Analysis and Vibration Monitoring Must Be Integrated to Catch It at the Reversible Stage
Every maintenance manager in FMCG manufacturing knows that gearboxes fail. What is less widely understood is that the failure sequence — from initial surface fatigue to tooth fracture, bearing seizure, or gear train jamming — follows a progression that is detectable at each stage by a specific measurement method, but the measurement methods are almost never integrated into a single health assessment. Oil analysis laboratories report particle counts and wear debris indices. Vibration data collectors record acceleration and velocity spectra at quarterly or monthly intervals. The two data streams exist in separate systems, reported by separate service providers, reviewed by separate personnel — and the gearbox fails while the oil report sits in one inbox and the vibration route data sits in another.
Gearbox wear in FMCG drive systems follows a well-documented sequence. In Stage 1, normal running-in wear produces fine metallic particles in the oil at low concentrations — iron particle counts of 50 to 200 ppm and ferrous density index below 1.0. As surface fatigue initiates on gear tooth flanks, the particle generation rate increases, and the particle morphology shifts from fine wear particles to larger fatigue platelets. In Stage 2, micro-pitting begins on the tooth surfaces — visible only under magnification — producing iron particle counts of 200 to 600 ppm and an FDI of 1.0 to 2.5. The vibration spectrum at Stage 2 shows no significant change at the gear mesh frequency because the surface damage has not yet altered the tooth geometry enough to modulate the vibration signal. By Stage 3, the micro-pitting has progressed to macro-pitting and early spalling, tooth geometry has changed measurably, and the vibration spectrum shows sidebands around the gear mesh frequency at the rotational speed of the damaged gear. The iron particle count exceeds 600 ppm and the FDI exceeds 2.5. By Stage 4 — tooth fracture, bearing seizure, or gear train jamming — both the oil analysis and vibration data would have been in the alarm range for weeks or months. The failure was predicted by the data. The damage became irreversible at the transition from Stage 2 to Stage 3 — and that transition was detectable only by integrating the oil contamination trend with the vibration trend, because each data stream on its own was insufficient to confirm the diagnosis with the confidence required for a maintenance manager to order an intervention during a production window.
01
Oil Contamination and Wear Particle Generation
Oil analysis is the earliest indicator of gearbox wear — particle counts rise before vibration spectra change because the wear particles are generated before the surface damage alters the tooth geometry enough to modulate the vibration signal. A standard quarterly oil sample analysed for ferrous density, particle count, viscosity, and water content can detect the onset of gear tooth wear at Stage 1-2, when the iron particle count crosses 200 ppm. But the alert depends on the laboratory reporting the result and the maintenance manager reviewing it in the context of the gearbox's operating history. When oil analysis data is managed as a standalone programme — samples sent to a laboratory, reports returned by email, filed in a folder — the detection-to-intervention lag can exceed the window between Stage 2 and Stage 3 by a factor of two or more.
02
Tooth Surface Fatigue — Micro-Pitting to Macro-Pitting Progression
Micro-pitting initiates on gear tooth flanks when the lubricant film thickness falls below the composite surface roughness of the contacting tooth surfaces — a condition that occurs during startup, under shock loading, or when oil viscosity degrades from thermal or contamination-related breakdown. Micro-pitting is not detectable by vibration analysis at standard measurement resolutions because the surface damage at the microscopic level does not alter the tooth flank profile enough to produce measurable vibration at the gear mesh frequency. The only early indicator is the increase in iron particle count in the oil — particles that are sheared from the tooth surface at the microscopic level and suspended in the lubricant. As micro-pitting progresses to macro-pitting, the tooth geometry begins to change, and vibration sidebands appear around the gear mesh frequency at the rotational speed of the affected gear — typically at an iron particle count of 400 to 600 ppm.
03
Bearing Wear and Raceway Degradation
Gearbox bearing wear in FMCG drive systems typically begins as sub-surface fatigue spalling on the bearing raceway, initiated by the cyclic loading from gear mesh forces transmitted through the shaft. Bearing wear debris — chromium, nickel, and molybdenum particles from bearing steel — appears in the oil analysis as a distinct elemental signature that can be separated from gear tooth wear debris (primarily iron with trace manganese and silicon) through elemental spectroscopy. When the bearing wear debris ratio exceeds the gear wear debris ratio in the oil sample, the primary failure mode is bearing degradation rather than gear tooth damage — a distinction that determines whether the corrective action is bearing replacement or gear train overhaul. Vibration detection of bearing faults requires acceleration enveloping or shock pulse measurement at the bearing housing — not standard RMS velocity — which most periodic vibration routes do not perform at the required resolution.
04
Oil Degradation — Viscosity Breakdown, Oxidation, and Contamination
Oil degradation is both a consequence and a cause of gearbox wear. Gear mesh action generates heat that accelerates oil oxidation, increasing viscosity and reducing the oil's ability to maintain an elastohydrodynamic lubricant film between tooth surfaces. As the film thickness decreases, the contact regime shifts from full-film EHL to mixed or boundary lubrication — the condition under which micro-pitting initiates. Water ingress through gearbox breathers and shaft seals accelerates oil degradation by promoting oxidation and reducing the oil's load-carrying capacity. A water content above 500 ppm in gearbox oil reduces bearing fatigue life by approximately 50%. iFactory's integrated oil analysis module tracks viscosity, total acid number, water content, and particle count from each sample and correlates the lubricant condition trend with the vibration trend — identifying the specific gearboxes where oil degradation is driving accelerated wear before the wear produces measurable vibration or oil contamination alerts.
The Integration Gap:Oil analysis detects wear at Stage 1-2, before vibration detects anything. Vibration detects damage at Stage 3, when oil analysis confirms the diagnosis. Neither data stream alone provides the confidence required for a maintenance manager to intervene during production. Combined, they provide the cross-validated diagnosis that justifies a scheduled gearbox intervention at the reversible damage stage — when repair cost is one-third of the cost at the irreversible stage.
The True Cost of Disconnected Condition Data — Why Standalone Oil Analysis and Vibration Programmes Miss the Critical Intervention Window
A quarterly oil analysis programme that detects iron particle counts of 800 ppm at a gearbox on the primary packaging line creates a maintenance decision that cannot be made on the oil data alone. The maintenance manager knows the gearbox is wearing. What the oil data cannot tell the manager is how much damage has already occurred — whether the tooth surface is in the micro-pitting stage where gear and bearing replacement is feasible, or the macro-pitting stage where the gear train requires complete replacement. Without the vibration data to confirm the stage of damage, the manager's options are limited: schedule an internal inspection during the next planned shutdown, accept the risk of running to failure, or escalate the decision to production management for a capital replacement. The inspection, if it happens, reveals the true stage of damage — but the inspection window may be weeks or months after the oil analysis report indicated the problem. The damage continues to progress during the waiting period.
Standalone Oil Analysis or Vibration Programme
Oil analysis and vibration in separate systemsno cross-correlation
Detection-to-intervention lag5-14 days minimum
Damage stage at interventionStage 3-4 typically
Average gearbox repair cost$12,000 - $18,000
Confidence to intervene during productionlow
iFactory Integrated Oil + Vibration Platform
Oil and vibration data unified in single dashboardcross-correlated analysis
Detection-to-alert lagminutes from data ingestion
Damage stage at interventionStage 1-2 achievable
Average gearbox repair cost$4,000 - $6,000
Confidence to intervene during productionhigh
Platform cost: 2-5% of the annual gearbox repair budget it optimises
How iFactory's Integrated Gearbox Health Platform Delivers Oil and Vibration Intelligence in a Single View
iFactory connects to your existing oil analysis laboratory data feed, vibration data collection routes, and CMMS work order history to create a unified gearbox health dashboard that correlates oil contamination trends with vibration spectra trends — generating integrated alerts that cross-validate the diagnosis before recommending intervention. The platform does not replace your laboratory contract or your vibration data collection programme. It connects the two data streams that have never been connected and extracts the diagnostic value that each data stream alone cannot provide.
Capability 01
Automated Oil Analysis Integration — Laboratory Data Ingestion, Trend Analysis, and Cross-Referenced Alerting
Oil Intelligence
iFactory ingests oil analysis data from major commercial laboratories (Bureau Veritas, Polaris, TestOil, WearCheck, Analysts Inc.) through API or CSV import, mapping each sample to the specific gearbox and oil sump from which it was drawn. The platform maintains per-gearbox trend charts for iron particle count, ferrous density index, viscosity at 40°C, total acid number, water content, and elemental wear metals (chromium, nickel, molybdenum, copper, tin, lead, aluminium, silicon). When a sample result crosses the gearbox-specific alarm threshold set during platform configuration — or when the rate of change between consecutive samples exceeds a configurable slope threshold — the platform generates an oil analysis alert. The alert is cross-referenced against the gearbox's current vibration trend before being presented to the maintenance manager, with the oil data and vibration data displayed together in a single diagnostic view that shows whether the two data streams confirm or contradict each other. A rising iron particle count with no corresponding vibration increase indicates early-stage wear that may still be reversible with oil filtration and bearing replacement. A rising iron count with concurrent vibration sidebands at the gear mesh frequency confirms that tooth surface damage has progressed to the macro-pitting stage requiring gear train intervention.
Multi-laboratory data ingestion
Per-gearbox trend charts with alarm thresholds
Cross-referenced oil + vibration alerts
Capability 02
Continuous Vibration Trending with Gear Mesh Frequency Analysis and Bearing Condition Index
Vibration Intelligence
iFactory ingests vibration data from both periodic route collection and continuous online sensors — acceleration, velocity, and acceleration enveloping data at gearbox input and output bearing locations. For each gearbox, the platform maintains a baseline vibration spectrum at the gear mesh frequency and its harmonics, tracking changes in amplitude and the emergence of sideband frequencies that indicate gear tooth damage. The gear mesh frequency is calculated from the gearbox's ratio and input speed, and the sideband spacing is calculated at the rotational speed of each gear stage — allowing the platform to identify which specific gear in a multi-stage gearbox is developing damage. For bearing condition, the platform calculates an acceleration enveloping-based bearing condition index at the outer race, inner race, and ball-pass frequencies of each bearing in the gearbox, trending the index value and alerting when it crosses the established threshold. Each vibration alert is automatically cross-referenced against the gearbox's latest oil analysis data — an alert with confirmed oil contamination is escalated, while an alert without oil confirmation is flagged for investigation but not escalated to the intervention recommendation tier.
Gear mesh frequency sideband analysis
Multi-stage gear fault identification
Acceleration enveloping bearing condition index
Capability 03
Integrated Fault Diagnosis — Cross-Validated Oil and Vibration Combining Rules That Generate Intervention Recommendations
Diagnostic Intelligence
The core diagnostic capability of the iFactory platform is not the individual oil analysis or vibration trend — it is the combining rule that integrates the two data streams into a single fault diagnosis with an associated confidence level. The combining rule evaluates five parameters: iron particle count and FDI trend direction (accelerating, stable, or declining), gear mesh frequency sideband amplitude and sideband count, bearing condition index value and trend, oil viscosity and TAN trend (indicating oil degradation that may be driving wear), and the time elapsed since the last oil change (indicating oil age as a contributing factor). When the iron particle count is above 400 ppm and accelerating, the gear mesh sideband amplitude exceeds 2x the baseline, and the FDI exceeds 2.0 — the platform diagnoses Stage 2-3 gear tooth wear with high confidence and generates a specific intervention recommendation: schedule gearbox inspection at the next available shutdown for gear and bearing replacement within 500 operating hours. When the iron count is elevated but vibration is stable, the diagnosis is early-stage wear with the recommendation to increase oil sampling frequency to monthly and install an offline oil filtration loop to extend component life until the next planned changeover.
5-parameter cross-validation algorithm
Stage-specific intervention recommendations
Confidence-scored fault diagnosis
Capability 04
Maintenance Planning and Intervention Scheduling — Shutdown Window Optimisation Based on Damage Progression Rate
Planning Intelligence
iFactory connects to the plant's CMMS to import the scheduled downtime calendar — planned changeovers, annual shutdowns, and seasonal maintenance windows. For each gearbox with a confirmed diagnosis above the intervention threshold, the platform calculates the damage progression rate from the oil and vibration trend slopes and projects the date at which the damage will reach the next stage if left unaddressed. A gearbox with an iron particle count of 600 ppm increasing at 80 ppm per month and a gear mesh sideband amplitude at 3x baseline increasing at 0.3x per month is projected to reach the Stage 3-4 threshold (1,000 ppm, 5x sideband amplitude, visible spalling) in approximately five months. The platform identifies the nearest scheduled maintenance window before the projected threshold date and presents the intervention as a scheduled recommendation — with the specific parts required (gears, bearings, seals, gaskets, oil), the estimated labour hours, and the projected repair cost at the current damage stage versus the projected cost if deferred past the next maintenance window. This converts the gearbox condition data from a diagnostic report into a scheduled, costed, and prioritised maintenance action that the maintenance manager can present to production management with a defined intervention window and a quantified cost consequence of deferral.
Damage progression rate calculation
Shutdown window optimisation
Cost escalation projection by delay period
Your Oil Analysis Laboratory Reports Particle Counts. Your Vibration Route Records Spectra. iFactory Is the Only Platform That Connects Them Into a Single Diagnosis Before the Gearbox Fails.
Automated oil analysis integration, continuous vibration trending with gear mesh frequency analysis, cross-validated fault diagnosis, and shutdown-window-optimised intervention scheduling — connecting the data streams that have always been disconnected, without replacing your existing laboratory contract or vibration data collection programme.
How iFactory Adapts to Different Gearbox Types and Drive Configurations
An FMCG plant's gearbox fleet spans multiple configurations — helical bevel, parallel shaft, planetary, worm gear, and shaft-mounted reducers — each with different failure modes, oil volume requirements, and vibration measurement points. A helical bevel gearbox on a filler drive operating at 1,200 RPM input speed has a different vibration spectrum and oil degradation profile than a planetary gearbox on a conveyor drive operating at 50 RPM output speed. iFactory's platform is configured per gearbox type with type-specific alarm thresholds, measurement point definitions, gear mesh frequency calculations, and bearing fault frequency databases.
Gearbox Type — Failure Profile and iFactory Configuration
Gearbox Type
Primary Failure Modes
iFactory AI Configuration
Helical Bevel Gearbox — Filler & Capper Drives
Bevel gear tooth pitting from cyclic shock loading during filler indexing; bearing wear from overhung load on output shaft; oil overheating from high-speed input operation; seal failure from shaft deflection under load
Bevel gear mesh frequency analysis with 2x and 3rd harmonic tracking; output bearing acceleration enveloping with overhung load compensation; oil temperature trending with ambient temperature normalisation; seal condition index from oil consumption rate monitoring
Parallel Shaft Gearbox — Conveyor & Transfer Drives
Helical gear tooth wear from continuous low-speed high-torque operation; bearing fatigue from radial loading; oil contamination from washdown water ingress through breathers; gear tooth fracture from foreign material ingestion
Low-speed gear mesh detection with extended FFT acquisition time for 0.5 Hz resolution; water content monitoring with 200 ppm threshold for accelerated inspection; breather condition tracking from oil analysis silica and sodium trends; foreign material detection from particle morphology analysis
Planetary Gearbox — Mixer & Agitator Drives
Planet gear bearing failure from load sharing imbalance; sun gear tooth pitting from elevated temperature operation; ring gear wear from contamination accumulation in low-point sump; planet carrier bearing fatigue from cyclic loading
Planet gear pass frequency analysis for load sharing detection; sun gear mesh modulation analysis for tooth damage identification; sump bottom sample programme with silica and wear debris trending; oil change interval optimisation based on TAN and viscosity degradation rate
Worm gear tooth wear from boundary lubrication during start-stop cycling; bronze gear scoring from contamination in oil; bearing wear from worm shaft thrust loading; oil overheating from sliding friction at worm gear mesh
Worm gear wear particle copper and tin trending from elemental spectroscopy; oil temperature monitoring with start-up cycle compensation; thrust bearing condition index from axial vibration measurement; oil change interval based on copper concentration rate of change
We had 86 gearboxes across three production lines and we were managing oil analysis through a spreadsheet that the reliability technician updated when the lab reports came in. The vibration programme was run by a separate contractor who uploaded spectra to their own portal. Neither system talked to the other. In 2023, we had four gearbox failures on the primary packaging line that cost an average of $14,200 each in repair and lost production. After deploying iFactory, the platform caught a developing tooth pitting fault on the capper drive gearbox at Stage 2 — iron particle count of 520 ppm with a rising trend, confirmed by emerging sidebands at the gear mesh frequency. The recommended intervention was bearing and gear replacement during the next scheduled changeover at a cost of $4,800. The gearbox ran for another 14 months without incident after the repair. The platform identified the fault 11 weeks before the quarterly oil sample result would have come back from the lab — and the vibration route was not scheduled for another five weeks. We have not had a single unplanned gearbox failure since deployment. The return on investment was seven months.
— Maintenance Manager, Mid-Atlantic Beverage Bottling Plant — 86 Gearboxes, 3 Production Lines, 24/6 Production Schedule
Conclusion
The three-to-one cost ratio between Stage 4 gearbox failure repair and Stage 2 intervention is not a theoretical projection from a gearbox manufacturer's maintenance guide. It is the mathematical consequence of gear train degradation kinetics that every maintenance manager confronts when the quarterly oil analysis report shows an iron particle count of 1,200 ppm and the vibration route confirms sidebands at 6x the gear mesh frequency baseline — and the gearbox that could have been repaired for $4,800 at Stage 2 now requires $15,800 in gear train replacement, with a 14-week lead time on the replacement gearbox and a 10-hour production line shutdown for the changeover.
Integrated oil and vibration intelligence changes the fundamental economics of gearbox maintenance in FMCG production. When every gearbox in the plant has a unified oil and vibration dashboard, a cross-validated fault diagnosis updated with every new data point, and a progression-rate-based intervention schedule that projects the cost of deferral — the maintenance manager's role shifts from investigating failures that have already occurred to managing a portfolio of known wear trajectories with predictable intervention points and optimised maintenance expenditure. The oil analysis data and the vibration data that the plant already pays for separately become a single decision support system that generates more value together than the sum of their individual contributions.
iFactory's integrated gearbox health platform gives FMCG maintenance managers the automated oil analysis integration, continuous vibration trending, cross-validated fault diagnosis, and shutdown-window-optimised intervention scheduling that transform disconnected condition data into a unified, cost-effective gearbox reliability programme. Book a Demo to see how iFactory connects to your existing oil analysis laboratory and vibration data collection programme, or talk to an expert about your current gearbox maintenance challenges and the fastest path to integrated oil and vibration intelligence.
Frequently Asked Questions
No. iFactory is designed to connect to and enhance your existing oil analysis laboratory programme and vibration data collection programme rather than replacing them. The platform ingests oil analysis data from your current laboratory through API, CSV upload, or email-to-platform integration — supporting all major commercial laboratories including Bureau Veritas, Polaris, TestOil, WearCheck, and Analysts Inc. For vibration data, iFactory integrates with your existing data collection platform or accepts CSV and UFF file formats from any vibration analyser. What iFactory adds is the integration layer that correlates the two data streams — presenting oil analysis trends and vibration spectra in a single gearbox dashboard and applying the cross-validation rules that generate integrated fault diagnoses. Your oil analysis contract and vibration programme continue unchanged. iFactory simply connects the data that has always been disconnected and extracts the diagnostic value that the connection creates. Book a Demo to see how iFactory integrates with your specific laboratory and vibration data sources.
iFactory tracks the full standard oil analysis parameter set for industrial gearbox lubricants: iron particle count (ppm), ferrous density index (FDI), viscosity at 40°C and 100°C, total acid number (TAN), water content (ppm), elemental wear metals (chromium, nickel, molybdenum, copper, tin, lead, aluminium, silicon, manganese, vanadium), particle count per ISO 4406 cleanliness code, and oxidation/nitration values from FTIR spectroscopy where available. Alarm thresholds are configured during platform setup on a per-gearbox basis, taking into account the gearbox type, oil volume, make-up oil consumption rate, and hours since last oil change. Generic starting thresholds are provided based on industry standards — iron particle count alarm at 400 ppm, high alarm at 800 ppm; FDI alarm at 1.5, high alarm at 3.0; viscosity deviation alarm at ±10% from grade specification; water content alarm at 200 ppm — but these are adjusted during the baseline collection period based on the gearbox's specific historical data. Talk to an expert about configuring the oil analysis parameter thresholds for your gearbox fleet.
Each gearbox in the platform is configured as an independent asset with its own oil analysis parameters, oil grade specification, sump volume, sampling frequency, and alarm thresholds. A 75 HP helical bevel gearbox with a 12-litre sump using ISO 220 mineral oil on a quarterly sampling schedule is configured independently from a 200 HP planetary gearbox with a 40-litre sump using ISO 320 synthetic oil on a monthly sampling schedule. The platform automatically adjusts the interpretation of particle count data based on sump volume — a 400 ppm iron reading in a 12-litre sump represents 4.8 grams of total wear metal, while the same 400 ppm reading in a 40-litre sump represents 16 grams of total wear metal, and the platform applies a sump-volume-adjusted wear rate calculation that normalises the particle concentration data to grams per operating hour for consistent comparison across gearboxes of different sizes. Sampling frequency is tracked per gearbox, and the platform alerts the maintenance manager when a scheduled sample is overdue by more than 14 days — a common cause of missed detection windows in standalone oil analysis programmes. Talk to an expert about multi-gearbox configuration for your specific production line.
A typical deployment for 50 to 100 gearboxes follows a phased approach. Phase 1 (weeks 1-2) involves the gearbox asset survey — compiling the gearbox inventory with nameplate data, oil grade and volume, and vibration measurement point locations. Phase 2 (weeks 2-3) covers data connection setup — configuring the oil analysis laboratory data feed and vibration data import channel. Phase 3 (weeks 3-5) is the baseline collection period during which the platform ingests available historical oil analysis and vibration data and establishes per-gearbox baseline trends and alarm thresholds. Phase 4 (week 5 onward) is the active monitoring phase where the platform begins generating integrated oil and vibration alerts. The platform requires at minimum the gearbox asset list with nameplate data to begin configuration, and can start generating value from the first data upload — even if only oil analysis or vibration data is available initially, with the second data stream added when connected. For plants with no existing oil analysis or vibration programme, iFactory can help establish baseline sampling and measurement protocols. Talk to an expert about a deployment timeline specific to your plant's gearbox fleet and existing data availability.
Your Oil Analysis Lab Reports Particle Counts. Your Vibration Route Records Spectra. iFactory Is the Only Platform That Unites Them Into One Diagnosis — Before Your Gearbox Tells You in a Language You Cannot Ignore.
Automated oil analysis integration, continuous vibration trending with gear mesh frequency analysis, cross-validated fault diagnosis, and shutdown-window-optimised intervention scheduling — connecting the data streams that have always been disconnected, deployed on your existing infrastructure without replacing your laboratory contract or vibration programme.