Household Products Manufacturing analytics: Detergents, Cleaners, and Aerosols
By Seren on June 18, 2026
A liquid detergent production line running at 200 bottles per minute has less than 0.3 seconds to deposit exactly 1.5 litres of surfactant blend into each container before the conveyor moves the next bottle into position. If the temperature of the mix has drifted by two degrees Celsius since the start of the shift, the viscosity shifts, the fill volume changes by eight millilitres, and by the end of the eight-hour run the facility has given away 3,840 litres of product or, worse, under-filled 2,000 bottles that must be pulled from the distribution chain. Across the same facility, an aerosol filling station is pressurising cans with a hydrocarbon propellant blend in an ATEX Zone 1 area, where a single static discharge could ignite the atmosphere. The pressure sensor on the gassing head reports within tolerance, but a micro-corrosion pit in the valve crimp collet is allowing a 0.02 mm gap that will produce leakers detectable only after the hot water bath test 45 minutes later. In the next bay, a high-shear mixer processing a batch of concentrated floor cleaner is drawing 12 % more current than the recipe standard, which the experienced operator recognises as the early sign of a failing mechanical seal but that operator is on leave, and the relief crew has no baseline to compare against. These three scenarios are not hypothetical. They occur daily across household product manufacturing facilities, and they share a common root cause: the gap between the data the equipment generates and the insight the operations team receives in time to act. iFactory's analytics platform closes that gap by connecting every stage of the production process from raw material dosing to aerosol propellant gassing into a single intelligence layer that predicts quality deviations, optimises OEE, and generates compliance records automatically.
Turn Every Batch Into a Data Point and Every Line Into a Predictable Profit Centre.
iFactory's household products manufacturing analytics platform connects formulation, filling, aerosol gassing, and compliance into a single intelligence layer — with real-time OEE, AI-driven defect forecasting, and audit-ready batch records.
Documented OEE gain across detergent, cleaner, and aerosol lines after deploying real-time production analytics with automated changeover tracking and predictive quality monitoring
40-60%
Defect Reduction
Reduction in fill-weight deviations, leakers, and label defects when AI vision and predictive process models flag anomalies before the line produces non-conforming units
3-5x
Audit Efficiency
Faster compliance reporting for EPA VOC documentation, DOT aerosol transport records, and FIFRA disinfectant registration audits with auto-generated batch traceability
The Three Critical Zones of Household Product Manufacturing — and Where Analytics Delivers the Highest Return
Household product manufacturing spans three distinct process zones, each with its own failure modes, regulatory demands, and analytics requirements. The formulation zone where surfactants, solvents, and actives are blended into stable emulsions. The filling and packaging zone where liquid detergents, cleaners, and aerosol products are metred into containers at high speed. And the compliance zone where every batch must satisfy EPA VOC limits, DOT transport classifications, FIFRA registration requirements, and GHS labelling standards. An analytics platform that treats these zones as isolated silos misses the cross-process correlations that drive the biggest losses — a viscosity drift in the mixing tank that causes a fill-weight shift on the line three hours later, or a propellant pressure trend that predicts valve crimp failures before the leak test confirms them.
Zone 01
Formulation & Batching Analytics
Raw material dosing accuracy, mix viscosity and temperature control, homogenisation pressure, and hold-time compliance determine whether a batch meets specification on the first attempt. Analytics in this zone correlates in-process parameters — surfactant feed rate, water temperature, mixer amperage, emulsion particle size — with final batch quality to build predictive models that flag off-spec conditions before the batch completes. Real-time yield tracking against the recipe target identifies material loss points: over-dosing that drives cost, under-dosing that produces rework, and cleaning losses between colour or fragrance changeovers. iFactory's Shift Logbook captures every parameter adjustment, operator decision, and deviation note with an immutable audit trail that links directly to the batch record.
Real-time batch yield tracking
Predictive quality correlation
Zone 02
Filling & Aerosol Line Analytics
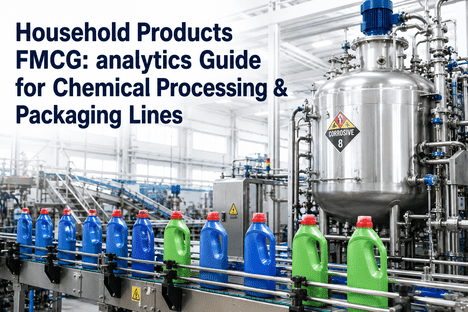
High-speed filling lines for liquid detergents, cleaners, and aerosol products face a set of interconnected quality challenges: fill-weight accuracy subject to temperature and viscosity drift, cap placement and torque consistency, label registration and adhesive bonding, and leaker detection for pressurised containers. Analytics on the filling line monitors every head individually — tracking fill volume trend, standard deviation, and drift rate per nozzle — and generates a predictive alert when any head's pattern shifts toward the control limit. For aerosol operations, the platform integrates with propellant gassing station data to track pressure, mass flow, and valve crimp force per can, correlating these parameters with hot water bath and burst test results to build a predictive leak model that catches defects at the gassing head rather than at the bath.
Per-head fill-weight analytics
Predictive aerosol leak model
Zone 03
Safety & Compliance Analytics
Household product manufacturing is one of the most regulated sectors in consumer goods. EPA VOC content documentation, FIFRA disinfectant efficacy records, DOT hazardous material transport classification, GHS label and SDS compliance, and OSHA process safety management for flammable propellants — each carries its own data collection, retention, and reporting requirements. Compliance analytics automates the data chain from raw material certificate of analysis through batch production records to finished good shipment documentation. Every batch record is assembled automatically from the process data, lab results, and operator entries already captured in the platform. When an auditor requests VOC documentation for a specific production date and product SKU, the response is a single export — not a three-day manual data assembly across paper logs, spreadsheets, and LIMS exports.
Auto-generated batch records
EPA/DOT/FIFRA audit exports
How Analytics Transforms Household Product Manufacturing — A Three-Layer Architecture
The iFactory analytics platform for household product manufacturing operates across three interconnected layers. The data ingestion layer captures every relevant signal from the production environment. The analytics layer transforms those signals into predictive and prescriptive insights. The action layer delivers those insights to the people who need them — operators, shift managers, plant directors, and compliance officers — in the format and cadence each role requires.
Layer 01
Unified Data Ingestion
The platform connects to every data source in the facility — PLCs on mixing vessels and filling lines, flow meters and Coriolis sensors on raw material dosing skids, SCADA systems on aerosol gassing stations, checkweighers and vision inspection cameras on packaging lines, LIMS for quality test results, and manual operator entries through the Shift Logbook interface. Data is normalised, time-stamped, and tagged with product SKU, batch number, line ID, and shift identifier as it arrives. This unified data layer eliminates the fragmentation that forces most facilities to assemble batch records from four or five disconnected systems.
The analytics engine applies machine learning models trained on the facility's historical pairing of process data with quality and efficiency outcomes. A model trained on twelve months of mixing data predicts batch viscosity deviation from raw material attributes and process parameters before the homogenisation step completes. A separate model trained on fill-weight and checkweigher data forecasts which filling head will drift out of tolerance and how many shifts remain before maintenance is required. For aerosol lines, the engine correlates propellant pressure, valve crimp force, and can temperature with hot water bath and burst test results to predict leaker probability per can at the gassing station. All models improve continuously as new production data and quality results are fed back into the training set.
Predictions and alerts are delivered through interfaces tailored to each role. The line operator sees a real-time dashboard on the HMI showing fill-weight trend per head, batch yield against target, and the next scheduled changeover with the recipe parameters pre-loaded. The shift manager receives mobile alerts when any line's defect probability crosses the configured threshold, with the root parameter identified. The plant director views a consolidated OEE scorecard across all lines with drill-down to individual loss categories. The compliance officer accesses an audit-ready batch record repository with filter-by-date, SKU, and batch-number search. Every action taken — a parameter adjustment, a line stoppage, a quality hold decision — is logged in the Shift Logbook with the user ID, timestamp, and before-and-after values.
Interfaces: operator HMI, shift manager mobile, director dashboard, compliance portal
What the Plant Director's Analytics Dashboard Shows
The analytics dashboard is designed for the plant director who needs to assess the health of the entire facility in under 30 seconds. Every view is configurable by line, product category, shift, and time horizon. The dashboard does not replace the operator's process control interface — it sits above it, aggregating data across lines and shifts to reveal patterns that no single operator or shift log could surface.
View 01
Real-Time OEE by Line With Predictive Quality Adjustment
Every production line displays its current OEE score with the standard availability, performance, and quality breakdown. The quality component is dynamically adjusted by predictive models: a line with an active batch showing elevated viscosity deviation or a filling head trending toward the control limit displays a reduced quality score immediately — not after the lab confirms the out-of-spec condition. This forward-looking OEE enables the plant director to see the efficiency cost of emerging quality issues before they produce rejected units.
Forward-looking OEE with AI quality adjustment
View 02
Batch Quality Forecast — Active and Queued Production
Every active and queued batch is listed with its predicted first-pass yield probability, the primary risk driver, and the estimated time of completion. Batches with a probability below the configured threshold are flagged with the specific parameter causing the risk — mix temperature deviation, raw material lot variance, filling head drift, or propellant pressure anomaly. The plant director can drill into any flagged batch to see the real-time process parameter overlay against the recipe specification and the historical failure envelope.
Batch-level yield forecast with risk attribution
View 03
Overall Equipment Effectiveness Loss Tree
The OEE loss tree breaks down every point of lost efficiency into the six big losses — breakdowns, setup and adjustment, idling and minor stops, reduced speed, startup rejects, and production rejects — with the specific contribution of each loss category per line. For household product manufacturing, the setup and adjustment category dominates on high-SKU-count lines where colour, fragrance, and format changeovers occur multiple times per shift. The loss tree quantifies the cost of each changeover in lost production time and first-quality units, enabling the plant director to prioritise SMED initiatives by expected OEE recovery.
Six-big-loss breakdown with changeover cost quantification
View 04
Compliance & Audit Readiness Portal
Every batch generates a compliance record automatically: raw material certificates of analysis, the as-run batch recipe with actual versus target parameters, the fill-weight trend with individual head performance, the aerosol test results where applicable, and the final quality disposition. The record structure satisfies EPA VOC documentation requirements, FIFRA record-keeping for disinfectant products, DOT classification documentation for hazardous materials, and GHS label compliance verification. Compliance searches that once took days across paper files and disconnected systems now return the complete record for any batch in under 30 seconds. The portal also tracks regulatory submission deadlines and pending certificate renewals, with automated alerts when documentation gaps are detected.
EPA/FIFRA/DOT/GHS compliant batch records — auto-generated
"
Before deploying iFactory's analytics platform, our detergent and cleaner lines operated with separate data systems for batching, filling, and compliance. The mixing room had its own logs, the filling line had a separate SCADA, and the compliance team maintained a third set of spreadsheets. When a batch failed viscosity spec, it took us four to six hours to trace the root cause across those silos — assuming the operators had noted the right parameter adjustments in their paper shift logs. Now, every parameter adjustment, every temperature deviation, every fill-head drift event is captured in the Shift Logbook and correlated with the batch record automatically. In the first two quarters, we improved OEE by 18 points across our liquid line and reduced compliance documentation labour by 70%. The EPA audit that used to require two weeks of preparation was completed with three exports from the platform.
— Plant Director, Major Household Products Manufacturer — Liquid Detergent and Aerosol Filling Operations
Real-Time OEE · AI Defect Forecasting · Auto-Generated Batch Records · Compliance Automation
Your Production Line Generates the Data. iFactory's Analytics Platform Generates the Insight Before the Defect Becomes Waste.
iFactory's analytics platform for household products manufacturing — detergent batching, liquid filling, aerosol gassing, and safety compliance — gives plant directors the real-time visibility they need to improve OEE, reduce defects, and maintain audit readiness without manual documentation overhead.
Household product manufacturing operates at the intersection of high-speed production, complex chemistry, and stringent regulation. A detergent line running 24,000 bottles per hour cannot afford to discover a fill-weight drift at the end-of-line checkweigher — by then, hundreds of cases are already non-conforming. An aerosol filling station pressurising cans with flammable propellant cannot rely on weekly leak test sampling to ensure safety — the one can that fails was produced alongside thousands that passed. A compliance team facing an EPA VOC audit cannot afford to spend two weeks assembling records from paper logs and disconnected spreadsheets — the regulatory deadline does not move.
iFactory's analytics platform addresses each of these challenges through a single architecture that connects formulation data, filling line telemetry, aerosol process parameters, and compliance documentation into one intelligence layer. The platform predicts quality deviations before they produce non-conforming product, surfaces OEE losses with root-cause attribution, and generates audit-ready batch records automatically from the data the production environment already produces. The plant directors and operations teams using iFactory consistently report OEE improvements of 15 to 25 points, defect reductions of 40 to 60 percent, and compliance documentation labour reductions of 60 to 80 percent.
iFactory's analytics platform is purpose-built for household product manufacturers who need to raise OEE, reduce quality defects, and maintain EPA, FIFRA, DOT, and GHS compliance without adding manual documentation overhead. Book a Demo to see the analytics dashboard configured for your production lines — liquid detergent batching, aerosol filling, or multi-product household chemical operations. Or talk to an expert about a free OEE and compliance-readiness assessment for your facility.
Frequently Asked Questions
The platform connects to existing automation and instrumentation through standard industrial protocols — OPC-UA, Modbus TCP, EtherNet/IP, and Siemens S7 — without any modification to the control loop or the production program. Data is read-only from the controller's perspective: the platform receives process variable transmissions but never sends commands to the line. This means deployment can occur on active production lines without requiring line re-qualification or creating a regulatory concern. For mixing vessels, the platform reads temperature, agitator speed, amperage, and level from the existing PLC and flow meters. For filling lines, it connects to checkweighers, vision systems, and fill head controllers. For aerosol gassing stations, it integrates with the propellant mass flow controllers, pressure transducers, and valve crimp monitoring systems. A typical deployment across a multi-line facility is completed in four to six weeks with no production downtime required. Talk to an expert about your specific equipment list and we will map the integration architecture for your facility.
The predictive models require paired process data and quality test results covering the defect categories the operations team wants to forecast — viscosity deviation, phase separation, fill-weight non-conformance, label defects, and aerosol leakers. For liquid detergent and cleaner lines, a minimum of six months of paired data per product-SKU combination is sufficient to train initial models with useful forecast accuracy. For aerosol operations, the same six-month baseline applies, with the added requirement that the training data includes hot water bath and burst test results linked to individual gassing station parameters. The platform ingests historical data from existing process historians, checkweigher databases, LIMS systems, and manual quality log sheets. During the initial deployment, models run in shadow mode — generating predictions without triggering production alerts — so the operations team can validate forecast accuracy against actual outcomes before relying on predictions for real-time decisions. Book a Demo to see accuracy validation data from comparable household product manufacturing deployments.
Yes. The platform registers each production line as an individual asset with its own equipment profile, recipe library, process parameter set, and compliance template. A liquid detergent line with flow-meter-based filling, checkweighing, and label inspection is managed alongside an aerosol filling station with propellant gassing control, valve crimp monitoring, hot water bath testing, and burst testing on the same unified dashboard. Each line type has its own predictive models calibrated to the relevant process variables and defect categories. Compliance records are generated according to the regulatory framework applicable to each product type — EPA VOC documentation for liquid cleaners, FIFRA efficacy records for disinfectant products, DOT hazardous material documentation for aerosol propellants — all from the same platform. The plant director sees all lines on a single OEE scorecard with the ability to filter by line type, product category, or any combination. Book a Demo to see multi-line analytics configured for a mixed liquid-detergent and aerosol facility.
When a new recipe version or a new SKU is introduced, the platform registers it with the bill of materials, process parameter targets, and quality specification limits. The predictive model for that SKU starts with a conservative prediction threshold — using similarity-based transfer learning from the closest existing product formulation — and tightens as production data accumulates. The Shift Logbook captures every parameter adjustment made during the first production runs of a new SKU, building an empirical baseline that feeds the model refinement. Similarly, when a product is reformulated — for example, switching to a bio-based surfactant or reducing water content for a concentrated formula — the platform registers the change with the effective date and reason code. The model for the new formulation begins building its own baseline while retaining the historical data from the previous formulation for comparative analysis. The plant director sees which SKUs have mature predictive models versus those in the learning phase, so decisions can be calibrated to the confidence level of the forecast. Book a Demo to see how the platform manages formulation transitions and new SKU introductions in the predictive model.
The Shift Logbook is the operator-facing data capture layer of the iFactory platform. It replaces paper shift logs, whiteboard production boards, and handover notes with a digital interface that captures every event that occurs during a shift — production start and end times with reason codes for any delays, parameter adjustments with before-and-after values, quality samples taken with results, maintenance interventions with duration and fault codes, safety incidents with documentation, and shift handover notes with outstanding action items. Every entry is time-stamped and tagged with the operator ID, line ID, and batch number. The logbook feeds directly into the analytics engine: a delay entered as a reason code in the Shift Logbook is reflected in the OEE availability calculation within the same second. A parameter adjustment noted by the operator is correlated with the corresponding change in the process data stream. This integration eliminates the disconnect between what operators know and what the analytics system sees. Book a Demo to see the Shift Logbook integrated with the analytics dashboard for a live production line.
Your Production Data Already Contains the Signature of Every Defect It Will Produce. iFactory's Analytics Platform Reads It Before the Checkweigher Confirms It. Get a Free OEE and Compliance Assessment.
iFactory's analytics platform for household products manufacturing — real-time OEE for detergent, cleaner, and aerosol lines, AI-powered defect forecasting, auto-generated batch records for EPA and FIFRA compliance, and digital shift logbook integration — all in a single intelligence layer that connects formulation to filling to compliance.