Mixer and Blender analytics for FMCG Preventing Batch Quality Failures
By Seren on June 17, 2026
An FMCG plant running a high-speed planetary mixer for mayonnaise has sixty seconds between the start of the emulsion cycle and the point at which the batch is either stable or irreversibly broken. The operator monitors motor amperage on a panel mounted to the mixer frame. If the amperage reads within the green band printed on the panel, the operator assumes the batch is progressing normally. The green band was painted when the mixer was installed — seven years ago, two thousand operating hours before the first blade replacement, and three seal replacements before the current one. It does not account for the gradual blade wear that has reduced shear efficiency by 14% over those years. It does not reflect the seal friction increase that adds 3 amps to the no-load baseline. It does not adjust for the viscosity difference between summer and winter oil temperatures. The batch in the mixer may be failing — developing an off-spec viscosity, an incomplete emulsion, an inconsistent particle size distribution — while the operator watches a green band that describes a machine that no longer exists. This is the gap that mixer and blender analytics closes: not by replacing the operator's judgement, but by replacing the static reference band with a dynamic equipment model that tracks every component degradation state, every process parameter shift, and every batch quality outcome, and schedules preventive action before the next batch is lost. Book a Demo to see the iFactory platform configured for FMCG mixer and blender analytics with Shift Logbook integration for batch quality tracking.
Motor Load Monitoring · Seal Integrity · Blade Wear Analytics · Preventive Scheduling
The Green Band on Your Mixer Panel Describes a Machine That No Longer Exists. Dynamic Analytics Prevents the Batch Failure Before It Costs You Production Time.
iFactory's mixer and blender analytics platform monitors motor load profiles, seal condition trends, impeller wear rates, and batch quality correlation data from every mixing cycle — then schedules preventive maintenance exactly when the equipment condition requires it, not on a calendar. Shift Logbook integration ensures every shift team sees the current equipment state before the batch starts.
Average reduction in batch quality deviations reported by FMCG plants that deploy continuous mixer motor load monitoring with preventive analytics scheduling — catching seal wear and blade degradation before they affect product consistency
68%
Reduction in unplanned mixer downtime when preventive maintenance is scheduled based on actual equipment condition data — motor vibration trends, seal leakage detection, and impeller wear analysis — rather than fixed calendar intervals
2.4×
Extension of mean time between seal replacements achieved by FMCG facilities using predictive seal wear monitoring — replacing seals at the point of measurable degradation rather than at fixed calendar intervals that waste useful seal life
94%
Batch quality yield rate achieved by plants that integrate mixer analytics with Shift Logbook — operators review equipment health data and batch quality trends before every mixing cycle and adjust parameters proactively
The Six Mixer and Blender Failure Modes That Drive Batch Quality Failures in FMCG
Mixer and blender failures in FMCG production rarely announce themselves as catastrophic events. They manifest as gradual, compounding degradation that the operator perceives as normal process variation until the batch fails quality inspection. A planetary mixer whose blade clearance has increased by 2 mm over twelve months of abrasive slurry processing still produces mayonnaise — but the emulsion stability declines from a six-month shelf life to a four-month shelf life, and the plant does not discover the shift until the first customer complaint arrives. A ribbon blender whose seal has developed a 0.5 mm gap still blends dry powder blends — but the cross-contamination rate between product changeovers rises from below 0.1% to above 0.8%, and the quality team attributes the deviation to operator error rather than the seal condition. The failure mode classification that operations directors and plant engineers need to implement covers six specific degradation mechanisms, each with a distinct signature in the equipment analytics data.
The Six Failure Modes — Each Detectable Through Continuous Motor Load and Vibration Analytics Before It Affects Batch Quality
01
Impeller and Blade Wear
In high-shear mixers processing abrasive FMCG products — mayonnaise, salad dressings, peanut butter, toothpaste, pigment dispersions — impeller blade edges wear progressively with every batch. A new blade produces a specific shear profile that determines droplet size distribution in emulsions or particle size in dispersions. As the blade wears, the shear energy transferred to the product declines, and the droplet size distribution shifts toward larger, less stable droplets. The operator sees no change on the motor load ammeter because the motor draws less current as the blade encounters less resistance — the opposite of what most operators expect. Motor load trending over time reveals a gradual current decline that correlates directly with blade wear. Without continuous trending, the plant discovers the wear only when the batch fails emulsion stability testing or when a routine blade measurement reveals clearance outside specification. Preventive analytics scheduling triggered by motor load trend deviation replaces calendar-based blade replacement with condition-based replacement, extending blade life by 30 to 50% while eliminating the quality risk window.
Preventive fix: Motor load trend declines below baseline threshold — blade inspection and replacement triggered before next batch.
02
Mechanical Seal Degradation and Leakage
Mechanical seals on mixer and blender shafts are the single most common source of unplanned quality events in liquid and semi-solid FMCG processing. A developing seal leak introduces air into the product — producing foam, incomplete emulsions, and viscosity deviations — or allows product to escape, creating hygiene risks, yield loss, and cleaning validation failures. Seal degradation produces a characteristic signature in the equipment data: a gradual increase in motor load at the start of each mixing cycle (from increased friction as the seal faces wear) followed by a sudden decrease (when the seal breaches and lubrication is lost). The analytics system detects this pattern and generates a preventive alert. The typical window between the initial friction increase and the full seal breach is 40 to 120 operating hours — sufficient time to schedule seal replacement at the next product changeover without unplanned downtime.
Preventive fix: Motor load start-cycle spike exceeds alert threshold — seal inspection scheduled before next high-value batch.
03
Bearing Deterioration and Shaft Misalignment
Mixer and blender bearings operate under combined radial and axial loads that vary with batch viscosity, fill level, and mixing speed. Bearing deterioration produces vibration patterns detectable by accelerometers mounted on the mixer frame or bearing housing — an increase in high-frequency vibration amplitude that precedes audible noise or visible shaft movement by hundreds of operating hours. The quality consequence of undetected bearing deterioration is not bearing failure — it is the gradual shaft movement that changes the clearance between the impeller blade and the mixing vessel wall, creating dead zones where product is not fully mixed, and hot spots where localised shear exceeds specification. For ribbon blenders, shaft misalignment causes the ribbon flights to contact the trough wall, generating metal contamination that triggers a full batch quarantine and cleaning validation.
Planetary mixers and heavy-duty blenders use gearboxes that transmit high torque at low speeds. Gear tooth wear produces a vibration signature at the gear mesh frequency — a pattern that analytics algorithms detect months before the gearbox generates audible noise or metal particles appear in the oil analysis sample. The quality impact of gearbox wear is mixing speed inconsistency. As gear teeth wear, the output shaft speed develops periodic variation — a few RPM of fluctuation at the gear mesh frequency that translates into inconsistent shear input across the mixing cycle. For products where mixing time is calibrated to achieve a specific emulsion droplet size or powder blend uniformity, even minor speed variation produces measurable batch-to-batch quality variation. The plant attributes the variation to raw material differences while the root cause is the gearbox that has been operating with worn teeth for 2,000 hours.
Preventive fix: Gear mesh frequency vibration amplitude trend triggers oil analysis and gearbox inspection.
05
Bowl and Vessel Wall Wiping Clearance Drift
For mixers with wall-wiping blades — common in scrape-surface heat exchangers, planetary mixers for viscous products, and horizontal blenders — the clearance between the blade edge and the vessel wall increases as both the blade and the wall wear. A 1 mm increase in clearance on a 200 mm diameter planetary mixer bowl creates a 1% dead zone volume fraction that grows exponentially as clearance increases. Product trapped in the dead zone is over-sheared, over-heated, or not mixed at all, creating colour variation, texture inconsistency, and microbiological risk if the dead zone product remains in the vessel across cleaning cycles. The clearance drift is detectable through motor load analysis: reduced clearance produces higher load at constant speed, and the load trend over months reveals the clearance change before it reaches the threshold that affects batch quality. Plants that monitor this trend schedule bowl reconditioning and blade replacement based on the analytics signal, not on the calendar.
Preventive fix: Motor load trend at steady-state mixing declines below threshold — blade clearance measurement and reconditioning triggered.
06
Motor Winding Insulation Degradation
Mixer motors operating in wet FMCG environments — CIP spray, product splash, high-humidity processing areas — experience gradual insulation degradation that increases leakage current and eventually produces winding failure or intermittent tripping. The intermediate quality symptom that plants do not connect to motor condition is batch time variation: as motor winding temperature rises from insulation degradation, the thermal protection system reduces output, extending the mixing cycle time from batch to batch. Operators compensate by running the mixer longer, but the extended mixing time does not produce the same shear profile as the standard time because the lower motor output changes the shear rate throughout the cycle. The result is batch-to-batch quality variation that the plant attributes to raw material or recipe issues while the motor is the root cause. Motor insulation resistance trending from a simple leakage current sensor, integrated with the batch cycle time data in the analytics system, identifies the correlation and triggers winding inspection or motor replacement before the batch quality impact becomes measurable.
Preventive fix: Leakage current trend and cycle time deviation correlate — motor winding inspection scheduled.
How Preventive Analytics Scheduling Works for Mixer and Blender Equipment
The difference between calendar-based preventive maintenance and analytics-driven preventive scheduling is the difference between maintaining a machine on an assumption and maintaining it on evidence. Calendar-based PM changes a mixer seal every six months regardless of whether the seal has 500 operating hours or 2,500 operating hours — wasting seal life on lightly used equipment while leaving heavily used seals at risk of failure before the PM interval. Preventive analytics scheduling replaces the calendar with a set of condition thresholds derived from the equipment's own operating data, triggering maintenance actions at the point where the data indicates degradation has begun but has not yet affected product quality. For mixer and blender equipment in FMCG production, the analytics system monitors the six failure modes described above and generates a preventive work order when any condition threshold is crossed — not when the calendar date arrives.
iFactory Preventive Analytics Scheduling: Three Mechanisms for Mixer and Blender Equipment
01
Motor Load Profile Baseline and Trend Detection
The system establishes a motor load baseline for every product recipe processed on the mixer or blender — because acceptable load varies by product viscosity, batch size, and mixing speed. Each batch produces a load profile curve showing current draw across the mixing cycle: start-up peak, steady-state mixing load, and discharge load. The analytics engine compares each new batch's load profile against the historical baseline for the same product. A steady-state load decline of more than 5% from baseline triggers a blade wear alert. A start-up load increase of more than 8% triggers a seal condition check. A load profile shape change — a plateau that was previously a smooth curve — triggers a viscosity or batch consistency investigation that may prevent a quality failure before the batch completes.
02
Multi-Axis Vibration Spectrum Analysis
Accelerometers mounted on the mixer frame or bearing housings collect vibration data across three axes at sampling rates sufficient to capture bearing frequencies, gear mesh frequencies, and blade pass frequencies. The FFT spectrum is analysed against baseline signatures collected after the most recent major maintenance event. The analytics system detects bearing deterioration at its earliest stage — a 1 to 2 dB increase in the bearing defect frequency band that occurs 200 to 600 operating hours before the bearing generates audible noise. Gear mesh frequency analysis detects gear tooth wear at a similar lead time. For planetary mixers, the blade pass frequency — the frequency at which each blade passes the stationary scraper — reveals blade clearance changes with sub-millimetre resolution, enabling the system to predict the batch at which clearance drift will exceed specification.
03
Batch Quality Correlation and Work Order Automation
The most powerful analytics signal for preventive scheduling is the correlation between equipment condition data and batch quality outcomes. When a batch fails viscosity, emulsion stability, or particle size specification, the system traces backward through the equipment data to identify the condition threshold that was crossed — a specific vibration amplitude, a specific motor load deviation, a specific seal temperature reading. That threshold becomes the alert trigger for future batches. The next time the same condition threshold is detected, the analytics system automatically generates a preventive work order in the Shift Logbook, assigns it to the maintenance team, and schedules the work at the next available product changeover window. The operator starting the next shift sees the preventive work order on the Shift Logbook dashboard along with the equipment condition data that triggered it — closing the loop between equipment analytics and batch quality protection.
Every Batch That Fails Quality Inspection Was Preceded by a Detectable Equipment Condition Signal. The Question Is Whether Your Plant Captures That Signal Before the Next Batch.
iFactory's preventive analytics scheduling platform correlates motor load, vibration, seal condition, and batch quality data from every mixing cycle to generate preventive work orders exactly when equipment condition requires them — not on a calendar schedule that has no relationship to actual equipment degradation. Shift Logbook integration ensures every shift operator sees the current equipment health state and any scheduled preventive actions before the first batch of the shift.
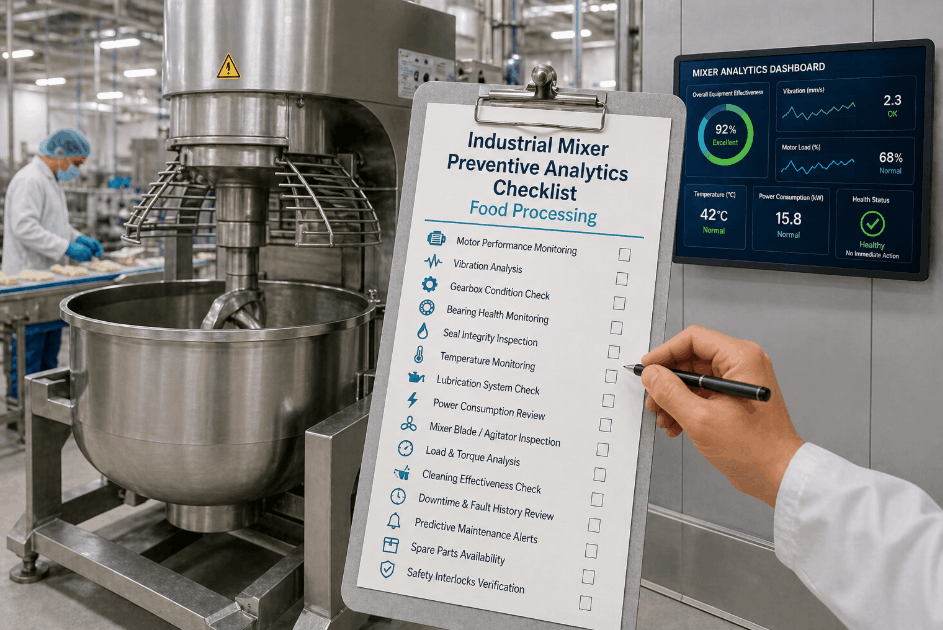
The Plant Manager's Dashboard: What Mixer and Blender Analytics Shows in Real Time
A plant manager or operations director responsible for mixer and blender equipment across multiple production lines does not need a data scientist's view of the analytics system. The dashboard that drives operational and quality decisions needs to answer seven questions quickly: Which mixers or blenders are currently at risk of a condition that would affect batch quality? What is the current motor load and vibration trend for every active machine? Are any preventive work orders overdue or due within the current shift? What is the batch quality yield trend and is any production line showing a decline? Which failure modes are driving the most quality events this quarter? Are there specific product recipes that consistently produce higher equipment stress? And when the auditor or customer asks, what is the evidence that the preventive maintenance programme is effective? iFactory is designed to answer all seven without requiring manual data assembly.
Dashboard View 01
Equipment Health Score by Mixer and Production Line
Every mixer and blender in the plant displays a live equipment health score calculated from motor load trend position, vibration amplitude, seal condition state, bearing temperature, and hours since last preventive maintenance. The health score is presented as a percentage with traffic-light status — green above 85%, amber between 70 and 85%, red below 70%. A planetary mixer whose motor load has declined by 6% and whose bearing vibration has increased by 3 dB shows an amber health score of 78% — before the next batch is started, the operator sees the risk and the dashboard suggests the likely cause. Plant managers see the full equipment health landscape in a single view and identify which mixer requires attention before it affects production.
Manager action: Health score below 85% triggers review and preventive work order confirmation.
Dashboard View 02
Motor Load Trend by Recipe — Blade Wear Visibility
Motor load data is segmented by product recipe, providing a per-recipe baseline and trend view. The plant manager can select any mixer for the current shift, week, or month and see the load curve for each recipe processed on that machine. A load decline of 4% for mayonnaise batches on Line 2 planetary mixer — while the same recipe on Line 3 mixer shows no decline — identifies blade wear on Line 2 with high specificity. The analytics system flags the deviation automatically, calculates the estimated remaining blade life based on the wear rate trend, and recommends the optimal replacement window. The Shift Logbook entry for the affected batches records both the motor load data and the blade condition flag, so the operator team understands the reason for the recommended action.
Manager action: Per-recipe load trend deviation triggers blade inspection recommendation with remaining life estimate.
Dashboard View 03
Seal Condition Monitor with Leak Risk Prediction
Mechanical seal condition is assessed using a combination of start-cycle motor load spike trend, seal flush flow rate, seal temperature, and acoustic emission data. The seal condition monitor displays a risk score for each seal — low, medium, high, critical — with the estimated time to seal breach based on the trend rate. A seal showing medium risk with an estimated 60 hours to breach allows the plant to schedule replacement at the next product changeover without stopping production. A high-risk seal with 12 hours to breach requires immediate attention and triggers a work order that the maintenance team reviews at the start of the next shift. The seal replacement history is recorded in the equipment record, allowing the analytics system to track seal life by manufacturer, installation date, product type, and operating conditions — building a seal reliability database that improves procurement and specification decisions over time.
Manager action: Seal risk score and time-to-breach estimate drives replacement scheduling at next product changeover.
Dashboard View 04
Batch Quality Yield Trend by Mixer and Product Family
Quality yield — the percentage of batches passing first-pass quality inspection — is displayed by mixer, by product family, and by production line. A yield decline of 3% on one mixer over a two-week period triggers an automated correlation analysis that compares the yield decline against all equipment condition data for the same period. The system identifies the condition trend that best correlates with the quality decline — a bearing vibration increase, a motor load shift, a seal temperature rise — and presents the correlation as a root cause hypothesis for the plant manager to investigate. This connection between equipment condition and quality outcome is the core analytics capability that separates preventive scheduling from calendar-based maintenance: the calendar assumes all equipment degrades at the same rate, while condition-based analytics identifies the specific machine-device combination that is currently affecting product quality.
Manager action: Yield decline triggers automated condition correlation to identify root cause equipment.
Dashboard View 05
Preventive Work Order Forecast and Schedule Optimisation
The analytics system forecasts preventive work orders for the next 7, 14, and 30 days based on current condition trends and estimated degradation rates. A ribbon blender whose bearing vibration amplitude trend projects crossing the alert threshold in 11 days generates a work order forecast for day 10 — allowing the plant manager to schedule the bearing replacement during a planned product changeover rather than as an emergency intervention. The schedule optimisation tool groups preventive work orders by location, product changeover schedule, and crew availability to minimise production impact. A mixer that needs a blade replacement and a seal inspection within the same week generates a single planned downtime event rather than two separate interventions. The forecast view shows the plant manager the maintenance workload coming in the next four weeks, with the equipment condition data that justifies each scheduled action.
Manager action: 30-day work order forecast enables planned downtime scheduling, not emergency response.
Dashboard View 06
Mixer OEE and Quality Loss Integration
Quality loss from batch failures, rework, and downgraded product is the most under-reported component of mixer and blender OEE in FMCG processing. iFactory integrates quality event costs into the OEE calculation so plant managers see the true operational impact of equipment degradation: not just a declining condition score, but production utilisation and schedule attainment declining in parallel. When a batch is downgraded from primary product to secondary grade because of viscosity deviation caused by blade wear on a planetary mixer, the OEE impact is calculated and attributed to the equipment condition that caused it. This integration transforms the maintenance conversation from a cost-centre discussion to a revenue-protection discussion — investing in blade replacement or bearing maintenance is justified by the batch yield improvement that the analytics data already demonstrates.
Manager action: Quality loss appears in the OEE dashboard — equipment maintenance becomes a yield improvement investment.
"
We run twelve planetary mixers across three production lines — mayonnaise, salad dressings, and sauce products. Before deploying analytics, we replaced blades on a fixed 2,000-hour schedule and replaced seals every six months regardless of condition. Our batch quality yield was 87% — we accepted that 13% of batches would require adjustment, rework, or downgrade. The analytics system identified within the first two months that one of our twelve mixers was producing a motor load trend 8% below the plant average, and the vibration spectrum showed blade pass frequency amplitude consistent with measurable clearance drift. We inspected the mixer and found blade clearance 1.4 mm above specification. That single mixer had been producing increasingly unstable emulsion for an estimated 400 batches. After replacing the blades and reconditioning the bowl, its batch quality yield went from 79% to 96%. The plant-wide yield moved from 87% to 93% within the first quarter on the analytics system. The PM cost did not increase — we just stopped replacing blades and seals on machines that did not need them and concentrated maintenance on the machines that did.
Conclusion: Preventive Analytics Scheduling Is the Operating Standard for Mixer and Blender Quality Protection
Mixer and blender batch quality failures in FMCG production are never random events. Every off-spec viscosity batch, every incomplete emulsion, every particle size distribution deviation, and every cross-contamination incident is the end result of a degradation sequence that began hundreds of operating hours earlier — when a blade edge first dulled, when a seal face first developed a micro-crack, when a bearing race first showed subsurface fatigue, when an impeller clearance first drifted outside specification. The plant that catches the sequence at the beginning of the degradation arc prevents the batch failure. The plant that catches it after the batch fails has already lost the production time, the raw material, and the schedule adherence that the failure consumed.
The evidence from FMCG facilities that have deployed preventive analytics scheduling is clear: batch quality yield improvement of 5 to 12 percentage points within the first two quarters of operation, unplanned mixer downtime reduction of 60 to 70%, seal life extension of 2 to 3 times through condition-based replacement, and blade life extension of 30 to 50% through wear trend monitoring rather than calendar-based replacement. These improvements are not theoretical projections from equipment suppliers — they are operational results documented by plant managers who replaced calendar-based PM programmes with analytics-scheduled maintenance driven by motor load, vibration, seal condition, and batch quality correlation data.
iFactory's mixer and blender analytics platform is built specifically for FMCG plant managers and operations directors who need to protect batch quality through equipment condition monitoring and preventive scheduling. Book a Demo to see the analytics system configured for your mixer fleet and product portfolio, or talk to an expert about a free mixer condition assessment and preventive scheduling review for your facility.
Frequently Asked Questions
The baseline is established per product recipe, not per machine overall — because a planetary mixer processing low-viscosity dressing draws a different motor load profile than the same mixer processing high-viscosity mayonnaise. During the initial data collection period, which typically spans 10 to 20 production batches of each recipe, the system captures the average motor load curve for each recipe-mixer combination, including start-up peak, steady-state mixing load, cycle time, and discharge load characteristics. Each subsequent batch is compared against the per-recipe baseline specifically. A deviation in the steady-state load for mayonnaise batches does not trigger an alert if the mixer has just switched to a dressing batch with a different viscosity baseline. The system also automatically recalibrates the baseline after significant maintenance events — blade replacement, seal replacement, motor replacement — because the new condition produces a new baseline that the system must learn. Talk to an expert about configuring per-recipe load baselines for your specific product portfolio.
The platform works with the instrumentation that most FMCG mixers and blenders already have. Motor current transformers on the VFD output or motor starter provide the motor load data that is the primary analytics signal. Accelerometers mounted on the mixer frame or bearing housing provide vibration data — wireless IoT accelerometers with magnetic mounting are typically installed during a single production day without permanent modifications to the equipment. For seal condition monitoring, the platform can integrate existing seal flush flow meters and temperature sensors where they are already installed, or add low-cost temperature and acoustic emission sensors at the seal housing. The platform connects to existing PLC and SCADA systems via standard OPC-UA and Modbus protocols to ingest process data that is already being collected but not analysed for condition trends. The typical sensor upgrade for a mixer or blender that has basic motor current monitoring already in place is the addition of two to four wireless accelerometers and one seal temperature sensor — representing an instrumentation cost of approximately 500 to 900 USD per machine. talk to an expert about the sensor configuration options for your specific mixer types and existing instrumentation levels.
The transition follows a structured three-phase approach. Phase one — parallel monitoring — runs the analytics system alongside the existing calendar-based PM programme for 4 to 8 weeks while the analytics model establishes motor load baselines, vibration signatures, and seal condition patterns for each mixer. During this phase, no maintenance action is triggered by the analytics system; it operates in observation mode to build its condition models and validate its alert thresholds against actual equipment events. Phase two — advisory alerts — activates analytics-based condition alerts as recommendations to the maintenance team, while the calendar-based PM programme continues to generate scheduled work orders. The maintenance team reviews analytics recommendations during the weekly scheduling meeting and adjusts the PM schedule based on the evidence from the data. Phase three — analytics-driven scheduling — transfers primary scheduling authority to the analytics system, with the calendar-based PM programme retained as a fallback for equipment where the analytics has not yet established reliable condition models. The typical full transition timeline is 8 to 16 weeks, depending on the number of mixers, the diversity of product recipes, and the existing instrumentation level. Talk to an expert about a transition plan for your specific mixer fleet and PM programme structure.
This is the most important design requirement for any mixer analytics system, and the platform addresses it through three mechanisms. First, per-recipe baselines eliminate the most common source of false alerts — viscosity variation between products — because the system compares current conditions against the historical data for the same recipe, not against a plant-wide average. Second, the trend analysis window is configurable and typically set to 20 to 50 batches, filtering out the short-term variation that comes from raw material batch differences, ambient temperature changes, and operator technique variation. A sudden motor load spike on a single batch is flagged as an observation but does not trigger a work order unless it exceeds the alert threshold by a significant margin or repeats across multiple consecutive batches. Third, the correlation with batch quality data provides a validation layer that equipment-only analytics systems lack: if the motor load trend is declining but batch quality yield remains stable, the system adjusts the alert threshold upward, because the data does not yet support a correlation between the load change and product quality. The alert threshold tightens automatically when quality data shows that a specific condition level has produced batch quality failures in the past. talk to an expert to see the false alert rate data from comparable FMCG mixer analytics deployments.
Your Mixer Blades Were Replaced 500 Hours Ago. How Much Have They Worn Since Then? Get a Free Mixer Condition Assessment and Preventive Scheduling Review.
iFactory's mixer and blender analytics platform for FMCG — motor load profiling, multi-axis vibration analysis, seal condition monitoring, and batch quality correlation — with Shift Logbook integration that puts equipment health data and preventive work orders in front of every shift team before the first batch starts.