Every FMCG corporate analytics director knows the standardization frustration. The company operates 12 plants across three regions, each producing similar product categories on similar equipment lines aseptic fillers, case packers, palletisers, CIP skids, boilers, compressors. Each plant runs analytics. Each plant tracks OEE, downtime, energy consumption, and quality yield. But when the corporate team asks for a simple cross-plant comparison "Which plant has the highest OEE on aseptic filling for 250ml cartons?" the answer takes three weeks to compile and arrives with a qualification that the numbers are not directly comparable. Plant A calculates OEE using 24/7 calendar hours as the denominator. Plant B uses planned production hours. Plant C excludes changeover time from availability. Plant A classifies a packaging film jam as a breakdown. Plant B classifies the same event as a minor stop. Plant C does not track packaging film jams as a separate category. The data definitions, calculation methodologies, equipment hierarchies, and coding taxonomies evolved independently at each plant because there was no corporate analytics standard when the systems were deployed. The consequence is that the FMCG corporate team spends 60 to 70 percent of its analytics effort on data reconciliation normalising definitions, aligning hierarchies, and resolving calculation discrepancies leaving only 30 to 40 percent for the actual analysis that drives cross-plant improvement. iFactory AI's Multi-Plant Portfolio Management module solves this by providing a corporate analytics standardisation platform common data definitions, unified equipment hierarchies, standardised calculation methodologies, and centralised reporting so that every plant in the portfolio generates comparable, auditable analytics from the same framework. Book a Demo to see how iFactory's multi-plant analytics standardisation platform enables true cross-plant benchmarking and corporate-level visibility for FMCG corporations.
60–70%
Of corporate analytics effort consumed by data reconciliation across plants rather than cross-plant analysis and improvement identification
3–5x
Time required to generate a cross-plant performance report compared to a single-plant report when each plant uses independent analytics definitions and methodologies
15–25%
Improvement in cross-plant performance when standardised analytics enable direct comparison and best-practice transfer between similar production lines
80–90%
Reduction in cross-plant report generation time when standardised analytics definitions and centralised reporting replace manual data collection and reconciliation
Multi-Plant Portfolio Management · Common Analytics Framework · Centralised Reporting
Every Plant Tracks OEE. None Track It the Same Way. Corporate Analytics Standardisation Makes Cross-Plant Comparison Possible Without Manual Reconciliation.
iFactory's Multi-Plant Portfolio Management platform delivers common data definitions, unified equipment hierarchies, standardised calculation methodologies, and centralised reporting across all FMCG plants — eliminating the reconciliation effort and enabling true cross-plant benchmarking for corporate analytics teams.
The Three Standardisation Gaps That Prevent Cross-Plant Analytics Comparison
Every FMCG corporation that operates multiple plants encounters the same three standardisation gaps that prevent direct cross-plant analytics comparison. A common analytics framework is designed to close each one without requiring each plant to abandon its existing systems or re-train its entire team.
Data Definition Gap
Every analytics metric starts with a definition — what counts as a breakdown, how changeover time is classified, what constitutes a quality defect, which energy sources are included in Scope 2 emissions, how waste diversion rate is calculated, what time periods are used for availability calculation. When each plant defines these terms independently, the resulting metrics are not comparable even when they carry the same label. Plant A defines breakdown as any unplanned stop exceeding 10 minutes. Plant B uses 5 minutes. Plant C uses 15 minutes but excludes events during changeover. Plant A includes refrigerant make-up in Scope 1 emissions. Plant B reports it separately. Plant C does not track it. The differences are not right or wrong — they are simply not aligned. A common analytics framework establishes a single set of data definitions for the entire corporate portfolio, with each plant's local definitions mapped to the corporate standard through a configurable translation layer.
Standardisation fix: Corporate data dictionary with plant-level definition mapping eliminates comparison uncertainty at the source.
Equipment Hierarchy Gap
Each plant organises its equipment hierarchy differently. Plant A groups equipment by production line (Line 1 filler, Line 1 case packer, Line 1 palletiser). Plant B groups by function (all fillers, all packers, all palletisers). Plant C uses a hybrid model with geographical zones. When the corporate team asks for the OEE of "aseptic fillers across the portfolio," the answer requires mapping each plant's hierarchy to a common structure — a task that takes days and produces results that are accurate only to the granularity of the coarsest hierarchy. A common equipment taxonomy establishes a single corporate equipment hierarchy with standardised equipment types, functional locations, and aggregation levels. Each plant maps its local equipment structure to the corporate hierarchy once, and all cross-plant analytics are then generated automatically from the standardised structure without repeated manual mapping.
Standardisation fix: Corporate equipment taxonomy with one-time plant-level mapping enables automatic cross-plant aggregation at any hierarchy level.
Calculation Methodology Gap
Even when two plants use the same data definition and the same equipment hierarchy, they may calculate the same metric differently. OEE can be calculated using fixed theoretical cycle time, ideal cycle time adjusted for product mix, or actual best demonstrated cycle time. Availability can be calculated as a percentage of calendar time, planned production time, or scheduled operating time. Quality yield can be calculated as first-pass yield, final yield after rework, or rolled throughput yield. Each methodology produces a different numerical result for the same physical process. A common calculation methodology specification defines the exact formula, data source, time base, and aggregation method for every corporate analytics metric — ensuring that a 92 percent OEE at Plant A means the same thing as a 92 percent OEE at Plant B.
Standardisation fix: Corporate calculation methodology specification with version control ensures metric comparability across all plants at all times.
How a Common Analytics Framework Standardises Multi-Plant Operations
The common analytics framework provides three integrated capabilities that enable FMCG corporations to standardise analytics across all plants without requiring each plant to abandon its existing systems, re-train its team, or adopt a single software platform for all data collection.
Standardisation Layer 01
Corporate Data Dictionary and Definition Mapping
The corporate data dictionary defines every analytics metric used across the portfolio — the metric name, its formal definition, the calculation formula, the data sources required, the time base and aggregation method, and the applicable reporting framework reference. Each plant's local data definitions are mapped to the corporate dictionary through a translation layer that converts the plant's native definitions to the corporate standard at the point of data ingestion. The translation layer preserves the plant's local definitions for operational use — shift supervisors at Plant A continue using the 10-minute breakdown threshold they have used for years — while the corporate analytics team sees all plants on the common 5-minute threshold defined in the corporate standard. The mapping is configured once per plant and updated only when the corporate standard changes or the plant reconfigures its local systems.
Outcome: Every corporate report uses consistent definitions. Every plant report uses familiar local definitions. No reconciliation required.
Standardisation Layer 02
Unified Equipment Hierarchy and Asset Registry
The unified equipment hierarchy establishes a single corporate taxonomy for all equipment across all plants. The taxonomy defines equipment types (aseptic filler, case packer, palletiser, boiler, compressor, CIP skid), functional locations (production line 1, utility zone 3, packaging area 2), aggregation levels (plant, department, line, equipment unit, component), and standard attributes (OEM, model year, rated capacity, installation date). Each plant's local equipment registry is mapped to the corporate hierarchy through a one-time configuration that links each local asset record to its corporate equipment type and functional location. Once mapped, all corporate analytics OEE by equipment type across all plants, availability by functional location by region, energy intensity by equipment model year are generated automatically from the standardised structure. When a plant adds new equipment or reconfigures its production lines, the local update triggers a notification to the corporate analytics team to validate the corporate hierarchy mapping.
Outcome: Cross-plant comparison by equipment type, functional location, or OEM is instant. No manual hierarchy mapping per report.
Standardisation Layer 03
Centralised Reporting and Cross-Plant Benchmarking
Centralised reporting aggregates each plant's standardised analytics into a single corporate dashboard that displays performance metrics — OEE, availability, performance rate, quality yield, energy intensity, water intensity, waste diversion rate, maintenance cost per unit, and overall equipment effectiveness by equipment type — for every plant in the portfolio. The corporate team filters by region, plant, production line, equipment type, product category, or time period and sees comparable metrics across all plants that match the filter criteria. Cross-plant benchmarking automatically ranks plants by each metric, identifies the top-performing plant (the benchmark target) and the bottom-performing plant (the improvement opportunity), and calculates the performance gap between them. The benchmarking engine highlights the specific practices, equipment configurations, or operating conditions that correlate with top-quartile performance, giving the corporate team actionable insights for best-practice transfer rather than just performance rankings.
Outcome: Corporate team sees which plants lead and which lag, by how much, and why — without manual data reconciliation for each comparison.
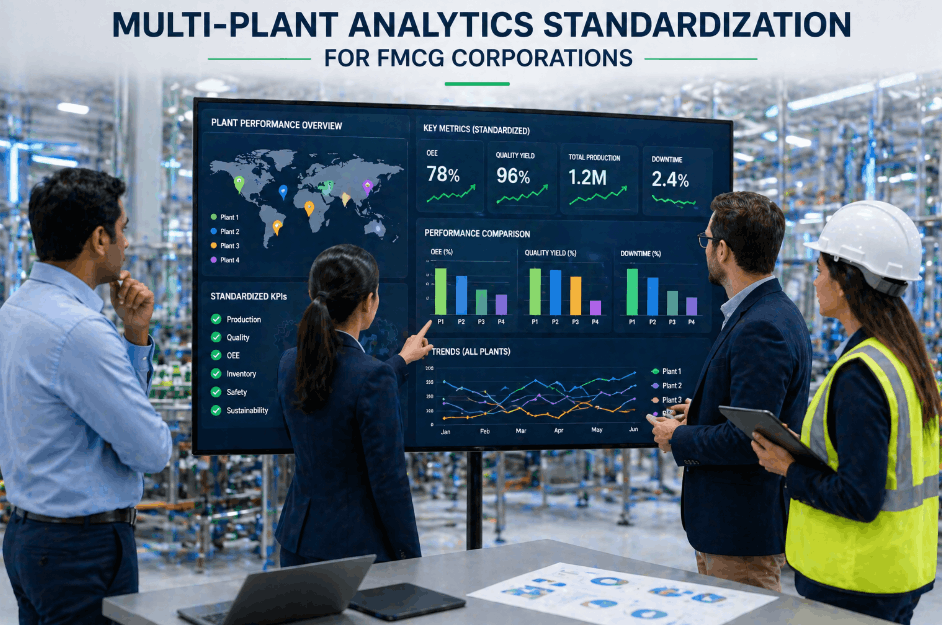
The Corporate Analytics Director's Dashboard: Multi-Plant View
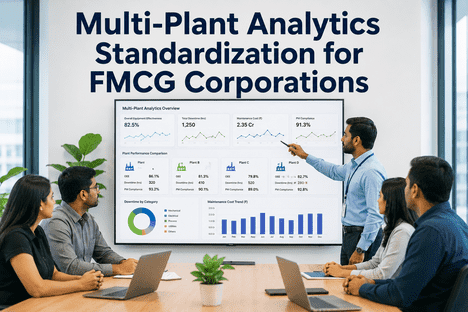
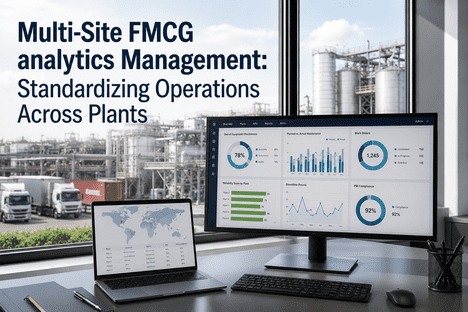
The corporate analytics dashboard presents standardised performance metrics across all plants in a single view, with drill-down capability to plant, line, and equipment level. The dashboard replaces the current process of emailing spreadsheets, reconciling definitions, and waiting for each plant to submit its monthly numbers.
A
Portfolio OEE and KPI Scorecard by Plant
A single-page scorecard displays each plant's current OEE, availability, performance rate, quality yield, energy intensity, and maintenance cost per unit — all calculated using the same corporate definitions and methodology. Each metric is colour-coded against the corporate target range: green (above target), amber (within 10 percent of target), or red (below target). The corporate analytics director sees at a glance which plants are meeting targets across all metrics and which plants have specific gaps. The scorecard is updated automatically from each plant's data feed, eliminating the monthly submission cycle where each plant emails its numbers and the corporate team reconciles them before the scorecard can be published.
Action: Identify plants with multiple red metrics. Schedule targeted improvement review. No reconciliation delay.
B
Cross-Plant Benchmarking — Top and Bottom Quartile
The benchmarking view automatically segments plants into quartiles by each performance metric. The top-quartile and bottom-quartile plants for each metric are displayed with the performance gap calculated as both an absolute difference and a percentage. The benchmarking engine analyses the operating conditions, equipment configurations, shift patterns, and maintenance practices of top-quartile plants and surfaces the common patterns that correlate with superior performance. When a bottom-quartile plant has a specific practice that matches a top-quartile plant — for example, both run the same filler model but the top-quartile plant uses a different changeover procedure that reduces downtime by 40 percent — the platform flags the practice as a transfer candidate and generates a best-practice summary that the bottom-quartile plant can implement.
Action: Transfer best practices from top-quartile to bottom-quartile plants. Measure impact through performance gap closure.
C
Definition Compliance and Data Quality Score
The definition compliance panel tracks each plant's adherence to the corporate analytics standard. Each plant receives a compliance score calculated from the percentage of metrics that are mapped to the corporate definition, the percentage of equipment assets that are mapped to the corporate hierarchy, and the percentage of data fields that are populated with valid values. Plants with low compliance scores are flagged for remediation, and the platform provides a gap analysis that shows exactly which definitions, mappings, or data fields need attention. The data quality score tracks completeness, accuracy, and timeliness of each plant's data submissions. A plant that consistently submits incomplete or late data receives a lower quality score, which is visible to the corporate team and factored into the plant's overall performance assessment.
Action: Low compliance plants receive targeted support to complete definition mapping. Data quality improves before corporate reports are generated.
Corporate Data Dictionary · Unified Equipment Hierarchy · Centralised Reporting · Benchmarking
Your Plants Are Not Incomparable. Your Analytics Framework Just Hasn't Been Standardised Yet. Common Definitions, Unified Hierarchies, and Centralised Reporting Close the Gap.
iFactory's Multi-Plant Portfolio Management platform delivers the common analytics framework that FMCG corporations need — standardised data definitions, unified equipment hierarchies, centralised cross-plant reporting, and automated benchmarking — without requiring each plant to abandon its existing systems or retrain its team.
We acquired a competitor with six FMCG plants and suddenly our corporate portfolio went from seven plants to thirteen. The acquired plants had their own analytics systems with completely different definitions — they calculated OEE using 24-hour calendar time, we used planned production hours. They classified changeover as a breakdown category, we classified it as a separate loss category. They did not track minor stops at all. When our CEO asked which plants had the highest OEE on high-speed filling lines, I knew the honest answer was that we could not compare them without weeks of reconciliation work. iFactory's multi-plant standardisation platform gave us a corporate data dictionary that mapped both sets of definitions to a common standard, a unified equipment hierarchy that covered all thirteen plants, and a centralised dashboard that showed the CEO the answer in real time — Plant 8 had the highest OEE on high-speed filling, and Plant 3 had the biggest improvement opportunity. The reconciliation work that used to take three weeks now takes zero. The analytics team has shifted from data reconciliation to improvement analysis, and cross-plant best-practice transfer is happening systematically for the first time.
— Corporate Analytics Director, Multinational FMCG Corporation — 13 Plants, 8 Countries, 4 Product Categories
ROI Model: Multi-Plant Analytics Standardisation for FMCG Corporations
Corporate Portfolio — 10 Plants
$1.2M
Annual analytics team productivity recovery by eliminating data reconciliation effort. Based on 3 FTE at 70 percent reconciliation workload shifting to 90 percent analysis workload after standardisation.
Cross-Plant Improvement — 12-18 Months
15-25%
Performance improvement in bottom-quartile plants through systematic best-practice transfer from top-quartile plants enabled by direct cross-plant comparison.
Report Generation Time
80-90%
Reduction in cross-plant report generation time. Multi-plant reports that required 3-5 person-days of manual data collection, reconciliation, and formatting are generated in minutes from the centralised dashboard.
Conclusion
Multi-plant analytics standardisation is not a technology project. It is a data governance and process standardisation initiative that determines whether a corporate analytics team spends its time reconciling definitions or analysing performance. The technology — a common data dictionary, a unified equipment hierarchy, centralised reporting, and cross-plant benchmarking — enables the governance framework to operate at scale, but the value comes from the shift in how the corporate team spends its time and attention.
FMCG corporations that have implemented a common analytics framework across their plant portfolios report consistent outcomes: 60 to 70 percent of analytics team effort redirected from data reconciliation to improvement analysis, 80 to 90 percent reduction in cross-plant report generation time, 15 to 25 percent performance improvement in bottom-quartile plants through systematic best-practice transfer, and a corporate analytics capability that scales with acquisition — new plants are onboarded to the common framework in weeks rather than months.
iFactory's Multi-Plant Portfolio Management platform is built for FMCG corporate analytics teams who need standardised, comparable, auditable analytics across all plants — without requiring each plant to abandon its existing systems or retrain its team. Book a Demo to see the common analytics framework configured for your plant portfolio and corporate reporting requirements, or talk to an expert about a free analytics standardisation assessment that quantifies the reconciliation effort in your current multi-plant reporting process and the productivity recovery opportunity from a common analytics framework.
Frequently Asked Questions
Your Plants Are Not Incomparable. Your Analytics Framework Just Hasn't Been Standardised Yet. Get a Free Analytics Standardisation Assessment.
iFactory's Multi-Plant Portfolio Management platform for FMCG corporations common data dictionary, unified equipment hierarchy, centralised cross-plant reporting, and automated benchmarking eliminating the 60 to 70 percent of analytics effort consumed by data reconciliation and enabling true cross-plant comparison and best-practice transfer at corporate scale.