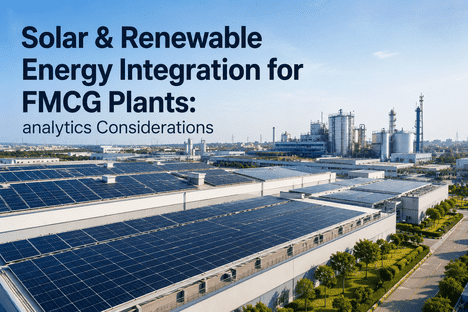
Solar & Renewable Energy Integration for FMCG Plants analytics Considerations
By Seren on June 11, 2026
The transition to 100% renewable electricity is no longer a long-term aspiration for FMCG manufacturers it is a near-term operational requirement driven by RE100 commitments, SBTi targets, retailer supplier scorecards, and the economic reality that solar photovoltaic (PV) levelized cost of energy has fallen 85% since 2010 and now undercuts grid electricity prices in most major manufacturing regions. A typical FMCG facility with 50,000 to 200,000 square metres of roof and parking area has the physical capacity to host 2 to 10 MW of rooftop solar PV, generating 2,500 to 14,000 MWh per year depending on insolation representing 15 to 40% of the facility's total electricity consumption. The analytics challenge that determines whether this investment delivers the expected return is not the solar generation technology, which is mature and well understood. It is the operational integration: scheduling PV panel cleaning without disrupting production, timing battery storage charge-discharge cycles to match facility load profiles, coordinating maintenance of solar assets with existing equipment PM programs, and tracking real-time generation versus consumption to validate the financial and carbon reduction returns that justified the investment. iFactory's Asset Management and Energy Monitoring modules enable FMCG plant managers to deploy comprehensive solar and renewable energy analytics without replacing existing CMMS, SCADA, or utility metering infrastructure. Book a Demo to see how iFactory connects solar generation data to production load, battery storage optimization, and maintenance scheduling across your FMCG facility network.
Solar PV · Battery Storage · Panel Cleaning · Energy Monitoring · Asset Management
Solar & Renewable Energy Integration for FMCG Plants: The Analytics that Turn Solar Panels Into a Managed Production Asset
Real-time solar generation monitoring, robotic cleaning PM scheduling, battery storage optimization, grid export-import analytics, and maintenance integration all connected to your production load profile for maximum self-consumption and carbon reduction verification.
Typical rooftop solar capacity for a mid-size FMCG facility generating 15-40% of total plant electricity from available roof and parking area
5-15%
Annual energy yield loss from uncleaned solar panels in industrial environments soiling from dust, bird droppings, and process emissions reduces generation that analytics-driven cleaning schedules recover
15-30%
Additional self-consumption achieved when battery storage is optimized against facility load profile storing excess generation for night-shift and non-solar hours rather than exporting at low feed-in tariffs
3-6 yr
Payback period for solar PV on FMCG facilities, compressed by 6-12 months when analytics-driven cleaning, storage optimization, and maintenance reduce downtime and maximize yield
Why Solar Integration in FMCG Plants Requires an Analytics Platform Not Just Panels and Inverters
Solar PV systems for FMCG facilities are typically installed by EPC contractors who commission the system, hand over the monitoring portal, and move to the next project. The monitoring portal provides generation data in 15-minute intervals, system status alerts, and basic performance ratio calculations. What it does not provide is connection to the production load profile, coordination with the facility's maintenance schedule, integration with battery storage controls, or verification of the carbon reduction that the business case promised. These gaps are the difference between a solar installation that generates electricity and a solar installation that operates as a managed production asset and they are the gaps that an analytics platform must fill.
The analytics considerations for solar and renewable energy integration in FMCG plants span four domains: generation optimization (keeping the panels clean and the inverters operational), load matching (aligning generation with facility consumption to maximize self-consumption and minimize grid export), storage coordination (optimizing battery charge-discharge cycles against time-of-use tariffs and load profiles), and carbon verification (tracking renewable energy generation against RE100 targets and SBTi commitments with auditable data). Each domain requires data from systems that are traditionally siloed — the solar monitoring portal, the facility SCADA and BMS, the utility meter, the battery management system, and the CMMS — and each domain produces data that loses value if it is not correlated with the others.
The Four Analytics Domains That Define Solar Integration ROI in FMCG Facilities
Domain 1
Generation Optimization & Soiling Management
Solar panels in FMCG environments lose 5-15% of annual yield to soiling — dust from raw material handling, cooking oil aerosols, flour and sugar dust, bird activity around loading docks. Analytics-driven cleaning schedules triggered by generation deviation from irradiance-modeled baseline recover 80-90% of soiling loss while reducing cleaning cost by matching frequency to actual soiling rate rather than calendar-based schedules. Robotic cleaning systems add autonomous operation without production disruption.
Soiling ratio tracking vs irradiance baseline
Condition-based cleaning PM scheduling
Robotic cleaning system integration & tracking
Domain 2
Load Matching & Self-Consumption Optimization
The economic value of solar generation depends on what percentage is self-consumed versus exported to the grid. Export tariffs are typically 30-70% below retail electricity rates, making every kWh consumed on-site worth 2-3 times more than a kWh exported. Analytics-driven load matching schedules production activities — CIP cycles, cooling tower operation, compressed air charging — to coincide with peak solar hours, shifting discretionary loads from night to day without affecting production throughput.
Battery storage increases solar self-consumption from 30-50% to 75-90% by capturing excess generation during peak solar hours and discharging during evening production, night-shift operation, and peak tariff periods. The optimization algorithm must balance battery state-of-charge, forecast solar generation, facility load profile, time-of-use tariff structure, and battery degradation cost to determine the optimal charge-discharge schedule for each 24-hour period.
Battery SOC optimization against load and tariffs
Cycle life vs savings optimization
Peak demand shaving coordination
Domain 4
Carbon Verification & RE100 Reporting
Every MWh of solar generation must be documented with auditable data for RE100 reporting, SBTi progress tracking, CDP disclosure, and retailer sustainability scorecards. The analytics platform must track renewable electricity generation and consumption in 15-minute intervals, apply the correct market-based and location-based emission factors, and generate reports in the format required by each framework — with full data lineage from inverter meter to disclosure number.
RE100-compliant renewable tracking
Verified carbon reduction documentation
Audit-ready data lineage from meter to report
Robotic Panel Cleaning & Condition-Based PM: The Biggest Operational Lever for Solar Yield
The single largest operational factor that determines whether a solar PV system delivers its projected yield — beyond the irradiance that the site receives — is the cleanliness of the panel surface. Soiling losses in FMCG facilities are significantly higher than the industry average for commercial and industrial solar installations because of the specific contamination environment. A beverage plant with sugar-handling operations generates fine sugar dust that bonds to panel surfaces when combined with morning dew, forming a translucent film that reduces transmission by 8-15%. A food processing facility with cooking oil aerosols creates a sticky particulate layer that traps additional dust and requires detergent-assisted cleaning rather than water-only washing. A personal care or chemical products plant may have process emissions that deposit reactive residues on glass surfaces, requiring specialized cleaning protocols.
S
Soiling Ratio Monitoring
Real-time generation deviation from irradiance-modeled baseline
The soiling ratio — actual generation divided by expected generation based on on-site pyranometer or satellite irradiance data, adjusted for temperature and inverter efficiency — is the key performance indicator for cleaning decisions. A soiling ratio above 0.95 indicates acceptable panel condition. Between 0.90 and 0.95, the cumulative revenue loss from soiling is approaching the cost of a cleaning cycle. Below 0.90, the panel is losing more revenue per day than the cleaning cost per panel. iFactory's Energy Monitoring module tracks soiling ratio per inverter string or per monitoring point, correlating generation data with irradiance and temperature to isolate soiling losses from cloud cover, inverter downtime, or temperature-related efficiency reduction. When the soiling ratio crosses the configured threshold, the system generates a cleaning work order in the connected CMMS and assigns it to the cleaning crew or robotic cleaning system.
R
Robotic Cleaning Integration
Autonomous cleaning triggered by soiling ratio without production disruption
Autonomous robotic panel cleaning systems — which traverse solar arrays using dry-brush, water-wipe, or combined cleaning mechanisms — eliminate the labour cost, safety exposure, and production disruption of manual panel cleaning. iFactory's Asset Management module integrates with robotic cleaning systems from major manufacturers through API or MQTT, tracking cleaning cycles completed, water consumption per cleaning cycle (for water-based systems), and cleaning quality metrics. The condition-based cleaning schedule — triggered by soiling ratio threshold rather than calendar interval — ensures that panels are cleaned only when the soiling loss justifies the cleaning cost and the robotic system operating hours. For facilities without robotic cleaning, the work order generation for manual cleaning follows the same condition-based logic, and the platform tracks cleaning completion and post-cleaning soiling ratio recovery to validate cleaning effectiveness and adjust cleaning frequency for each contamination zone.
P
Solar PM Scheduling
Preventive maintenance for solar assets integrated with facility-wide CMMS
Solar PV systems require preventive maintenance on inverters (capacitor replacement at manufacturer-specified intervals, cooling fan cleaning, thermal imaging of power electronics), transformers (oil analysis, bushing inspection, cooling system maintenance), tracking systems (greasing, limit switch testing, actuator calibration), and electrical infrastructure (combiner box cleaning, torque checks, insulation resistance testing). These PM tasks are traditionally managed in the solar monitoring portal or in spreadsheets, disconnected from the facility's main CMMS and the maintenance team's weekly schedule. iFactory's Asset Management module brings solar assets into the same CMMS as production equipment — with PM schedules, task lists, spare parts inventories, and technician assignments managed alongside the facility's existing maintenance programs. This integration ensures that solar PM tasks are scheduled during production hours when the maintenance team is on-site rather than requiring separate call-outs, and that spare parts for solar inverters and transformers are stocked in the same system as production equipment spares.
D
Degradation & Performance Trending
Long-term panel degradation tracking against manufacturer warranty curve
Solar PV modules degrade at 0.3-0.8% per year depending on panel technology, installation quality, and environmental conditions. Manufacturers warrant that panels will produce at least 80-90% of rated power after 25 years, but actual degradation rates vary significantly between batches and installations. iFactory's Energy Monitoring module tracks annual degradation rate per inverter string by comparing generation data normalized to standard test conditions, alerting the facility manager if any string's degradation rate exceeds the warranty curve. For facilities with performance guarantees under power purchase agreements or solar service contracts, this degradation tracking provides the documented evidence needed to enforce warranty claims if panel performance falls below guaranteed levels — a claim that typically recovers 5-15% of annual generation value for affected strings.
Your Solar Panels Are Losing 5-15% of Generation to Dust Right Now. Condition-Based Cleaning Recovers 80-90% of That Loss Without a Single Manual Intervention.
iFactory's solar analytics module connects to your existing solar monitoring portal, irradiance sensor, and robotic cleaning system — triggering cleaning work orders based on real-time soiling ratio rather than calendar intervals and tracking every cleaning cycle's generation recovery in kWh and revenue.
Battery Storage Analytics: Optimizing Every Charge-Discharge Cycle Against Load, Tariffs, and Battery Life
Battery energy storage is the most impactful investment an FMCG facility can make to increase the return from its solar PV system — raising self-consumption from 30-50% of generation to 75-90% by capturing excess solar generation during peak daylight hours and discharging during evening production, night-shift operation, and peak tariff periods. The analytics that determine whether the battery investment pays back in 4 years or 7 years is the charge-discharge optimization algorithm that decides, for every 15-minute interval, whether to charge the battery (store excess solar for later use), discharge the battery (offset grid consumption at high tariff rates or during demand peaks), or idle (let solar generation flow directly to facility load or export to grid).
The optimization challenge is that the optimal decision at any moment depends on four variables with different time horizons: the current battery state of charge, the forecast solar generation for the next 2-12 hours (based on weather forecast and historical irradiance patterns for the current season), the facility's load forecast for the next 2-12 hours (based on production schedule, day of week, and seasonal load patterns), and the time-of-use tariff structure with peak, shoulder, and off-peak periods. Book a Demo to see iFactory's battery storage optimization engine applied to your facility's load profile, solar generation pattern, and tariff structure.
Determines how much energy the battery can expect to receive for charging over the next 2-12 hours. A cloudy forecast triggers earlier discharge and more conservative charging to ensure the battery is available for evening peak
Facility Load Forecast
Production schedule from MES, historical load patterns, day-of-week model
Determines when the facility will need the stored energy. A production day with a night shift requires evening and overnight discharge capacity. A weekend with minimal load may optimize for grid services revenue
Determines the financial value of discharging at each hour. Discharging during a $15/kW peak demand period is worth 3-5x more than discharging during a $0.08/kWh off-peak period
Battery Degradation Cost
Manufacturer cycle life curve, depth-of-discharge model, temperature data
Every charge-discharge cycle consumes a fraction of the battery's total cycle life (typically 6,000-10,000 cycles to 80% capacity retention). The optimization algorithm balances cycle value against cycle cost in $ per kWh throughput
Grid Integration & Renewable Energy Tracking: From Inverter Meter to RE100 Report
The final analytics domain for solar and renewable energy integration is the connection between the inverter meter that measures generation and the regulatory and corporate reports that document renewable electricity consumption for RE100, SBTi, CDP, and retailer sustainability reporting. The analytics platform must track, for every 15-minute interval of the year, how much electricity was generated by the solar PV system, how much was consumed on-site versus exported to the grid, how much was stored in the battery and later discharged, and what percentage of total facility electricity consumption was supplied by on-site renewable generation.
RE100 Compliance Tracking
On-site generation metered at inverter level in 15-minute intervals with full audit trail
Self-consumption vs grid export tracking with hourly resolution for matching load profiles
Automatic RE100 annual report generation with auditable renewable electricity attribution
Energy attribute certificate (EAC) tracking and retirement documentation for unbundled RECs or GOs
Carbon Reduction Verification
Scope 2 emissions reduction calculated from metered generation using location-based and market-based factors
SBTi progress tracking with renewable electricity share of total consumption reported annually
CDP climate questionnaire sections C8 and C9 populated automatically from generation and load data
Verified carbon reduction audit trail with data lineage from meter reading to disclosure number
We installed 4.2 MW of rooftop solar across our beverage plant with a battery storage system sized at 2 MW / 4 MWh. The first year of operation showed a self-consumption rate of 38% — the battery was charging and discharging on a fixed schedule that did not match our production load profile, and the panels were losing an estimated 8% of generation to soiling because the cleaning schedule was monthly regardless of contamination level. After deploying iFactory's solar analytics module with load-matched battery optimization and condition-based cleaning, our self-consumption rate increased to 82%, soiling losses dropped to under 2%, and the solar-plus-storage system's ROI compressed from a projected 5.8 years to 3.4 years. The battery optimization algorithm alone recovered $42,000 per year by shifting discharge to our peak tariff periods and avoiding unnecessary cycling during low-value hours.
— Director of Engineering, Multi-national Beverage Manufacturer, 4.2 MW Solar, 2 MW / 4 MWh Battery
Deployment: Read-Only Integration with Solar Monitoring, Battery BMS, and Facility SCADA
iFactory's solar and renewable energy analytics module deploys as a read-only analytics layer above your existing solar monitoring platform, battery management system, and facility SCADA infrastructure. No control logic modifications are required to the solar inverters, battery BMS, or facility PLCs. iFactory reads generation data from the solar monitoring platform (or directly from inverter meters via Modbus), battery state-of-charge from the BMS (via Modbus or API), and facility load data from the utility meter or SCADA (via Modbus, OPC-UA, or utility API). The analytics outputs — soiling ratio alerts, cleaning work orders, battery optimization recommendations, and renewable energy reports — are generated from the combined data stream without writing to any operational system unless closed-loop setpoint control has been explicitly enabled.
Week 1-2
Solar & Battery Data Integration
Read-only connections to solar monitoring platform, inverter meters, battery BMS, and facility SCADA or utility meter. Data validation and baseline establishment. No system modifications.
Week 2-4
Soiling Baseline & Optimization Calibration
Soiling threshold configured per facility contamination zone. Battery optimization algorithm calibrated against tariff structure and load profile. Renewable energy reporting templates configured. Validation against historical data.
Week 4-6
Parallel Mode Operation
Solar analytics run in parallel with existing monitoring. Soiling alerts and cleaning recommendations compared against current cleaning schedule. Battery optimization recommendations validated against actual performance. Zero operational risk.
Week 6-8
Live With Full Analytics
Condition-based cleaning PM live. Battery optimization active. Renewable energy tracking and RE100 reporting operational. Solar asset management integrated with facility-wide CMMS. Solar yield monitoring with degradation tracking.
Frequently Asked Questions
No. The platform connects to solar monitoring platforms and inverter meters through standard industrial communication protocols — Modbus RTU/TCP (the universal protocol supported by every major inverter manufacturer including SMA, ABB, Fronius, SolarEdge, Huawei, Sungrow, and Delta), OPC-UA, REST API (for monitoring platforms such as AlsoEnergy, Draker, GPM, and Locus), or direct connection to the facility's SCADA or BMS where solar data is already aggregated. In facilities where the solar monitoring portal provides CSV export, the platform supports automated file ingestion. For facilities with no existing monitoring, iFactory can recommend cost-effective inverter-level monitoring hardware that connects to the platform through standard protocols from day one. The integration is data consumption only — no write access to inverters, monitoring platforms, or facility control systems unless closed-loop control has been explicitly configured and safety-approved.
The soiling ratio calculation requires an irradiance baseline to separate soiling losses from weather-related generation variation. iFactory's platform supports two approaches depending on the facility's instrumentation. For facilities with an on-site pyranometer (preferred), the expected generation is computed from the measured plane-of-array irradiance using the PV module efficiency, temperature coefficient, inverter efficiency, and system design parameters — providing a site-specific expected generation value that accounts for cloud cover, seasonal sun angle, and atmospheric conditions in real time. For facilities without a pyranometer, the platform uses satellite-derived irradiance data from Solcast or NREL's NSRDB, which provides 10-30 minute resolution irradiance estimates at approximately 2-4 km grid spacing. Temperature effects on module efficiency are accounted for using module temperature sensors (where available) or ambient temperature data from on-site weather stations or local meteorological data, applying the manufacturer's temperature coefficient for power. The soiling ratio is averaged over a rolling 3-day window to smooth transient cloud effects, and cleaning alerts are triggered only when the soiling ratio has been below threshold for a minimum of 2 consecutive days — preventing false triggers from single overcast days. Talk to an expert about soiling ratio methodology for your specific facility's instrument configuration.
Yes — the battery storage optimization engine operates on facility load profile, tariff structure, and grid carbon intensity signals independently of whether the facility has on-site solar generation. For facilities with battery storage but no solar PV, the optimization algorithm focuses on peak demand shaving (discharging the battery during the facility's highest 15-minute demand periods to reduce demand charges, which typically account for 30-60% of commercial electricity bills), tariff arbitrage (charging during off-peak periods when electricity is cheapest and discharging during peak periods when it is most expensive), and grid services revenue (participating in demand response programs or frequency regulation markets where available). For facilities planning to add solar in a future phase, the platform's battery optimization model is designed to incorporate solar generation data seamlessly when the PV system is commissioned — the battery control algorithm simply adds the solar forecast as an additional input to the charge-discharge optimization without requiring reconfiguration. Book a Demo to see iFactory's battery storage optimization applied to a facility without on-site generation.
iFactory's Asset Management module serves as the unified CMMS for solar assets and production equipment, or it integrates with an existing enterprise CMMS through API, CSV export, or direct database connection. For facilities using iFactory as their CMMS, solar assets are added to the asset hierarchy alongside production equipment, with PM schedules, task lists, spare parts, and technician assignments managed in the same system. Solar PM tasks — inverter capacitor replacement, cleaning fan maintenance, transformer oil analysis, combiner box torque checks, thermal imaging inspections — are scheduled using the same PM calendar and trigger logic as production equipment PM tasks, ensuring that solar maintenance is coordinated with production maintenance schedules rather than managed separately. For facilities with an existing enterprise CMMS — SAP PM, Maximo, Infor, or similar — iFactory generates PM work orders in the connected CMMS through standard API or file-based integration, with solar asset data, task instructions, and spare part requirements populated in the work order fields that the existing maintenance team uses. The Shift Logbook captures solar PM completion records, cleaning cycle data, and inverter-level generation recovery post-maintenance for continuous improvement tracking. Talk to an expert about CMMS integration for your facility's solar asset management requirements.
Facilities deploying iFactory's solar analytics module to an existing solar PV installation typically see ROI improvement across three measurable dimensions within the first 6 months of operation. First, soiling loss recovery: condition-based cleaning triggered by soiling ratio rather than calendar intervals typically recovers 4-10% of annual generation that was being lost to uncleaned panels, representing $8,000-$40,000 per year for a 2-5 MW installation. Second, self-consumption optimization: battery storage optimization against the facility's actual load profile and tariff structure increases self-consumption by 15-30 percentage points, increasing the effective value of generated electricity by $15,000-$60,000 per year depending on the differential between retail electricity rates and feed-in tariffs. Third, maintenance cost optimization: integrated solar PM scheduling with the facility's existing CMMS reduces solar maintenance call-out costs by 25-40% by coordinating solar PM with production maintenance visits rather than requiring separate mobilizations. The combined improvement typically recovers the analytics platform investment within 6-12 months and compresses the overall solar-plus-storage system payback by 6-18 months. Book a Demo to see a modelled ROI estimate for your specific solar installation configuration.
Your Solar Investment Is Generating Electricity. With the Right Analytics, It Can Generate 15-30% More Value Without a Single Additional Panel.
iFactory's solar analytics module connects to your existing solar monitoring platform, battery BMS, and facility SCADA — delivering condition-based cleaning, load-matched battery optimization, integrated CMMS for solar assets, and RE100-compliant renewable energy tracking in 6-8 weeks. Read-only integration. No control logic changes. Immediate ROI from recovered generation, increased self-consumption, and optimized maintenance.