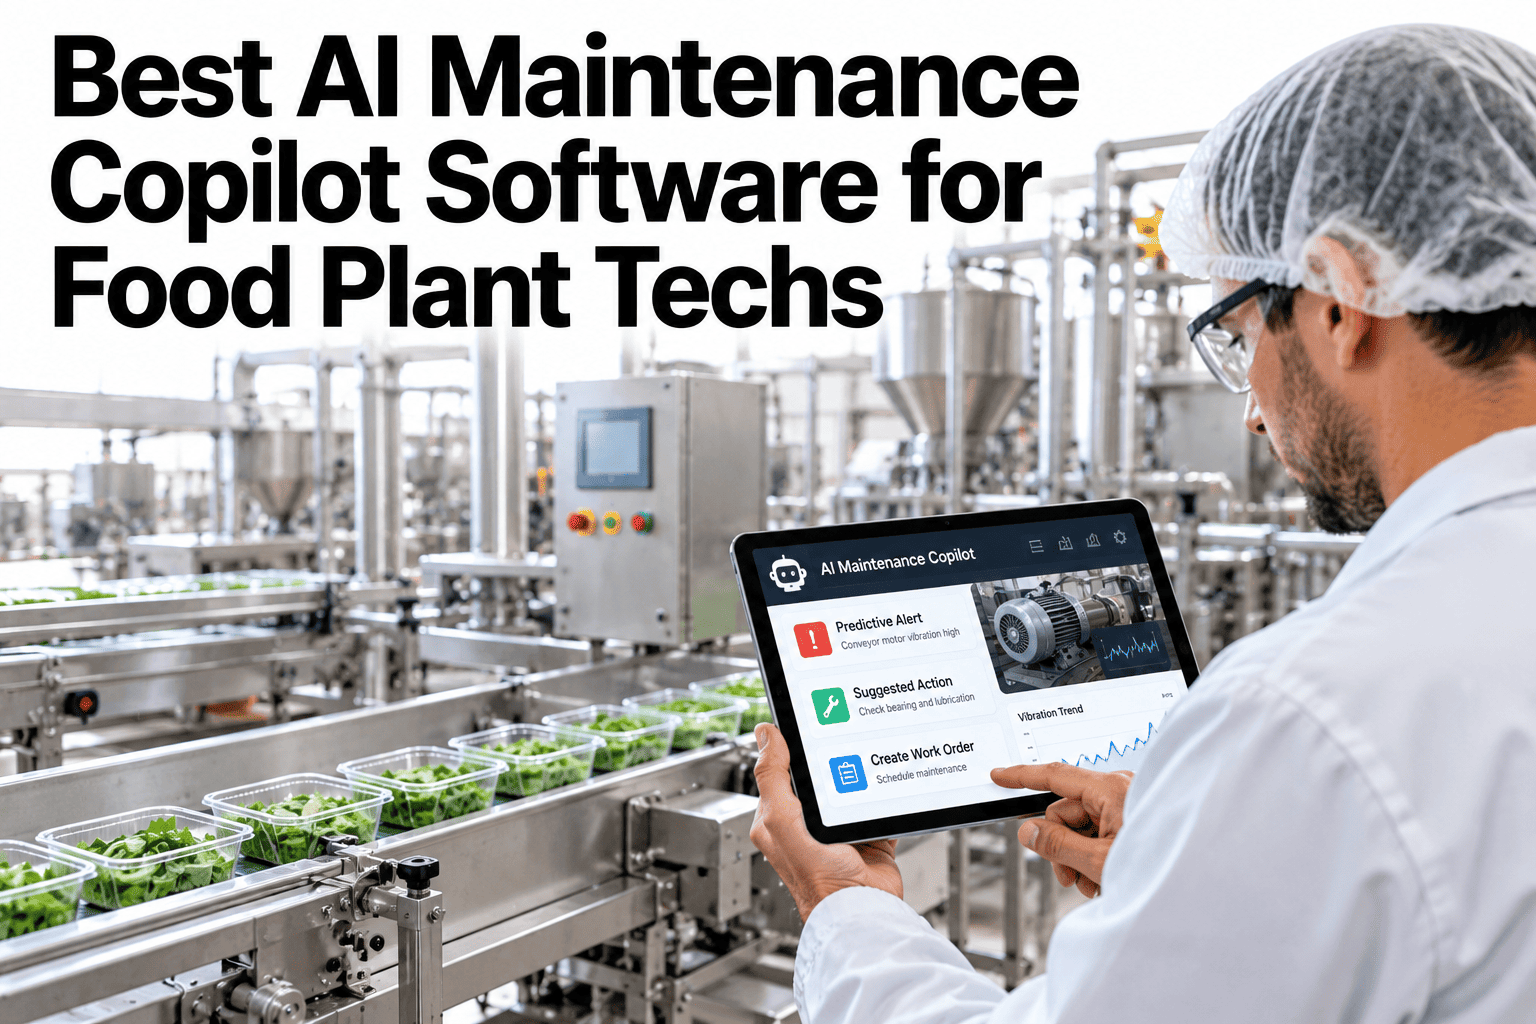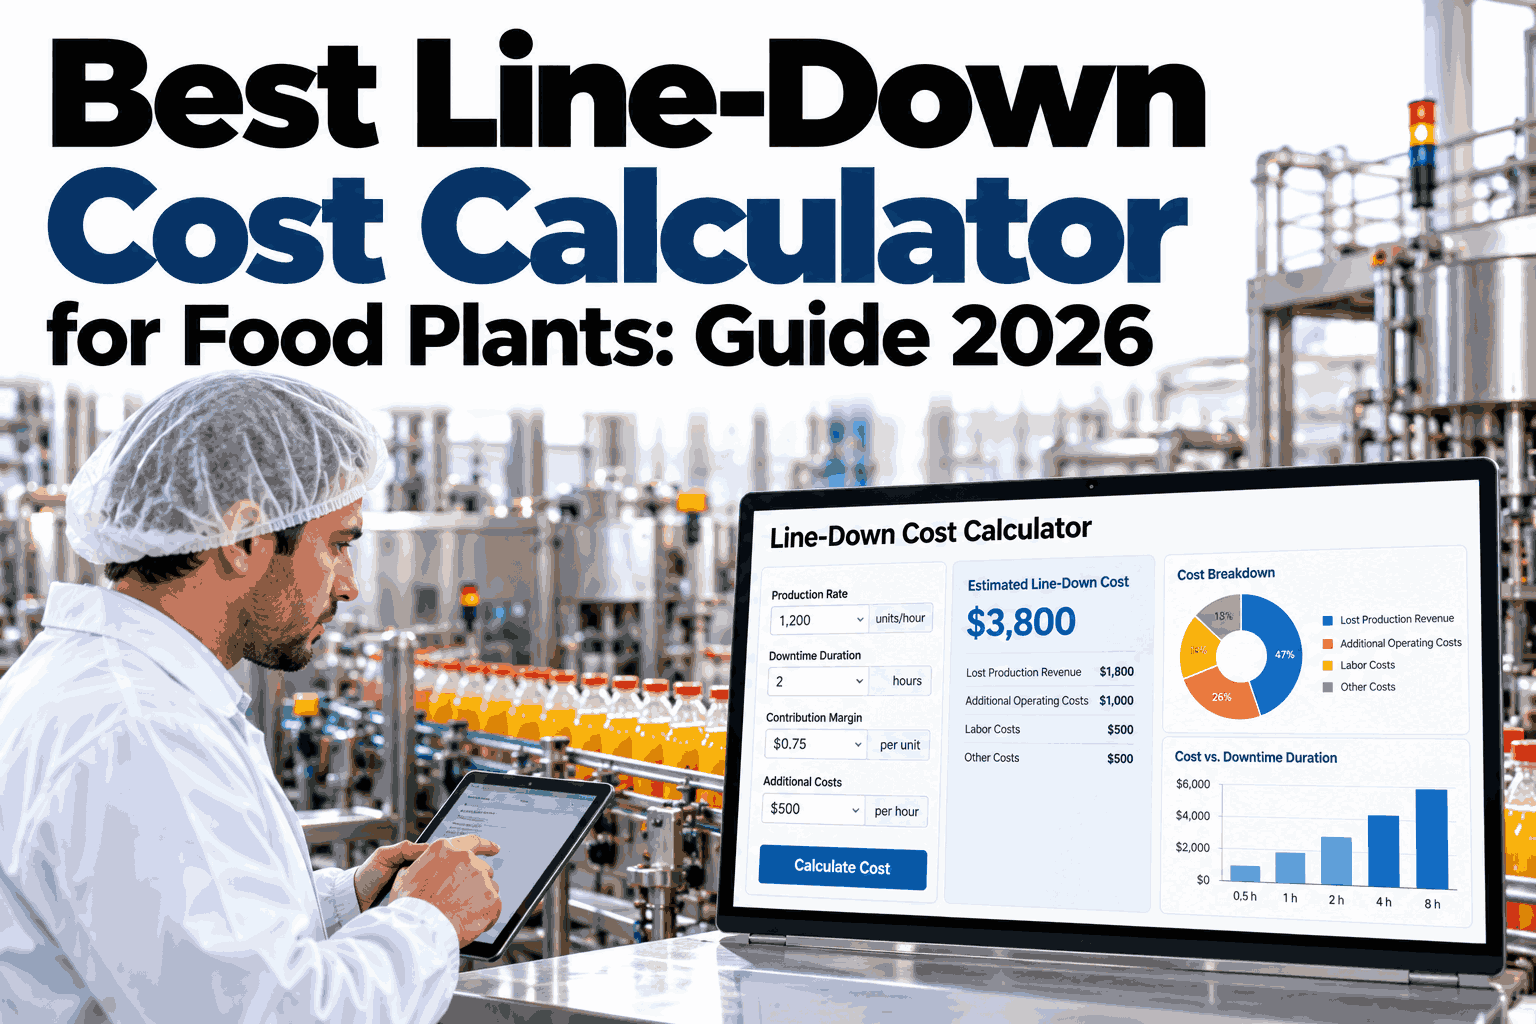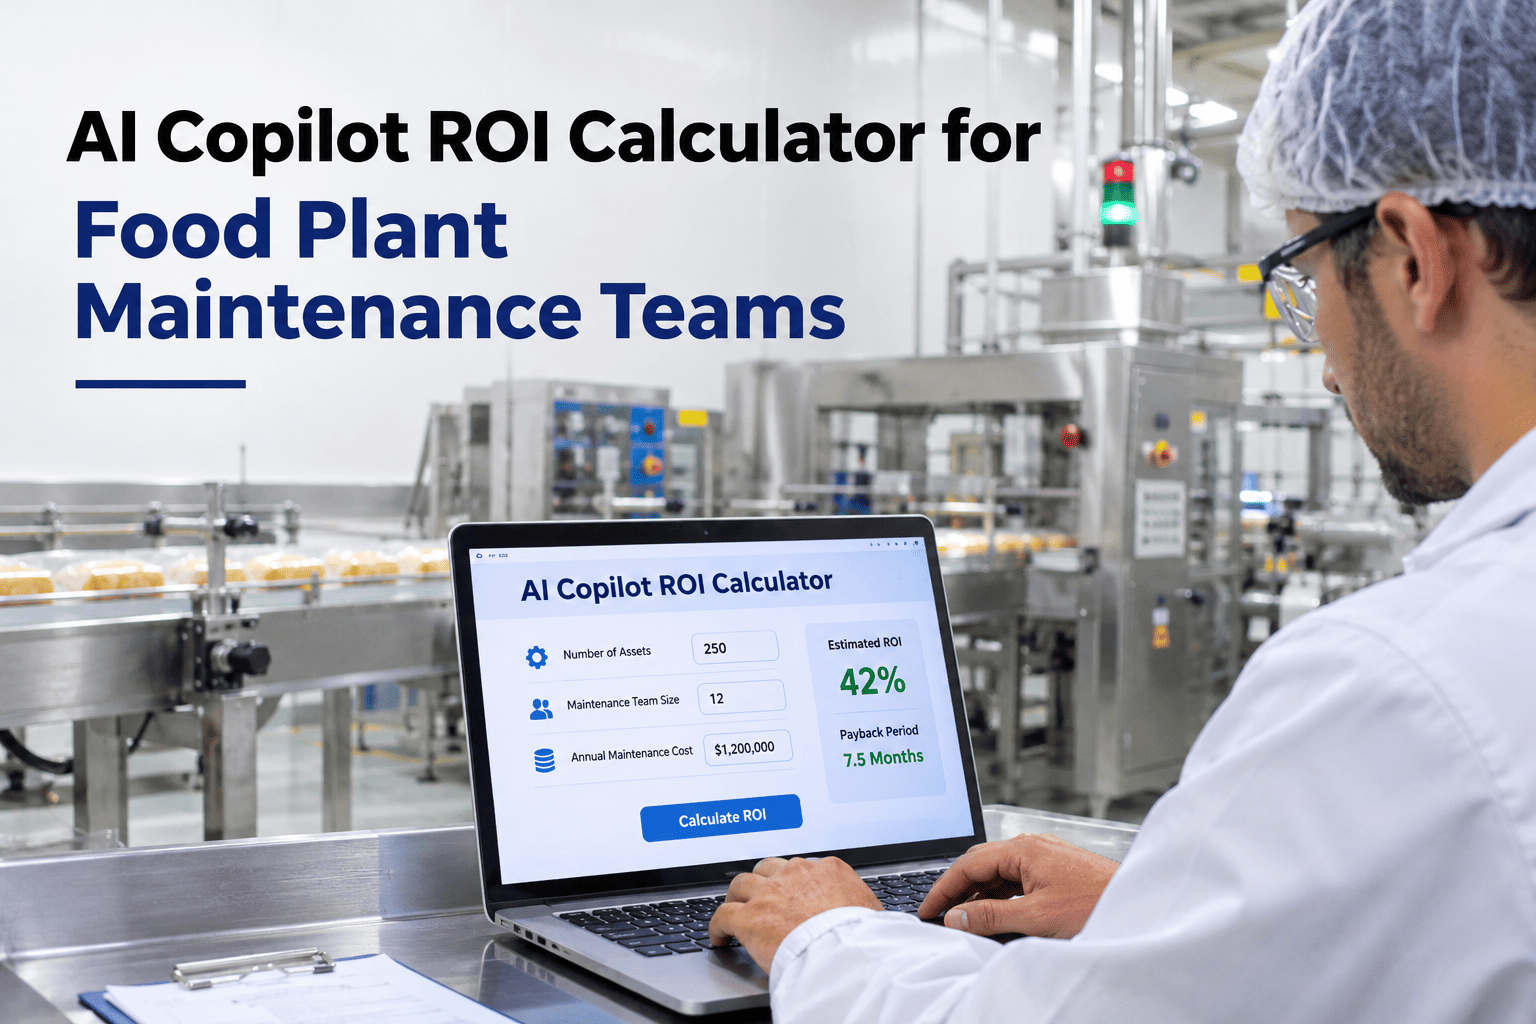
A food plant maintenance manager who wants to deploy an AI copilot has two conversations to win: the team on the floor, and the finance director who controls the capital budget. The floor conversation is about whether the tool will actually help — which a demonstration answers. The finance conversation is about whether the return justifies the investment — which only a credible number answers. "AI will improve efficiency" is not a number. The right inputs are wrench time recovered per technician, MTTR reduction on the three highest-downtime assets, new hire ramp cost saved per cohort, and knowledge retention value when a senior technician retires. Put those against the subscription and deployment cost and a payback period emerges that the finance director can evaluate. iFactory AI, an on-premise AI platform for food manufacturing, provides a structured ROI framework so maintenance managers can build that case with their own data before the budget conversation. Teams that want to model their specific numbers can run the ROI framework with iFactory AI's food plant team.
Model Your AI Copilot Return: Wrench Time, MTTR, New Hire Ramp, and Knowledge Retention
iFactory AI's food plant ROI framework quantifies the four addressable value streams of an AI maintenance copilot — in your own maintenance cost numbers, not industry averages.
Why Standard AI ROI Calculations Miss the Real Value in Food Manufacturing
Most AI ROI frameworks focus on a single value stream — downtime reduction or productivity gain — and apply an industry average improvement percentage. Food plant maintenance has four distinct value streams, each with different measurement approaches and different time horizons. Missing any one of them produces an ROI model that undervalues the investment and fails to persuade a finance director who knows the food plant cost structure.
Value Stream 1: Wrench Time Recovery
Wrench time is the percentage of a technician's shift spent on actual maintenance work, as opposed to administrative tasks — looking up work orders, finding SOPs, searching for parts, documenting close-outs, and waiting for information. Industry benchmarks put food plant technician wrench time at 25–35% without digital tools (Plant Engineering, 2026). An AI copilot that provides instant SOP lookup, parts identification, and guided close-out documentation can recover 60–90 minutes per technician per shift in productive maintenance time.
Not all recovered time translates to direct cost savings — some becomes additional maintenance capacity, reducing deferred PM backlogs. The value is real but should be modelled as capacity gain rather than headcount reduction. Teams that want to model this accurately can ask iFactory AI's team for the wrench time input template.
Value Stream 2: MTTR Reduction on High-Downtime Assets
Mean time to repair (MTTR) in a food plant is dominated by two delays: time to diagnose the fault (finding relevant history, calling an expert, checking manuals) and time to find the right parts. An AI copilot addresses both. Diagnosis time falls when the copilot immediately retrieves relevant work order history and suggests the most likely root cause. Parts time falls when the copilot identifies the component and returns stock location in seconds.
| MTTR component | Typical time without AI | With AI copilot | Reduction |
|---|---|---|---|
| Fault diagnosis (history lookup) | 20–45 minutes | 2–5 minutes | 80–90% |
| SOP retrieval and reading | 10–20 minutes | Guided inline — 2 min | 80–90% |
| Parts identification and location | 15–30 minutes | Under 2 minutes | 85–95% |
| Senior technician call-out wait | 30–90 minutes (night shift) | Eliminated for known faults | 60–80% of call-outs avoided |
| Work order close-out documentation | 10–20 minutes | 3–5 minutes (guided prompts) | 65–75% |
For a food plant with 15 unplanned failures per month on critical assets, each with an average MTTR of 90 minutes and a production value of £1,200/hour, reducing MTTR by 35% saves approximately £9,450/month in production loss — before any maintenance labour savings are counted. Model your plant's MTTR reduction value in a 30-minute session with iFactory AI.
Build the ROI Case Your Finance Director Will Approve
iFactory AI's food plant team will run the full ROI model using your actual technician counts, MTTR data, new hire costs, and production value — producing a phased payback projection you can present in a budget meeting.
Value Stream 3: New Hire Ramp Cost Reduction
The cost of onboarding a new maintenance technician in a food plant is rarely calculated fully. It includes recruitment, orientation, training materials, senior technician shadow time, and the productivity delta — the gap between what the new hire produces and what a fully competent technician produces — during the ramp period. Studies of manufacturing maintenance onboarding put the total cost at 1.5–2.5× the new hire's annual salary before they reach full competency (SHRM, 2026).
The AI copilot primarily reduces the two largest components: senior shadow hours (40–60% reduction) and productivity delta (ramp time shortened by 6–12 weeks). For a food plant that onboards four technicians per year at an all-in ramp cost of £18,000 per hire, the copilot's impact on onboarding cost alone can represent £20,000–£35,000 in annual savings.
Value Stream 4: Knowledge Retention Value
Knowledge retention is the least tangible but potentially highest-value stream in food plant AI ROI. A senior maintenance technician with 15 years of food plant experience carries irreplaceable knowledge: which machines have seasonal failure patterns, which SOPs were written without understanding the actual process, which suppliers are reliable, and which fault codes on the filler mean something different from what the manual says.
Building the Full ROI Model: Inputs and Payback Structure
The table below shows the input set for a food plant AI copilot ROI model and the typical ranges for a mid-size food processing plant. Teams should use their own data — these are reference ranges only.
| ROI input | How to find your number | Reference range |
|---|---|---|
| Technicians on maintenance team | Headcount report | 8–25 for mid-size food plant |
| Average all-in hourly cost per technician | Payroll / HR | £28–£45/hour (UK food plant) |
| Unplanned failures per month (critical assets) | CMMS downtime report | 10–25 events/month |
| Average MTTR on unplanned failures | CMMS work order average | 60–150 minutes |
| Production value per hour (critical line) | Finance / production manager | £800–£3,000/hour |
| New hires per year | HR turnover data | 2–6 per year (20%+ turnover rate) |
| Senior technicians at retirement risk (3 years) | HR / age profile | 1–4 for mid-size team |
Frequently Asked Questions
What is a realistic payback period for a food plant AI copilot?
Payback period depends on the magnitude of the addressable cost streams — primarily MTTR on high-value production lines and new hire onboarding cost. Food plants with high unplanned downtime on critical lines (£1,500+/hour production value) typically see payback within 6–9 months. Plants with lower downtime costs but high technician turnover typically see payback at 12–18 months through onboarding cost reduction. The knowledge retention value often converts a 12-month model to a 6-month model once a retirement event is included. Model your specific payback scenario with iFactory AI's food plant team.
How do we quantify the food safety risk avoidance value in the ROI model?
Food safety risk avoidance is modelled as a probability-weighted expected value: estimate the annual probability of an allergen, contamination, or recall event (typically 1–5% for a well-run food plant) and multiply by the average cost of such an event (typically £500,000–£3M for a recall, before brand damage). A 1% annual probability of a £1M event represents £10,000/year in expected cost — which an AI copilot that reduces this probability by 20–30% saves £2,000–£3,000/year in expected value. This is a conservative addition to the ROI model and is worth including even at low probabilities. Ask iFactory AI's team for the food safety risk avoidance input methodology.
Should we include headcount reduction in the AI copilot ROI model?
We recommend not including headcount reduction as a primary ROI input unless the plant genuinely intends to reduce headcount as a result of the deployment. Most food plants deploy the AI copilot to do more with the same team — reducing deferred PM backlog, improving first-time fix rate, and enabling newer technicians to take on more complex work. These capacity gains are real value but are better modelled as productivity improvement than headcount reduction, which is harder to defend to a finance director and rarely what happens in practice. Review how to model capacity gain vs headcount reduction in the ROI framework.
How do we account for the ramp-up period in the ROI model?
The ROI model uses a phased cash flow structure: Month 1–3 represents the deployment investment with minimal return as the knowledge base is built and the team learns the tool. Month 4–6 is the ramp period where MTTR reduction and wrench time gains begin to accumulate at 40–60% of full rate. Month 7+ represents full steady-state return. Payback period is calculated from the investment date against this phased cash flow — not from Month 1 at full rate. iFactory AI provides a deployment-validated ramp profile for food plants based on past deployment data. Ask for the deployment ramp profile used in food plant ROI modelling.
What data do we need to run the ROI model before speaking to iFactory AI?
The minimum data set for a useful ROI model is: total maintenance technician headcount and all-in hourly cost; number of unplanned failures per month on your three highest-criticality assets; average MTTR on those assets; production value per hour on the lines those assets serve; number of new hires per year; and number of senior technicians at retirement risk in the next 3 years. This data takes most maintenance managers less than an hour to pull from their CMMS and HR records. Everything else can be discussed in the session. Book an ROI modelling session once you have these inputs ready.
Turn Your Maintenance Cost Data Into an AI Investment Case
iFactory AI's food plant team builds a custom ROI model from your actual numbers — wrench time, MTTR, onboarding cost, and knowledge retention — with a phased payback projection ready for your budget meeting.