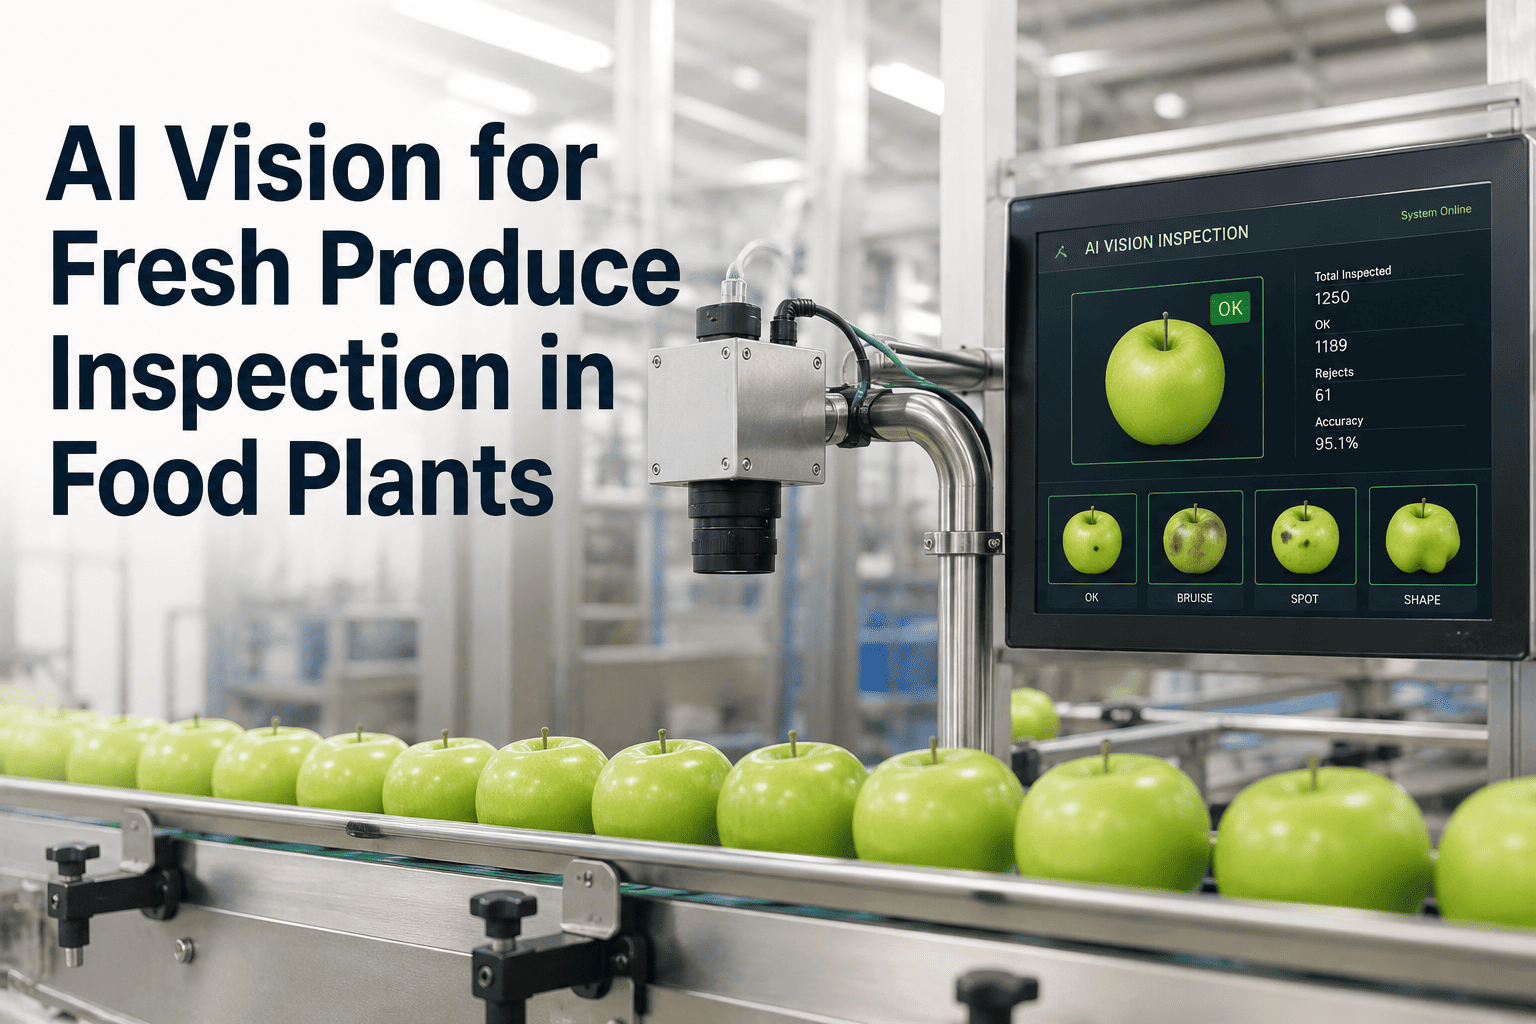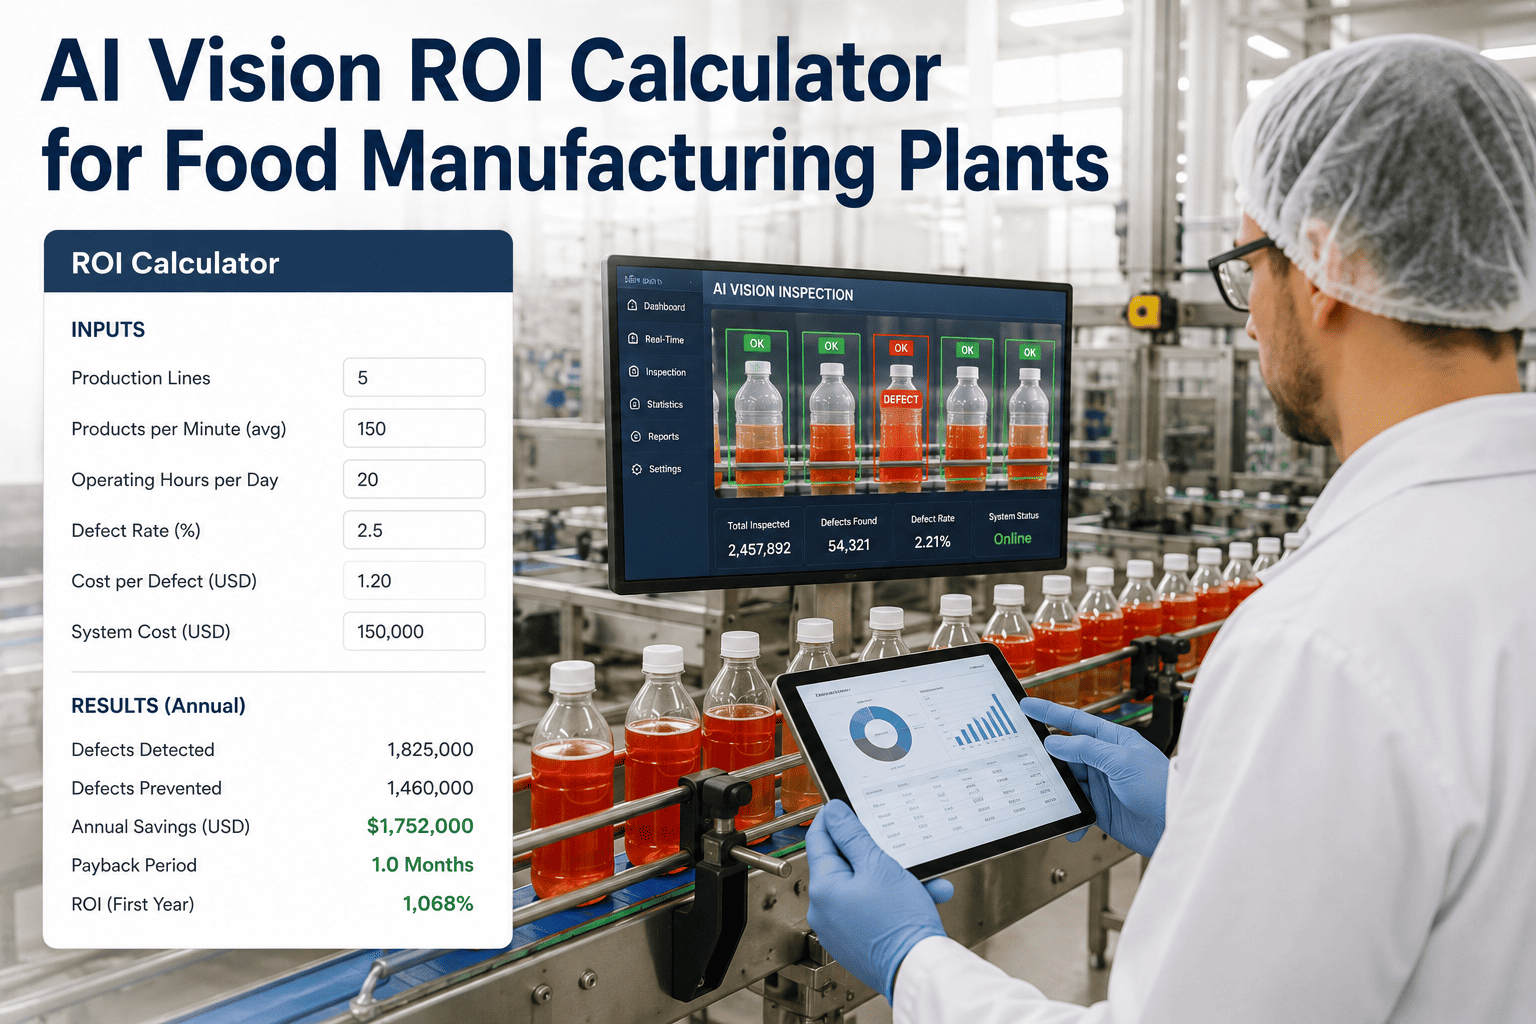
Every plant manager who has pitched an AI vision system to a CFO has heard the same question back: where exactly does the money come from? It's a fair question, because vision inspection doesn't show up on a balance sheet the way a new line or a new oven does — its value is hidden inside scrap rates, complaint logs, recall insurance premiums, and the hours line leads spend manually eyeballing product that a camera could check in milliseconds. Building a credible ROI case means pulling those numbers into one place before you ever ask for budget, and that's exactly what a working payback model does for you here. Book a demo and we'll build your specific payback number using your own plant's data.
ROI Modeling · Food Manufacturing 2026
The AI Vision ROI Calculator Built Specifically for Food Manufacturing Plants
Scrap saved, complaint volume reduced, and recall exposure eliminated — turned into a single payback timeline your finance team will actually approve, using inputs pulled straight from your current production numbers.
3 to 9 Months
Typical payback window reported by mid-size food plants after deploying line-level AI vision inspection
30 to 60%
Reduction in false rejects commonly seen when moving from fixed threshold sensors to trained vision models
Hours Per Shift
Manual visual inspection labor that gets reassigned to higher value tasks once cameras take over the repetitive checks
Where the Real Cost Hides
The Four Places Food Plants Lose Money Without AI Vision
01
Over-Rejection From Fixed Thresholds
Rule-based sensors set with wide safety margins throw away good product to avoid missing bad product, and that margin of error compounds into real scrap cost across a full production run.
02
Under-Detection That Reaches Customers
The inverse failure is worse — defects that slip past inspection become complaints, credits, and in the severe cases, product holds or recalls that cost far more than the inspection system ever would.
03
Labor Tied Up in Repetitive Checks
Skilled line staff spend hours per shift on visual checks that don't require human judgment, time that could go toward changeovers, troubleshooting, or the tasks that actually need a person's attention.
04
Delayed Root Cause on Recurring Defects
Without image data tied to timestamps, tracing a defect pattern back to a specific shift, machine, or ingredient lot can take days of manual investigation instead of minutes of pulling a log.
Get Your Own Numbers
iFactory Builds Your ROI Model From Your Actual Production Data
Instead of a generic industry benchmark, we pull your scrap rate, complaint history, and current inspection labor cost into a payback model specific to your lines, so the number you take to finance is one you can defend.
The Calculation, Broken Down
How the ROI Number Actually Gets Built
Step 1
Baseline Your Current Scrap and Rework Cost
Pull twelve months of scrap logs and rework hours by line, and convert that into a dollar figure per week — this is the number AI vision is competing against, not an industry average.
Step 2
Estimate the Detection Improvement
Compare your current detection method's known miss rate and false reject rate against a trained vision model's typical accuracy for your specific defect types, based on a short pilot run.
Step 3
Add Complaint and Recall Risk Reduction
Assign a conservative dollar value to fewer customer complaints and lower recall exposure, using your historical complaint cost per incident as the baseline rather than a worst-case estimate.
Step 4
Subtract Implementation and Ongoing Cost
Include hardware, integration labor, and any ongoing model tuning cost against the savings total to arrive at a net monthly benefit and a payback period measured in months, not years.
Manual vs. AI Vision Inspection
Cost Comparison Across a Typical Food Production Line
| Cost Category | Manual Inspection | AI Vision Inspection |
|---|---|---|
| Labor per shift | 2 to 4 dedicated inspectors | Zero dedicated inspectors, one shared operator monitoring alerts |
| Detection consistency | Varies by fatigue, shift, and individual | Consistent threshold applied every unit, every shift |
| Speed limit on line | Capped by human visual processing speed | Scales with line speed, no throughput ceiling from inspection |
| Defect data logging | Manual notes, inconsistent detail | Automatic image capture tied to timestamp and location |
| Recall traceability | Hours to days to trace root cause | Minutes, using searchable image and event history |
The labor line alone often covers a meaningful share of the payback period, before scrap reduction or complaint avoidance are even factored in.
What the Timeline Looks Like
A Realistic Payback Path for a Mid-Size Food Plant
Month 1 to 2
Installation, camera calibration, and initial model training on your specific product and defect types, run alongside existing inspection as a validation pass rather than a full replacement.
Month 3 to 4
Model accuracy stabilizes and the system takes over primary inspection duty on the pilot line, with scrap and complaint data starting to show a measurable shift.
Month 5 to 9
Cumulative savings from reduced over-rejection, fewer escaped defects, and reallocated labor cross the total implementation cost, marking the actual payback point most plants report.
Month 10 Onward
Savings continue as pure benefit, and the same infrastructure typically extends to additional lines at a fraction of the first line's setup cost.
The mistake I see most often is plants trying to justify AI vision purely on scrap reduction, because that's the easiest number to measure. But scrap is usually the smallest piece of the actual return. The bigger number is almost always in labor reallocation and in the complaints and holds that never happen, and those are harder to model but far more valuable over a year. Build the case with all three, not just the one that's easiest to put in a spreadsheet.
Renata Okonkwo-Byström
Food Manufacturing Operations Consultant · Former plant director, 12 years in F&B quality systems
ROI Questions, Answered
AI Vision ROI for Food Plants — Frequently Asked
How long does it actually take to see a return on AI vision inspection?
Most mid-size food plants report a payback window somewhere between three and nine months, depending on how much of the return comes from labor reallocation versus scrap and complaint reduction. Plants with high manual inspection headcount tend to see faster payback because that labor cost is immediate and easy to reassign, while plants relying more heavily on recall risk reduction see a longer but often larger cumulative return over the following year.
What inputs do we need to gather before building an accurate ROI model?
You'll want twelve months of scrap and rework data by line, current inspection labor hours and cost, historical complaint volume with associated cost per incident, and any recall or hold history from the past few years. The more specific this data is to your actual lines rather than industry averages, the more defensible the resulting payback number will be when you present it internally. Contact our support team if you need help pulling this together.
Does the ROI calculation change for different food product types?
Yes, meaningfully. Products with visually obvious defects like foreign material or packaging misalignment tend to show faster measurable returns because detection accuracy improvements are easier to quantify. Products where defects are subtle, such as fill level variance or surface texture issues, often take slightly longer to model accurately but frequently show a larger return once the system is tuned, because those defects are the hardest for human inspectors to catch consistently.
Should the ROI model include soft costs like brand reputation risk?
It's reasonable to note reputation risk as a qualitative factor, but we'd recommend keeping the core payback number built entirely on measurable, historical costs your finance team can verify. Soft costs are real but hard to defend under scrutiny, and a conservative model built on hard numbers alone is usually more persuasive than an inflated one that includes speculative brand impact figures.
Can we pilot on one line before committing to a plant-wide rollout?
Yes, and this is the approach we recommend for almost every plant. A single-line pilot over eight to twelve weeks gives you real accuracy and payback data specific to your product before any larger capital commitment, and the infrastructure and model training from that pilot typically transfers to additional lines at a fraction of the original setup time and cost. Book a demo to see how a pilot is typically scoped.
Get Your Plant's Actual Number
See Your AI Vision Payback Timeline Before You Commit a Dollar
We'll walk through your scrap, labor, and complaint data together and build a payback model specific to your plant — no generic benchmarks, just your numbers.