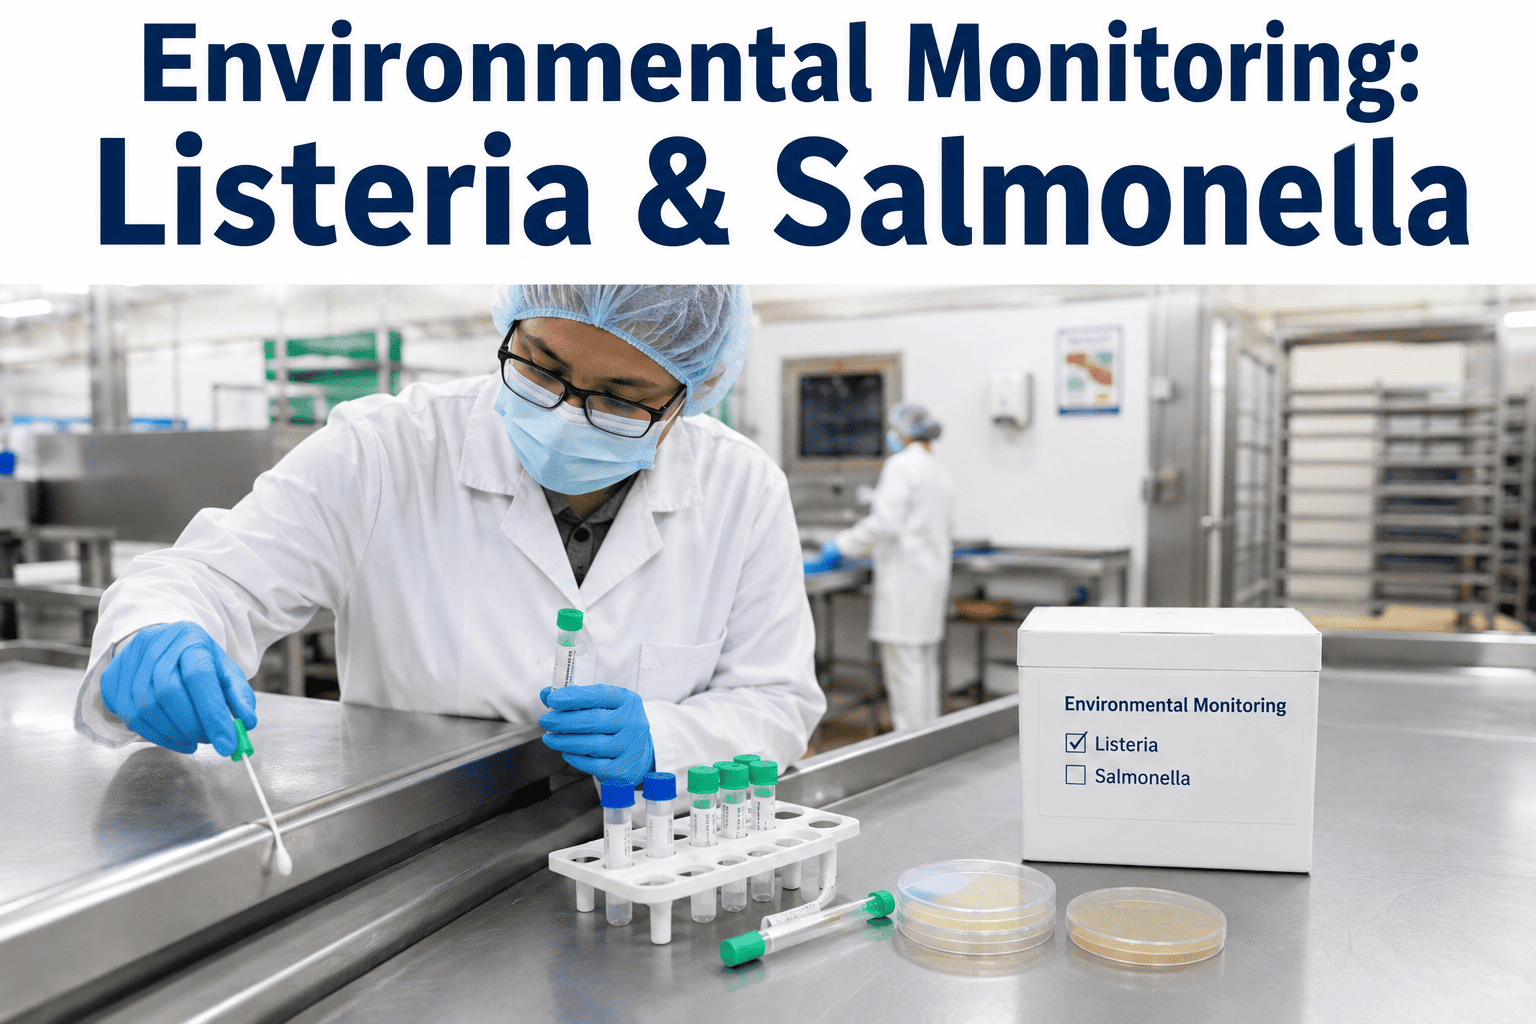
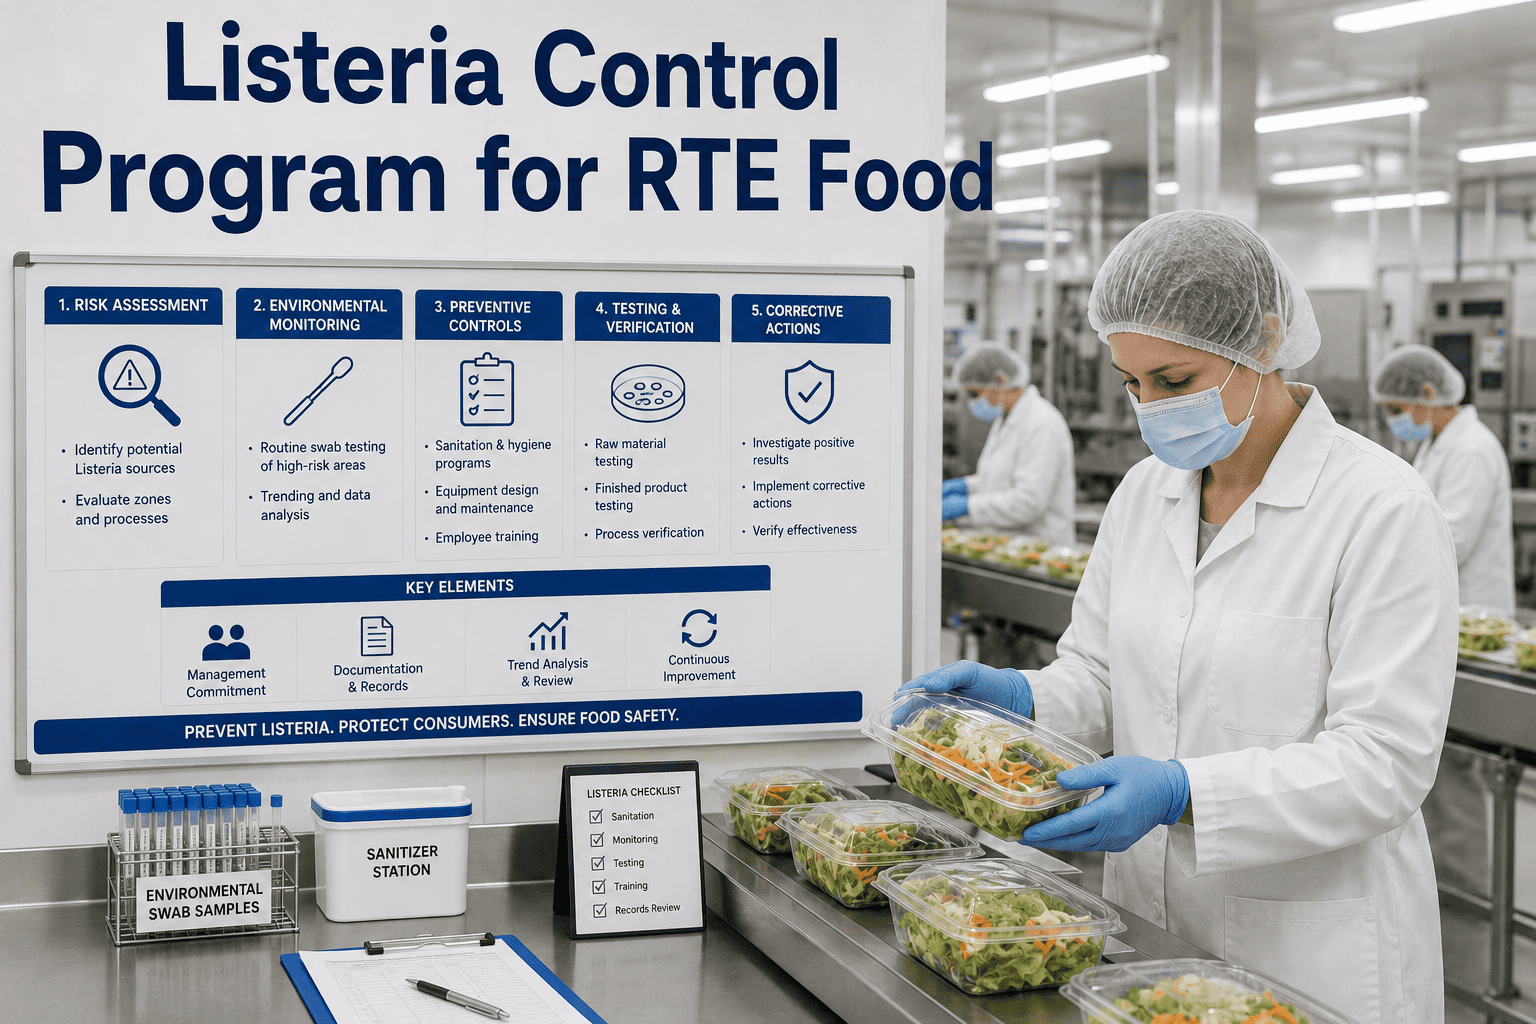
A positive Listeria swab on a floor drain doesn't necessarily mean the pathogen has reached product, but it does mean it's somewhere in the facility, and where it turns up matters enormously to what happens next. A well-designed environmental monitoring program maps a plant into risk-based zones, samples each with a frequency matched to its actual risk, and treats a positive result as data to act on rather than a problem to quietly retest away. iFactory helps food plants design and run environmental monitoring programs that actually catch pathogen harborage before it becomes a recall, detailed at iFactory support.
Pathogen Environmental Monitoring · Listeria & Salmonella
Environmental Monitoring: Where a Positive Swab Actually Tells You Something Useful
iFactory helps design zone-based environmental monitoring programs with sampling frequency and corrective action triggers matched to actual pathogen risk, not a generic swabbing schedule.
The Four-Zone Model
How Environmental Risk Is Mapped Across a Facility
Zone 1
Direct Product Contact
Surfaces that directly touch exposed product, carrying the highest consequence if contaminated, and requiring the tightest control and most frequent verification.
Zone 2
Near Product Contact
Surfaces adjacent to product contact areas, such as equipment housings and conveyor frames, that could transfer contamination to Zone 1 through splash or contact.
Zone 3
Broader Processing Area
Floors, drains, and walls within the processing room, where pathogens commonly establish and can spread via foot traffic, equipment movement, or aerosols.
Zone 4
Outside Processing Area
Break rooms, hallways, and receiving areas outside the direct processing environment, monitored to catch contamination before it migrates inward.
A Zone 3 Positive Left Unaddressed Becomes a Zone 1 Problem Eventually
Trend analysis across zones and sample sites reveals harborage patterns a single positive result never shows on its own.
Corrective Action Response
Five Steps When a Zone 2 or 3 Sample Comes Back Positive
1Isolate and intensively swab the immediate area to define the extent of the positive finding.
2Investigate for a harborage site — equipment with hard-to-clean crevices, damaged flooring, or standing water.
3Deep clean and sanitize the affected area, then verify with follow-up swabbing before resuming normal schedule.
4Review whether the finding indicates a risk to Zone 1 that requires product disposition review.
5Log the finding and response in a trackable record to support pattern analysis over time.
Generic Swabbing vs. Risk-Based Program
What Changes When Sampling Frequency Matches Actual Risk
Factor
Generic Fixed Schedule
Risk-Based Program
Sample Site Selection
Same sites swabbed regardless of risk profile
Prioritized by zone risk and historical positive trends
Trend Visibility
Individual results reviewed in isolation
Pattern analysis across sites and time reveals harborage
Corrective Action Trigger
Inconsistent, often reactive to a single result
Defined trigger thresholds tied to zone and trend
Frequently Asked Questions
Environmental Monitoring — Common Questions
How many sample sites does a typical facility need?
Site count depends on facility size, process complexity, and product risk category, but most mid-size ready-to-eat facilities land somewhere between 30 and 100 defined sample sites across all four zones, with Zone 1 and 2 sites weighted toward more frequent sampling. A site-specific risk assessment during program design is the right way to determine coverage rather than applying a generic count.
Book a Demo to review site mapping for your facility.
What should trigger increased sampling frequency at a site?
A single positive result at a Zone 2 or 3 site commonly triggers a period of intensified sampling at and around that location to confirm the issue has been resolved, along with root cause investigation into why that site tested positive. Sites with a history of repeat positives, even after remediation, often warrant permanently increased baseline frequency rather than reverting to the original schedule.
How does trend analysis actually help beyond individual result review?
Reviewing results in isolation can miss a pattern where the same general area shows intermittent positives across different specific sites over months, which individually might each look like an isolated, resolved event but collectively suggest an underlying harborage site nearby that hasn't been found. Trend analysis across the full site history surfaces that pattern in a way single-result review doesn't.
Contact support to review trend analysis for your program.
Does a Zone 3 positive always mean product is at risk?
Not necessarily, and treating every Zone 3 finding as an automatic product hold isn't proportionate or standard practice. The response depends on proximity to product contact surfaces, the pathogen involved, and whether the finding represents an isolated event or part of a pattern, which is why a defined, documented corrective action protocol matters more than a blanket reaction rule.
How long does it take to design and launch a full program?
A full facility risk assessment, zone mapping, and initial sample site selection typically takes three to five weeks, with the program going fully live shortly after baseline sampling establishes a starting dataset.
Book a Demo for a design timeline specific to your facility.
Give Your Environmental Monitoring Program the Zone-Based Structure Pathogens Actually Respect
Risk-based sampling design, trend analysis, and corrective action tracking, live in as little as three weeks.