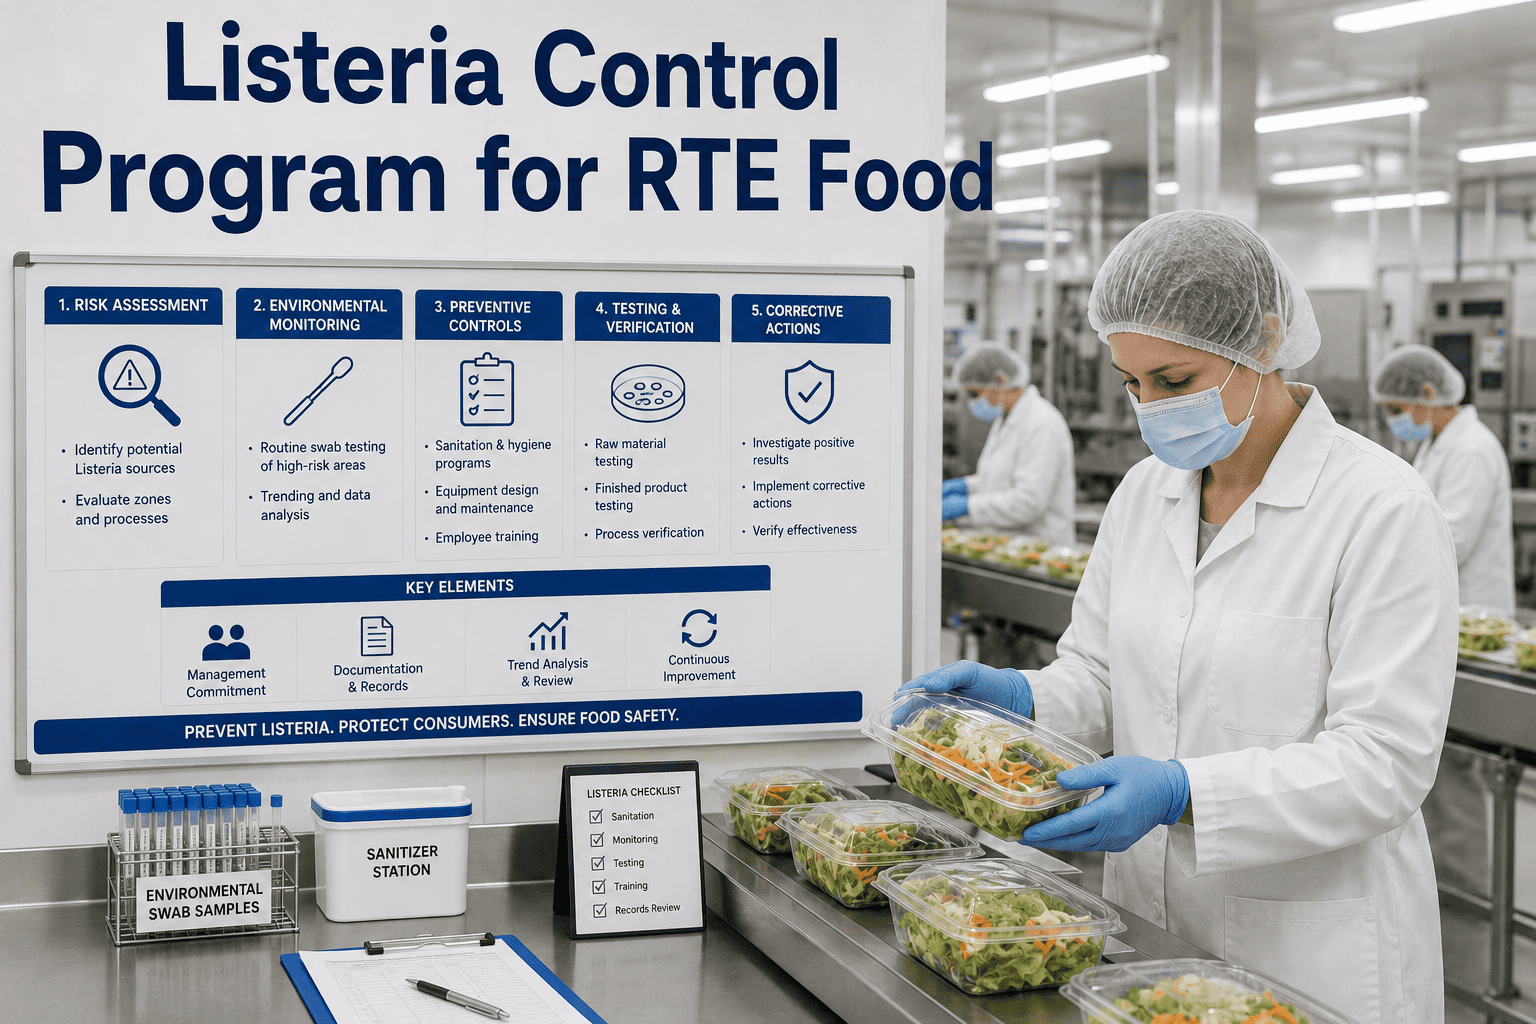
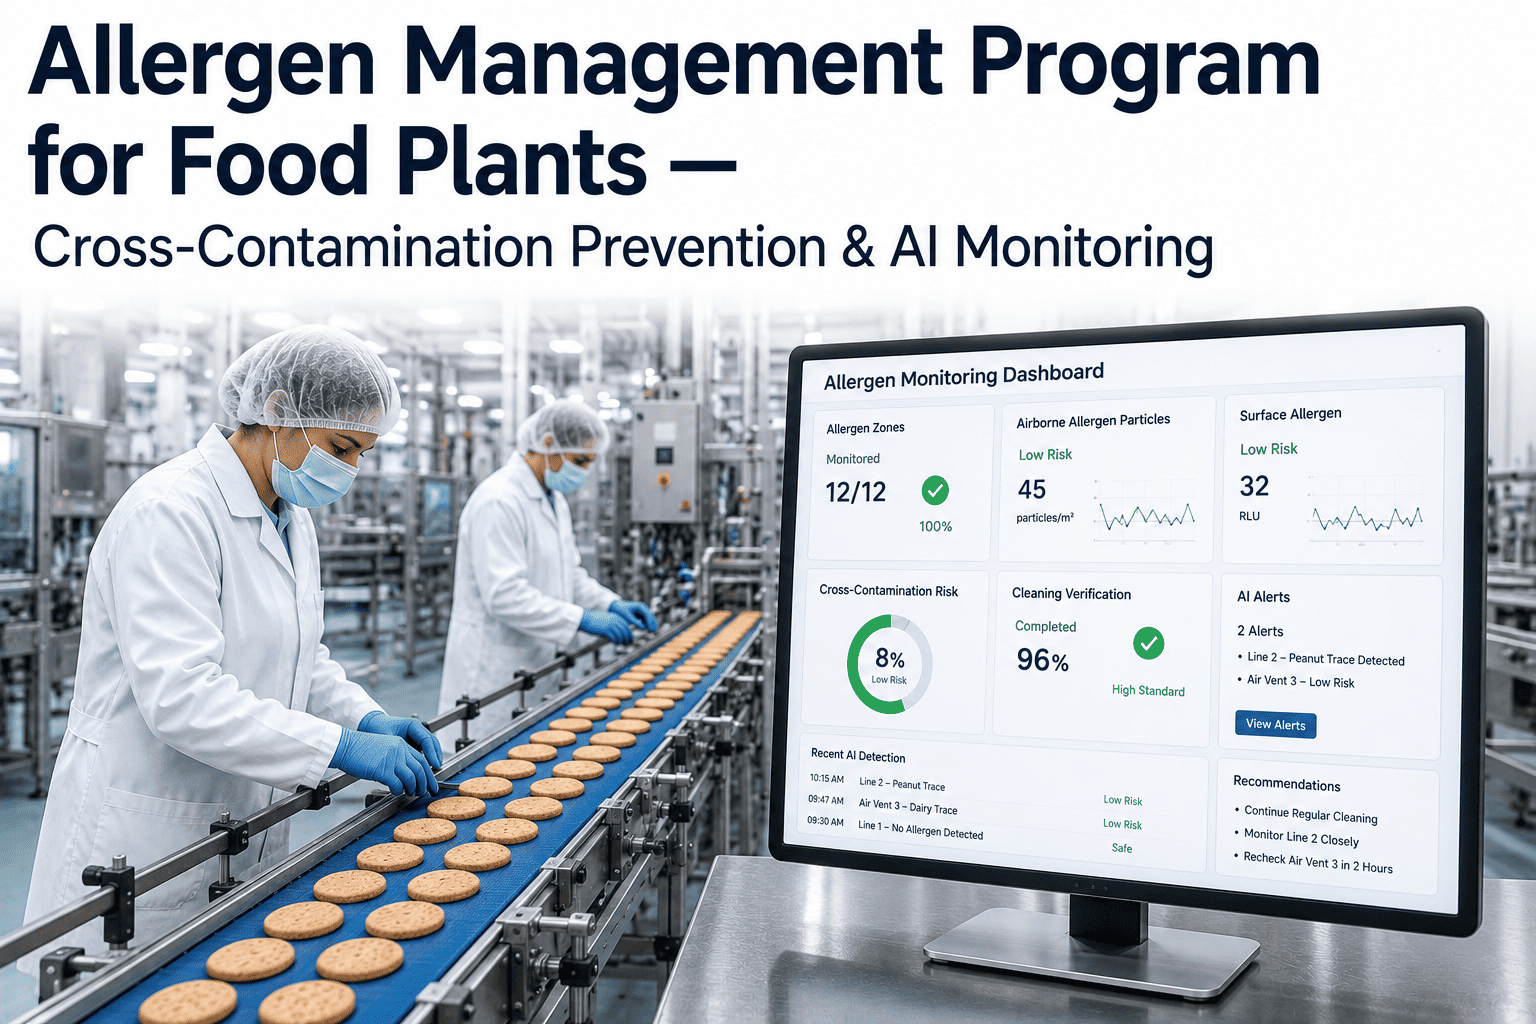
A single positive Listeria swab in the wrong zone can shut a production line for days, trigger a hold on finished goods, and put a plant's name in a warning letter. Yet most environmental monitoring programs are still built around a testing calendar instead of a risk map — swab the same twenty spots every week, log a pass, move on. That approach finds problems only after they have already colonized a floor drain or a conveyor frame. A science-based EMP does the opposite: it treats the plant as a set of zones with different contamination risk, rotates sites so niches cannot hide, and uses trend data to catch a harborage point before it becomes a positive on food-contact surfaces. iFactory's AI layer sits on top of this discipline, mapping every swab result against layout, traffic, and airflow so patterns become visible weeks before a human reviewing spreadsheets would notice them. Book an EMP design review to see your own plant mapped this way.
Find the Harborage Point Before It Finds Your Product
A zone-based environmental monitoring program with AI trend mapping turns routine swabbing into an early-warning system for Listeria, Salmonella, and the indicator organisms that signal a problem is forming.
Why Environmental Monitoring Gets Expensive Fast
A weak EMP does not fail quietly. It fails as a recall, a customer audit finding, or weeks of destructive sampling to clear a positive. The figures below are why regulators and auditors treat EMP design as a core pillar of a food safety plan rather than a paperwork exercise.
of Listeria positives trace back to a harborage niche, not a single contamination event
typical time to clear a persistent positive once it establishes in equipment
average direct cost of a food safety recall once product has shipped
the standard risk-based structure every credible EMP is built around
The Four-Zone Model: Where You Swab and Why
Every credible EMP organizes the plant into four zones by proximity to exposed product. Sampling frequency and corrective-action urgency both increase as you move toward Zone 1.
Food-contact surfaces
Slicer blades, conveyor belts, filler nozzles, forming dies. Any positive here is treated as an immediate product-safety event with hold-and-test on affected lots.
Adjacent non-contact surfaces
Equipment frames, control panels, and guards close enough to splash or drip onto Zone 1. A positive here is the earliest real warning sign in the whole program.
Wider processing-room environment
Floors, drains, wheels, forklifts, and floor-level structural elements. High-risk for harborage niches because moisture and organic soil accumulate here.
Outside the processing room
Locker rooms, hallways, docks, and warehouse. Lower urgency but tracked for trend, since traffic patterns can carry organisms toward Zone 3 over time.
Indicator Organisms vs. Pathogen Targets
A mature program tests for two different things, and confusing them is one of the most common EMP design mistakes. Indicators tell you a niche exists; pathogen-specific testing confirms whether that niche carries the organism you actually need to control.
- Total plate count, coliforms, and Listeria species (not just monocytogenes)
- Cheaper, faster turnaround, run at far higher swab volume
- A rising indicator trend on one line is your earliest actionable signal
- Used to validate that sanitation and design changes are working
- Never used alone to clear or hold product — they are a leading indicator only
- Listeria monocytogenes, Salmonella species, targeted by PCR or culture
- Slower, more expensive, reserved for Zone 1–2 and positive follow-up
- A confirmed positive triggers root-cause investigation and product hold
- Required for regulatory reporting and customer notification thresholds
- The number that determines whether product ships or gets destroyed
The Corrective Action Ladder
What happens after a positive should never be improvised in the moment. A written, escalating response — decided before anyone finds a result — is what separates a controlled program from a panic.
Contain and re-swab
Isolate the site immediately. Intensified swabbing of the positive location plus surrounding sites within the same shift, before any deep clean disturbs the evidence trail.
Root-cause investigation
Trace the positive against layout, equipment age, recent maintenance, and traffic logs to identify how the organism reached that site rather than only cleaning it away.
Targeted deep clean
Disassembly-level sanitation of the affected equipment and adjacent structure, not a surface wipe-down, followed by verification swabbing before the line restarts.
Vector-swab expansion
A widened swab pattern outward from the original site over the following days confirms containment before the site returns to routine frequency.
Trend review and design fix
If the same site recurs, the fix moves from cleaning to engineering: welded seams instead of bolted frames, sloped surfaces, or equipment relocation away from moisture.
See Your Plant's Zone Map Built From Your Own Swab History
iFactory ingests twelve months of existing EMP data and rebuilds it into a live risk map showing which sites are trending, which are clean, and where your next positive is most likely to appear.
Recommended Swab Frequency by Zone and Risk Tier
Frequency is not one-size-fits-all across a plant. High-moisture, ready-to-eat lines run a tighter schedule than dry-storage or low-risk zones. Use this as a starting benchmark, then let trend data adjust it site by site.
Where AI Changes What a Spreadsheet Cannot See
Most EMP data still lives in spreadsheets that show pass or fail per site. The pattern that predicts a positive rarely lives in a single result — it lives in the relationship between sites over time.
Cross-site correlation
Flags when two nearby sites drift upward together weeks before either crosses an individual action threshold on its own.
Seasonal pattern detection
Learns which sites spike with humidity, production volume, or HVAC cycles so seasonal noise is not confused with a real trend.
Recurrence risk scoring
Ranks previously-positive sites by likelihood of recurrence based on cleaning history, equipment age, and prior root-cause findings.
Sampling plan optimization
Recommends which low-yield sites can rotate to a lighter schedule so swab budget concentrates on sites carrying the most real risk.
A Quality Director's View on Moving to Zone-Based Monitoring
We used to swab the same sites every week because that is what the binder said to do, and we treated every result the same regardless of trend. Once we moved to a zone model and started watching indicator trends instead of single pass-fail results, we caught a niche behind a conveyor bearing that had been building for six weeks. It never once threw a Zone 1 positive, but the indicator trend on the adjacent frame was climbing the whole time. We fixed it during a scheduled changeover, not during a shutdown.
reduction in Zone 1 positives within a year of adopting trend-based swab rotation
average lead time gained catching a harborage niche before a Zone 1 event
product holds tied to environmental positives since program redesign
Frequently Asked Questions
How many sites should a mid-size plant be swabbing weekly?
There is no fixed number that applies across plants — it depends on square footage, product risk category, and how many Zone 1 and Zone 2 sites exist on each line. A typical ready-to-eat facility of moderate size runs somewhere between 40 and 120 active sites across all four zones, rotated so that no single site goes untested for more than the interval defined in the written program. Book a design review to get a site count specific to your layout.
What is the difference between a presumptive positive and a confirmed positive?
A presumptive positive comes from a rapid screening method such as PCR and triggers immediate containment action, but it is not yet confirmed. Confirmation requires culture-based follow-up that identifies the organism to species level. Programs that wait for confirmation before acting lose valuable days; the correct practice is to treat every presumptive result as real until confirmation says otherwise.
Should indicator organism results ever trigger a product hold on their own?
No. Indicator organisms such as total plate count or generic Listeria species are leading signals used to direct sanitation and investigation effort, not release decisions. A product hold is reserved for confirmed pathogen-specific results on Zone 1 food-contact surfaces or in finished product testing, tied to the corrective action procedure defined in your food safety plan.
How long should historical EMP data be retained and reviewed?
Most regulatory frameworks and customer audit standards expect at least two years of EMP records retained and available. The bigger opportunity most plants miss is review: trend data older than a few months is rarely re-examined by hand, which is exactly the data range where slow-building harborage patterns are visible if analyzed systematically rather than left in a folder.
Can AI trend mapping work with our existing lab and swabbing vendor?
Yes. iFactory ingests results from existing LIMS exports, lab portals, or manual spreadsheets regardless of which lab or swab vendor performs the testing. No change to your sampling method, lab relationship, or chain-of-custody process is required. Talk to a specialist about connecting your current data source.
The Bottom Line on Environmental Monitoring
A calendar-driven swab schedule catches what has already gone wrong. A zone-based program built on indicator trends catches what is about to. The difference is not more testing — it is smarter interpretation of the testing you already run, turned into a map of where risk is building instead of a list of pass and fail results filed away until the next audit.
Turn Your Swab History Into a Risk Map
Book a 30-minute review. Bring twelve months of EMP results and iFactory will map your zones, surface any sites already trending, and scope an AI monitoring rollout built around your existing lab workflow.