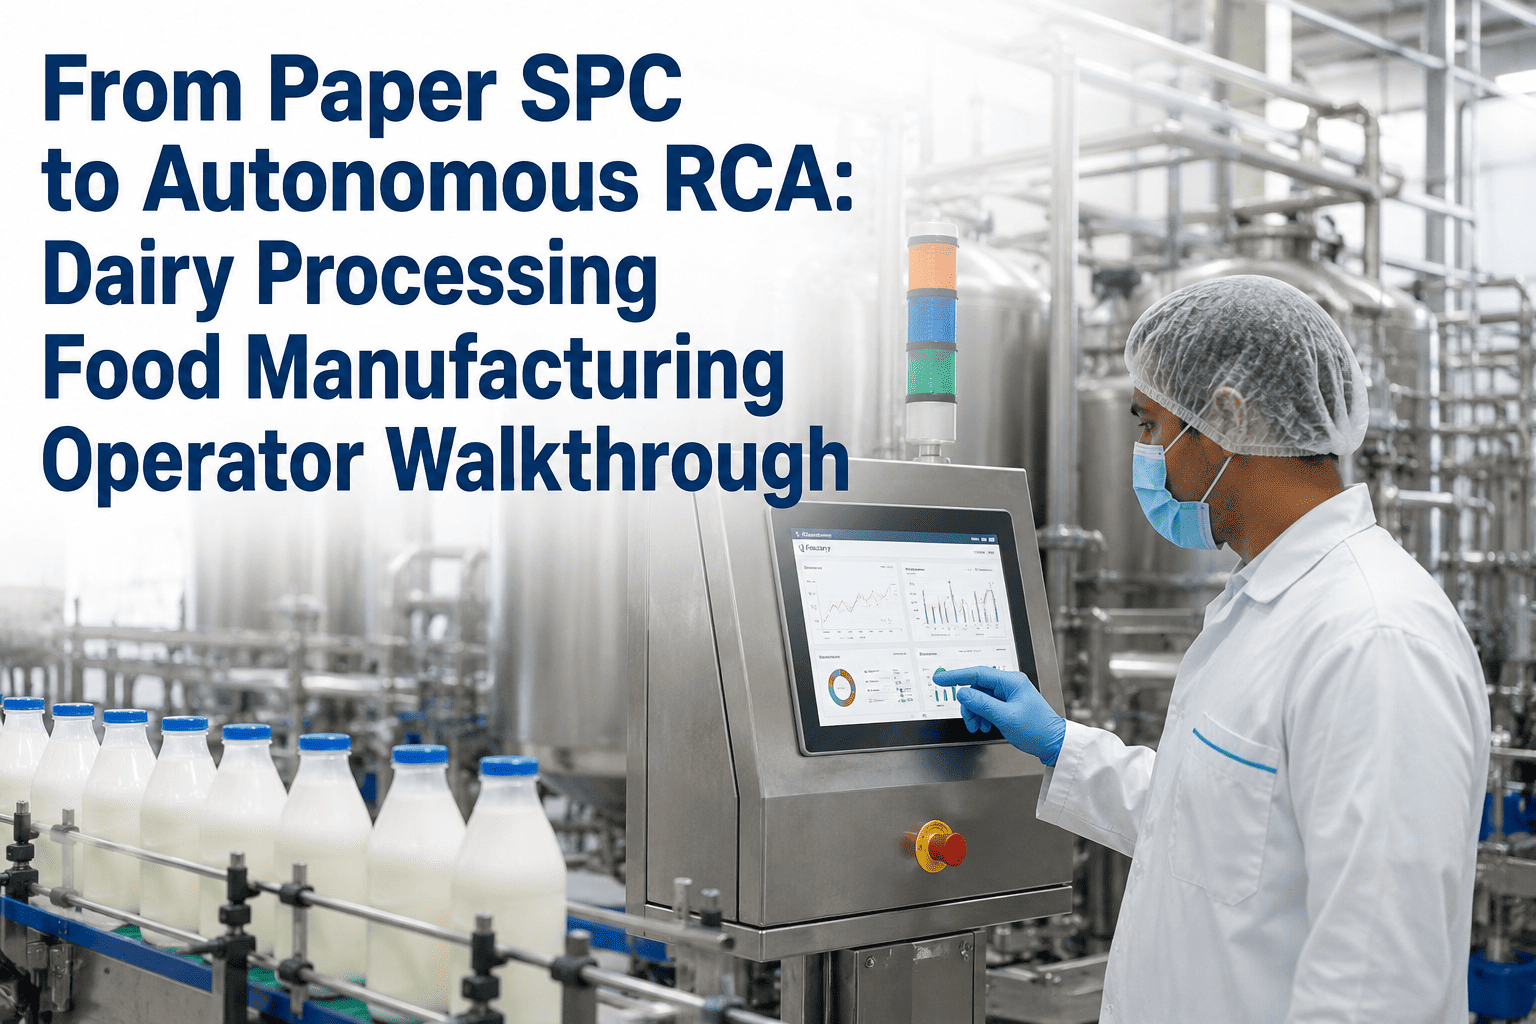
From Paper SPC to AI SPC: Dairy Processing Food Manufacturing Operator Walkthrough
By Riley Quinn on May 26, 2026
Here’s a number that almost no dairy operator can answer in real time: what’s the gap between your line’s Cp and your line’s Cpk right now? The two indices look similar on a quality report — both expressed as a single decimal, both measuring “process capability” — but they tell completely different stories. Cp is your line’s *potential* capability if the process were perfectly centered on target. Cpk is your line’s *actual* capability accounting for how far off-target you’re really running. The gap between them is the size of your centering problem — the giveaway, the rework, the chronic out-of-spec you accept as the cost of running. From paper SPC through digital to AI-native, the entire forty-year arc of statistical process control has been about closing that gap. AI-native SPC is the first generation that closes it autonomously, on every shift, across homogenizer, pasteurizer, filler, and CIP simultaneously. This guide walks an operator through how the gap forms, why each previous generation could only partially close it, and what changes when AI does the work. Book a demo with us to see your line’s Cp–Cpk gap measured on your historian data.
The Cp–Cpk Gap · What Most Lines Look Like
FAT CONTENT · SKIM MILK STANDARDIZATION
Cp (potential)
1.42
if centered
vs
Cpk (actual)
0.91
off-centered
=
Gap
0.51
the centering loss
Cp vs Cpk — The Difference Every Operator Should Know
Both indices use the same denominator — six standard deviations of natural process variation. The numerator is where they diverge. Cp uses the full specification width (USL minus LSL) and assumes the process is centered. Cpk uses whichever side of the target the process is actually running closer to — punishing off-centering directly. A dairy line can have a beautiful Cp of 1.5 and a terrible Cpk of 0.9 if it’s running consistently off-target. The Cp says the variation is fine; the Cpk says you’re fine on variation but failing on centering. Most chronic out-of-spec problems in dairy live exactly in this gap.
Index A
Cp
Cp = (USL − LSL) / 6σ
Measures: potential capability
Assumes the process is perfectly centered on target. Tells you the absolute best your line could do if centering were handled. Ignores where the actual mean sits.
What Cp = 1.42 means
"Your spread is tight. The variation isn’t the issue."
Index B
Cpk
Cpk = min[(USL − μ)/3σ, (μ − LSL)/3σ]
Measures: actual capability
Uses whichever side of target the process is running closer to. Directly penalizes off-centering. Tells you what the customer actually receives, not the best case.
What Cpk = 0.91 means
"You’re running off-target. Centering is the problem, not spread."
Where the Cp–Cpk Gap Hides on a Dairy Line — Asset by Asset
The gap isn’t evenly distributed. Some dairy assets routinely produce wide gaps; others run tight. Knowing where the gap lives on your line is how you decide what to attack first. The pattern is remarkably consistent across modern dairy plants — four asset families account for the overwhelming majority of off-centering.
Homogenizer
Typical gap: 0.30–0.45
Positive displacement pumps drift below the 200–300 bar target as piston seals wear. Cp stays steady (spread tight); Cpk falls (mean walks off-target). Operators rarely catch the slow walk before texture defects form.
Centering issue: pressure drift
Pasteurizer
Typical gap: 0.20–0.35
HTST hold-tube runs consistently 0.3–0.5°C above target to stay safely above 72°C floor. Cp looks healthy; Cpk shows the safety-margin bias. Over-pasteurization compounds energy cost and product impact.
Centering issue: safety bias
Filler
Typical gap: 0.40–0.60
Operators set fill volume systematically above target to avoid underweight rejects. Cp tight, Cpk poor — the textbook off-centering pattern. This is where giveaway lives directly as a budget line item.
Centering issue: overfill bias
Standardizer
Typical gap: 0.25–0.40
Fat content trends off target as raw milk seasonal composition shifts. Spread stays acceptable, mean walks. The fat-protein ratio Cpk gap is the single most operator-visible measure of centering control.
Centering issue: seasonal walk
Want your line’s asset-by-asset Cp–Cpk gap mapped against your historian data? Book a gap analysis demo with our dairy team.
How Each SPC Generation Tried — and Failed — to Close the Gap
The Cp–Cpk gap has been a known problem in process industries for decades. Each generation of SPC tooling made the gap easier to measure. None until AI-native SPC made the gap easier to close. Here’s why.
G1 · Paper SPC
Era: 1980s–2000s
Could do
Measure Cp and Cpk weekly from sample data. Operators saw the gap when the engineer calculated it Friday afternoon.
Could NOT
Catch off-target drift in real time. By the time the weekly report showed the gap, hundreds of batches had already shipped off-center.
G2 · Digital SPC
Era: 2000s–2010s
Could do
Calculate Cp and Cpk daily from auto-collected sensor data. The gap surfaced 6 days faster but corrective action still required manual intervention.
Could NOT
Diagnose *why* the mean was walking off-target. Operators saw the gap widen but had to manually investigate which asset, which shift, which recipe.
G3 · AI-Native SPC
Era: 2026 — operating frontier
Now does
Live Cp and Cpk continuously across every asset. Detects centering drift the moment it begins. Pushes prescriptive setpoint adjustments to the operator HMI to recenter the mean before product is affected.
The gap shift
From measuring the gap to actively closing it — on every shift, across every asset, autonomously.
The Operator’s Walkthrough — Homogenizer to Filler in 5 Steps
This is what an operator sees on shift with AI-native SPC running. Five touchpoints across the dairy line where the Cp–Cpk gap gets monitored and closed in real time. None of these require new training. All of them happen automatically in the background — the operator just sees the result.
01
Homogenizer
Pressure delivery vs 220 bar target
AI detects pressure trending 4 bar below target over 14 minutes. Recommends valve seat inspection at next planned stop. Centering preserved.
02
Pasteurizer
Hold-tube temp vs 72.5°C target
AI flags 0.4°C safety bias persisting across shifts. Recommends adaptive setpoint trim. Cpk lifts without compromising PMO compliance.
03
Standardizer
Fat content vs SKU target
Inline NIR shows mean walking 0.06% off-target due to raw milk seasonal shift. AI auto-trims cream metering valve. Fat-protein ratio Cpk stable.
04
Filler
Per-head fill weight vs target
Per-head P-chart detects Head 3 systematically 0.8g above target. Trim recommendation applied. Giveaway falls without underfill risk.
05
Shift Dashboard
Cp, Cpk, gap — live per asset
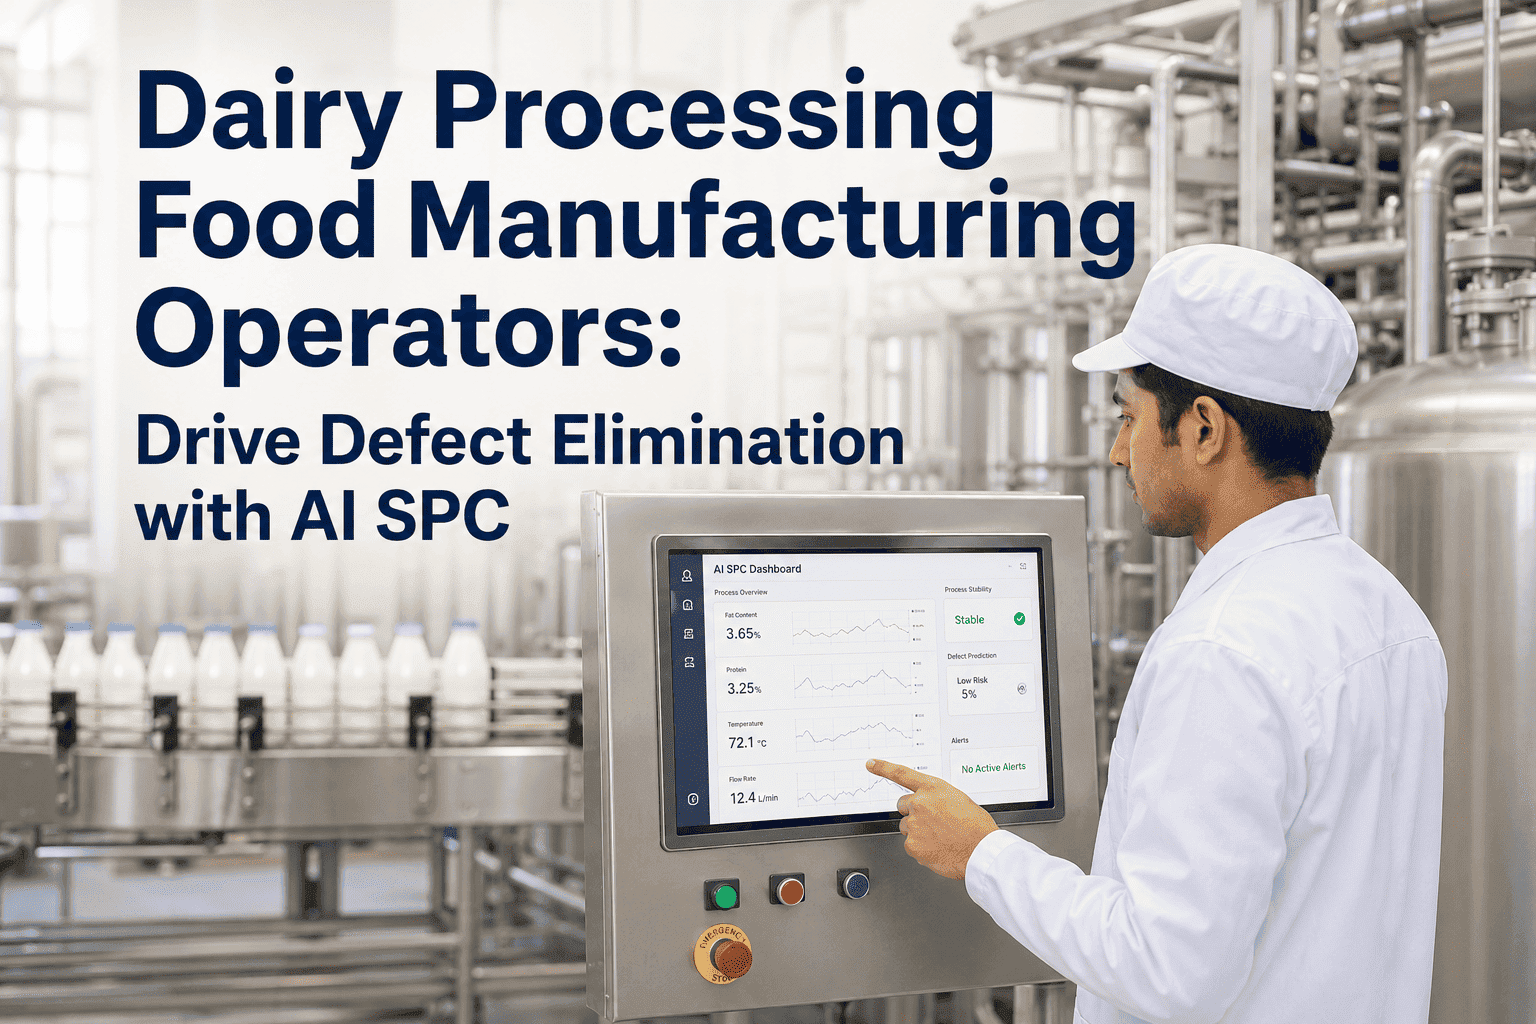
Operator sees the gap closing in real time across all four assets. Morning huddle starts with a forecast, not an explanation.
Close Your Cp–Cpk Gap in 6–12 Weeks
iFactory ships a pre-configured AI server tuned for dairy AI-native SPC — live Cp and Cpk monitoring across HTST, separator, homogenizer, filler, standardizer, and CIP. Integrates with your existing PLC and SCADA, first validated gap-closing alerts within 6–8 weeks.
What Closing the Gap Actually Delivers — Beyond the Single Cpk Number
Closing the Cp–Cpk gap isn’t cosmetic SPC bookkeeping. Five concrete outcomes follow directly from running a centered line instead of a safety-biased one. These are the numbers the plant manager cares about, the operator feels on shift, and the customer experiences in finished product consistency.
25–40%
Giveaway Reduction
Filler overfill bias and pasteurizer safety bias both shrink when AI manages the centering directly. Net product cost drops measurably within the first quarter.
+0.3–0.6
Cpk Lift on Chronic SKUs
The SKUs running at Cpk 0.8–1.0 because of centering — not spread — lift directly into the 1.3+ capable range without changing equipment.
~30%
Customer Complaint Reduction
Off-centered batches are the complaint generators. Customer-facing consistency improves visibly across the supply chain.
5–15 min
Drift Detection Lead Time
AI flags mean-shift drift before the defect forms. Centering corrections happen proactively, not after the lab confirms an out-of-spec batch.
Want these four outcomes modeled against your line’s production volumes? Book a working session with our dairy specialists.
Expert Perspective
"The key difference between Cp and Cpk is that Cp only considers the process variation, while Cpk also factors in the centering of the process relative to the specification limits. For decades, dairy plants have measured both indices and accepted the gap between them as a fact of life. The gap isn’t a fact of life — it’s a centering problem disguised as a capability problem, and AI-native SPC is the first generation of tooling that closes it in real time across every asset on the line simultaneously. The math hasn’t changed. What changed is the speed at which the centering can be corrected once the drift begins. Plants that close their Cp–Cpk gap routinely lift chronic Cpk 0.9 SKUs into the 1.3+ band within a single quarter."
— Dairy Process Capability Practice, 2026 industry insight
Cpk 1.33
industry-standard minimum capable process · 64 ppm defect rate
Cpk 1.67
world-class capability · 0.6 ppm defect rate
20–25
subgroups required to establish a valid SPC baseline
Conclusion: The Gap That Quietly Costs Everything
Every dairy line carries two capability numbers and the gap between them. Cp says what the line could do if it were centered. Cpk says what it actually does. The gap is the giveaway, the rework, the chronic out-of-spec accepted as the cost of running. Paper SPC could measure the gap once a week. Digital SPC moved that to once a day. AI-native SPC closes the gap continuously, autonomously, in real time, across every asset from homogenizer to filler. The operator’s job becomes execution and judgment on edge cases — not investigation of why the mean keeps walking off-target. The number that nobody could answer in real time at the start of this guide — *what’s the gap between your Cp and your Cpk right now?* — becomes live on the shift dashboard, trending toward zero week over week. Book a demo with us to see your gap close on your line.
Begin Closing the Gap on Your Dairy Line
iFactory’s dairy practice deploys AI-native SPC in 6–12 weeks against your existing PLC and SCADA. Live Cp and Cpk per asset, autonomous centering recommendations, prescriptive operator alerts. Get a free 30-minute working session built around your three widest-gap assets.
What’s the actual difference between Cp and Cpk on a dairy line?
Cp measures the potential capability of your process — how tight your variation is relative to the specification width, assuming the process is perfectly centered on target. Cpk measures the actual capability, accounting for how far off-target the process mean is really running. The formula tells the story: Cp uses (USL minus LSL) divided by six standard deviations, while Cpk uses whichever side of target the process is running closer to. A dairy line with Cp 1.4 and Cpk 0.9 has fine variation but poor centering — the spread is acceptable, but the mean has walked off target. The gap between Cp and Cpk is the size of your centering problem, and on most dairy lines it’s where the chronic giveaway, rework, and out-of-spec actually lives.
Why does the Cp–Cpk gap matter more than just the Cpk number alone?
Because the size of the gap tells you what to fix. A line running Cpk 0.9 with Cp 0.95 has a variation problem — the spread is too wide for the spec window. A line running Cpk 0.9 with Cp 1.4 has the same Cpk number but a completely different problem — the variation is fine, the mean is just off-target. Trying to fix the second line by chasing variation reduction won’t help; the line needs centering correction. Most chronic out-of-spec SKUs in dairy fall into the second category: tight spread, biased mean. AI-native SPC identifies which type of gap each asset is producing and targets the right corrective action automatically.
How does AI-native SPC actually close the gap in real time?
By monitoring the running mean continuously against target and detecting drift before it reaches the spec limit. Live Cp and Cpk calculations update on every shift across each asset. When the mean starts walking off-target — homogenizer pressure decaying, pasteurizer running with safety bias, filler systematically overfilling — the AI surfaces a prescriptive setpoint adjustment on the operator HMI with the specific corrective action attached. The corrective action is informed by the failure-pattern library of what worked last time the same drift pattern appeared. The mean gets recentered before the gap widens, and the operator confirms the action in seconds rather than investigating it manually for an hour.
Does AI-native SPC replace our existing PLC, SCADA, or SPC software?
No. iFactory’s AI-native SPC platform sits above your existing controls stack and reads data through standard industrial protocols. PLCs continue to run control logic exactly as today. SCADA continues to display threshold alarms operators are trained on. Your existing SPC software, if any, continues to function — the AI feeds it smarter, continuously updated control limits and the live Cp/Cpk gap calculations that legacy SPC tools can’t produce. The operator HMI gets prescriptive alerts and a gap-closing recommendation layer added on top of what’s already there. No control loop changes, no compliance documentation restructuring, no operator retraining on the controls layer. Deployment runs 6–12 weeks with first validated gap-closing alerts within 6–8 weeks.
What Cpk target should we work toward on a dairy line?
Cpk 1.33 is the industry-standard minimum for FMCG processes — corresponds to roughly 64 defects per million units and is required by most major retail buyers’ technical standards. Cpk 1.67 is world-class — 0.6 defects per million — typically the target for parameters with direct regulatory consequence like net weight, allergen content, or pasteurization compliance. Dairy plants deploying AI-native SPC typically see chronic SKUs lift from baseline Cpk 0.8–1.0 into the 1.33+ range within 12 weeks, and capable SKUs lift further into the 1.5–1.67 world-class band within 24 weeks. The trajectory depends on how much of your current gap is centering (closes fast) versus spread (closes more gradually). Most plants are surprised to find that the majority of their gap is centering — which means the lift comes faster than expected.