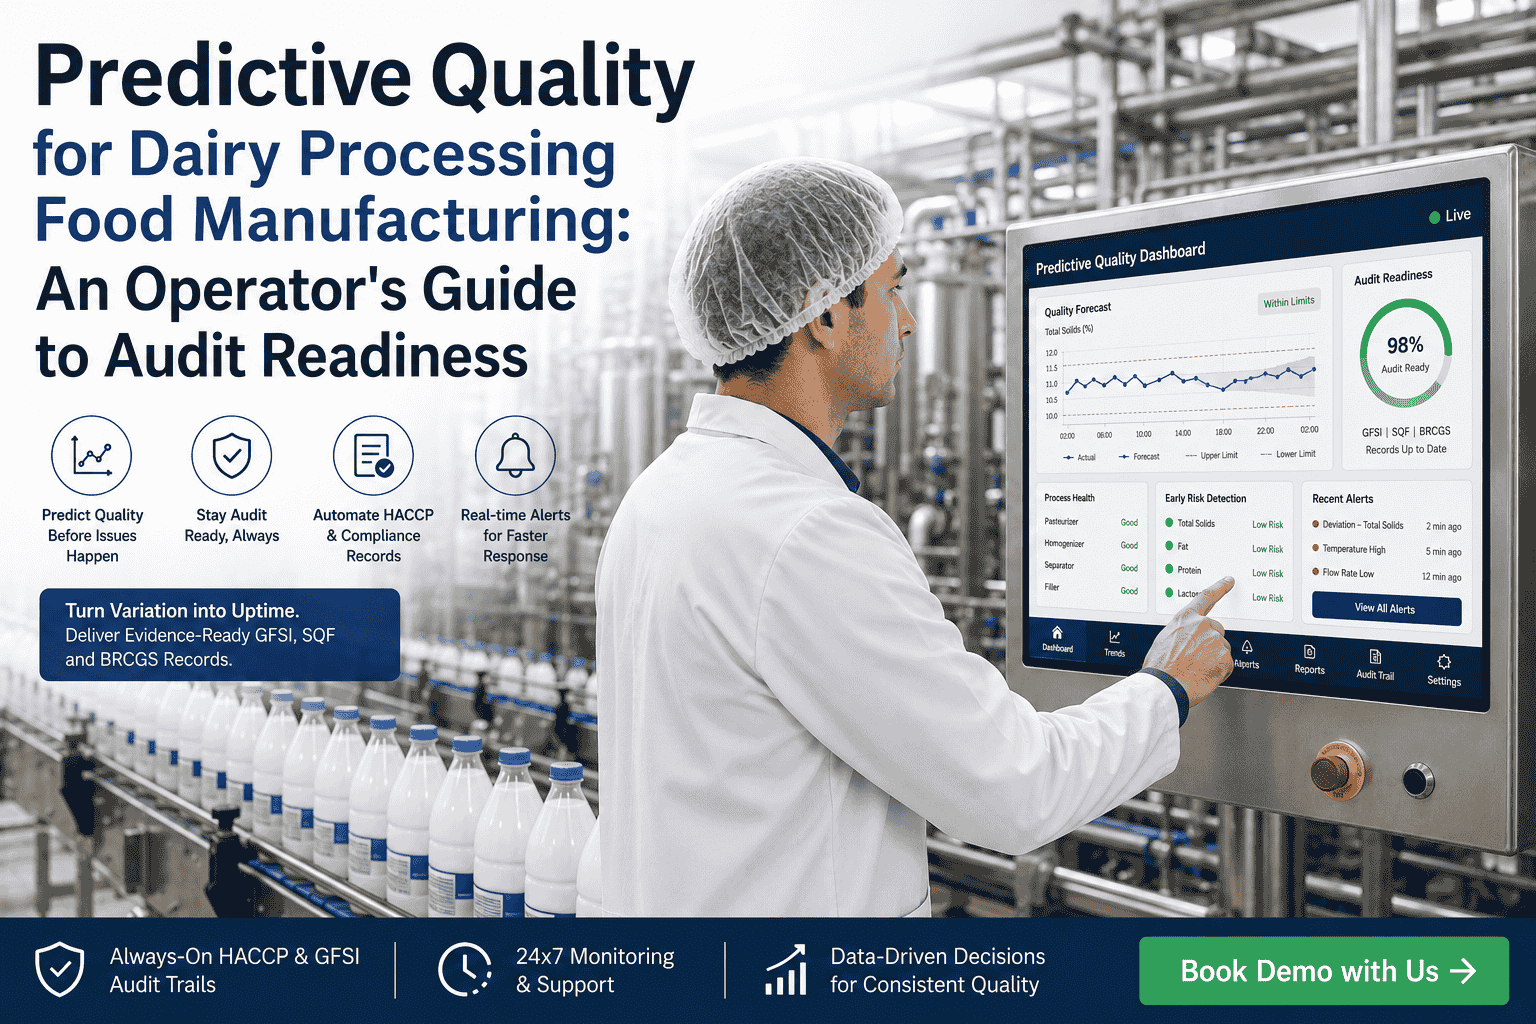
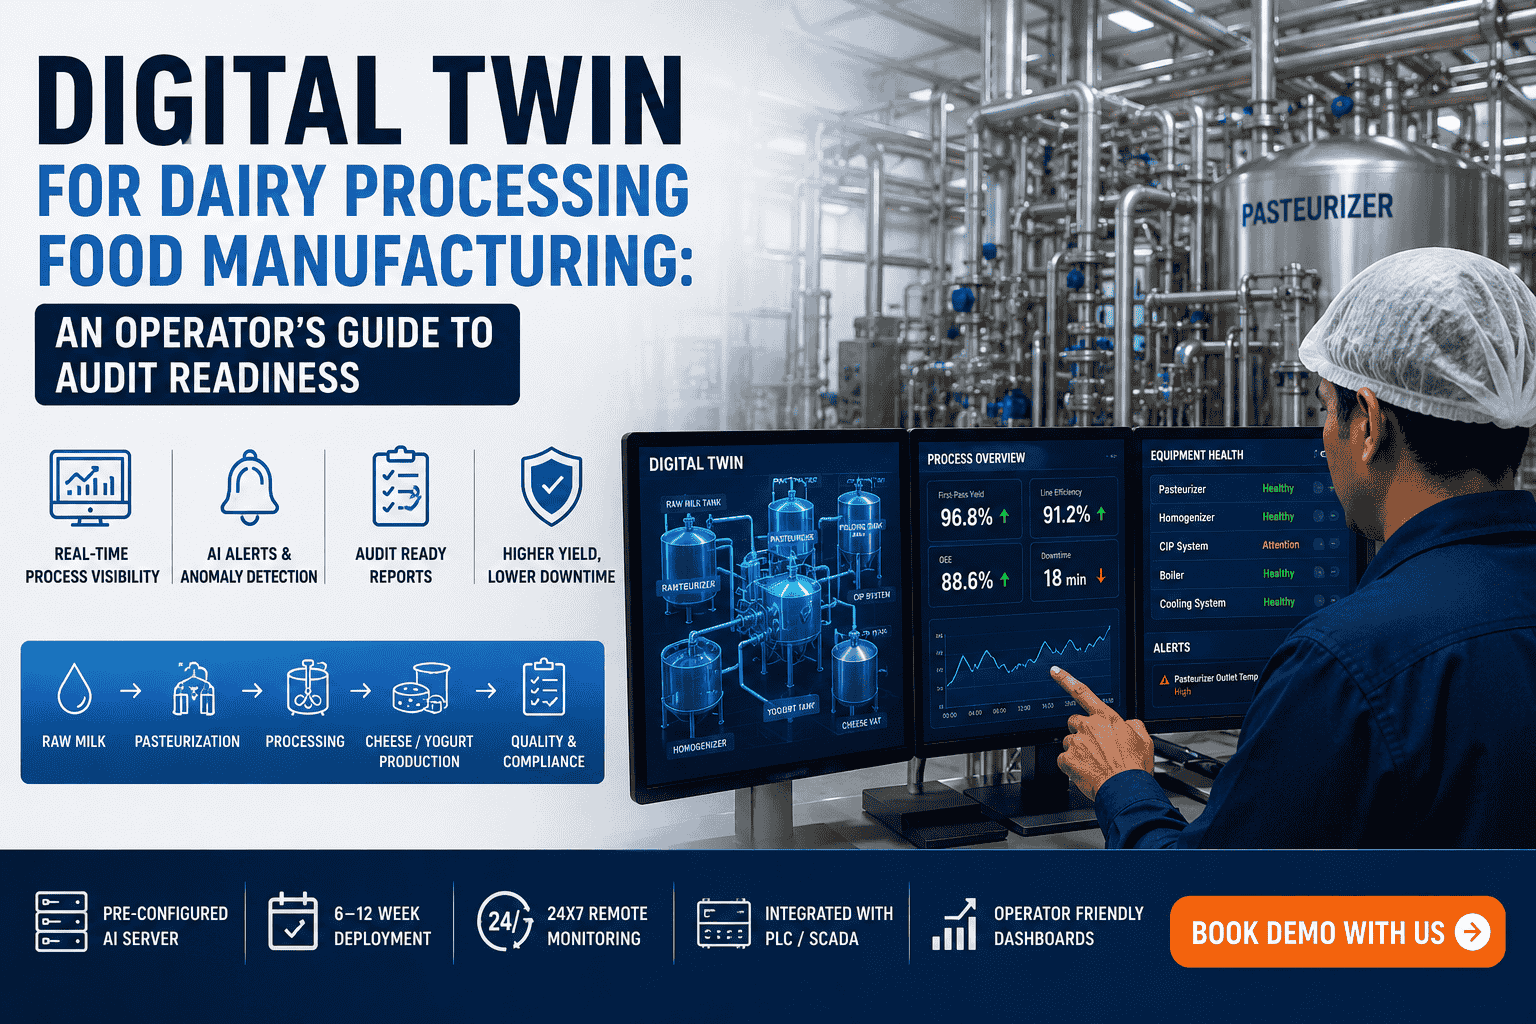
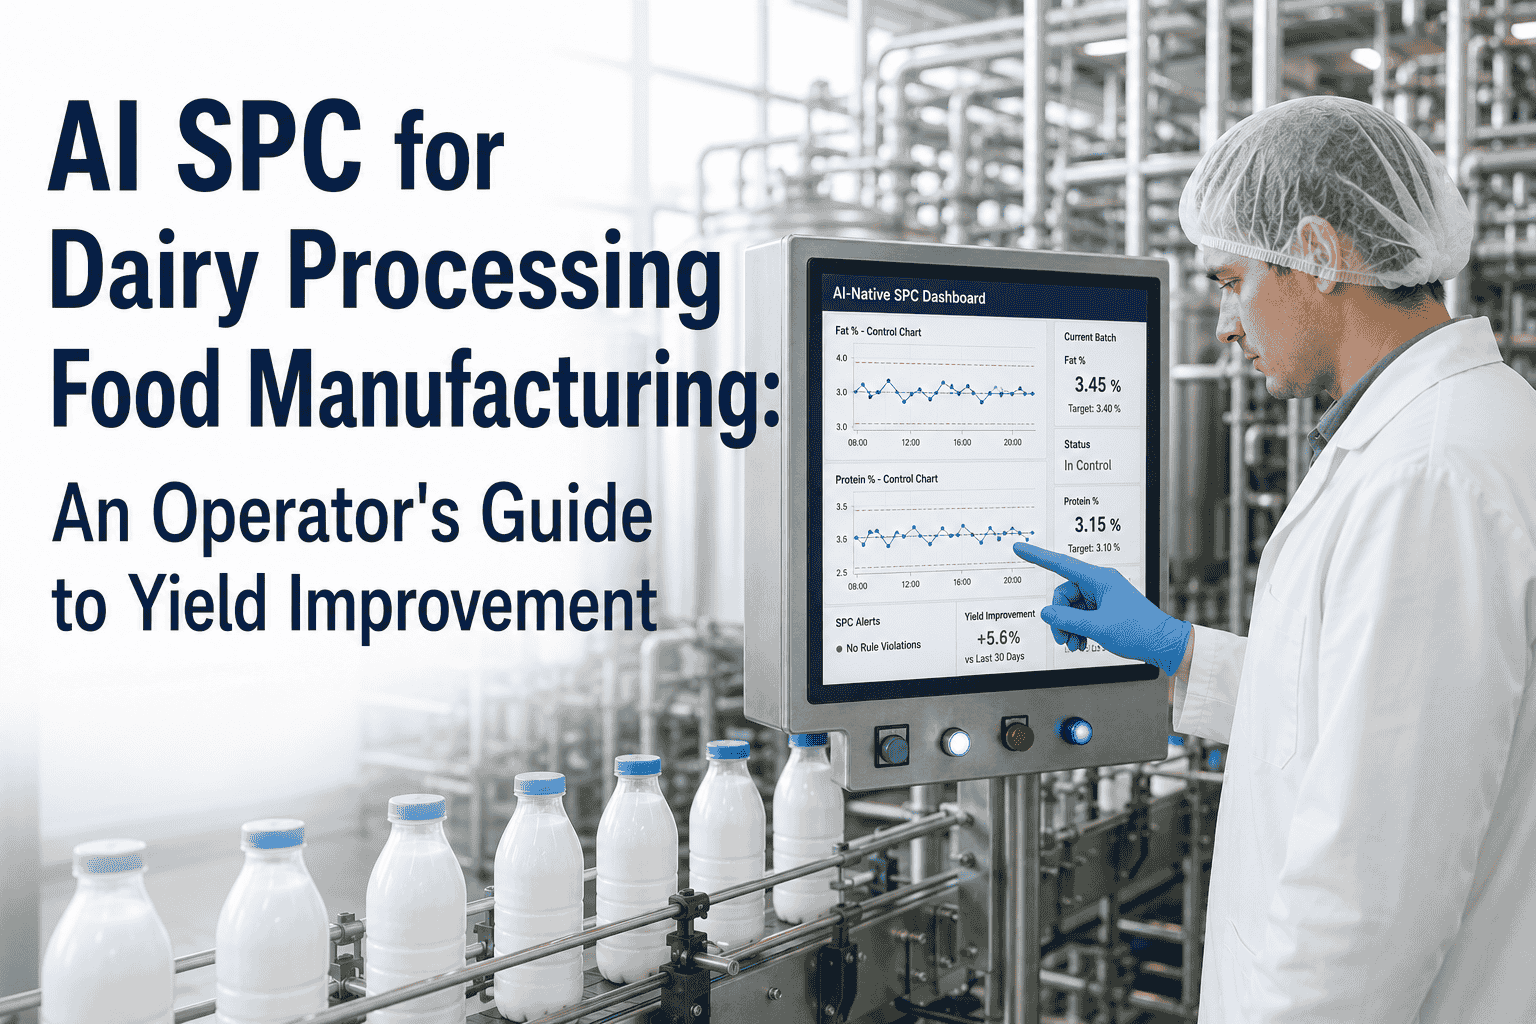
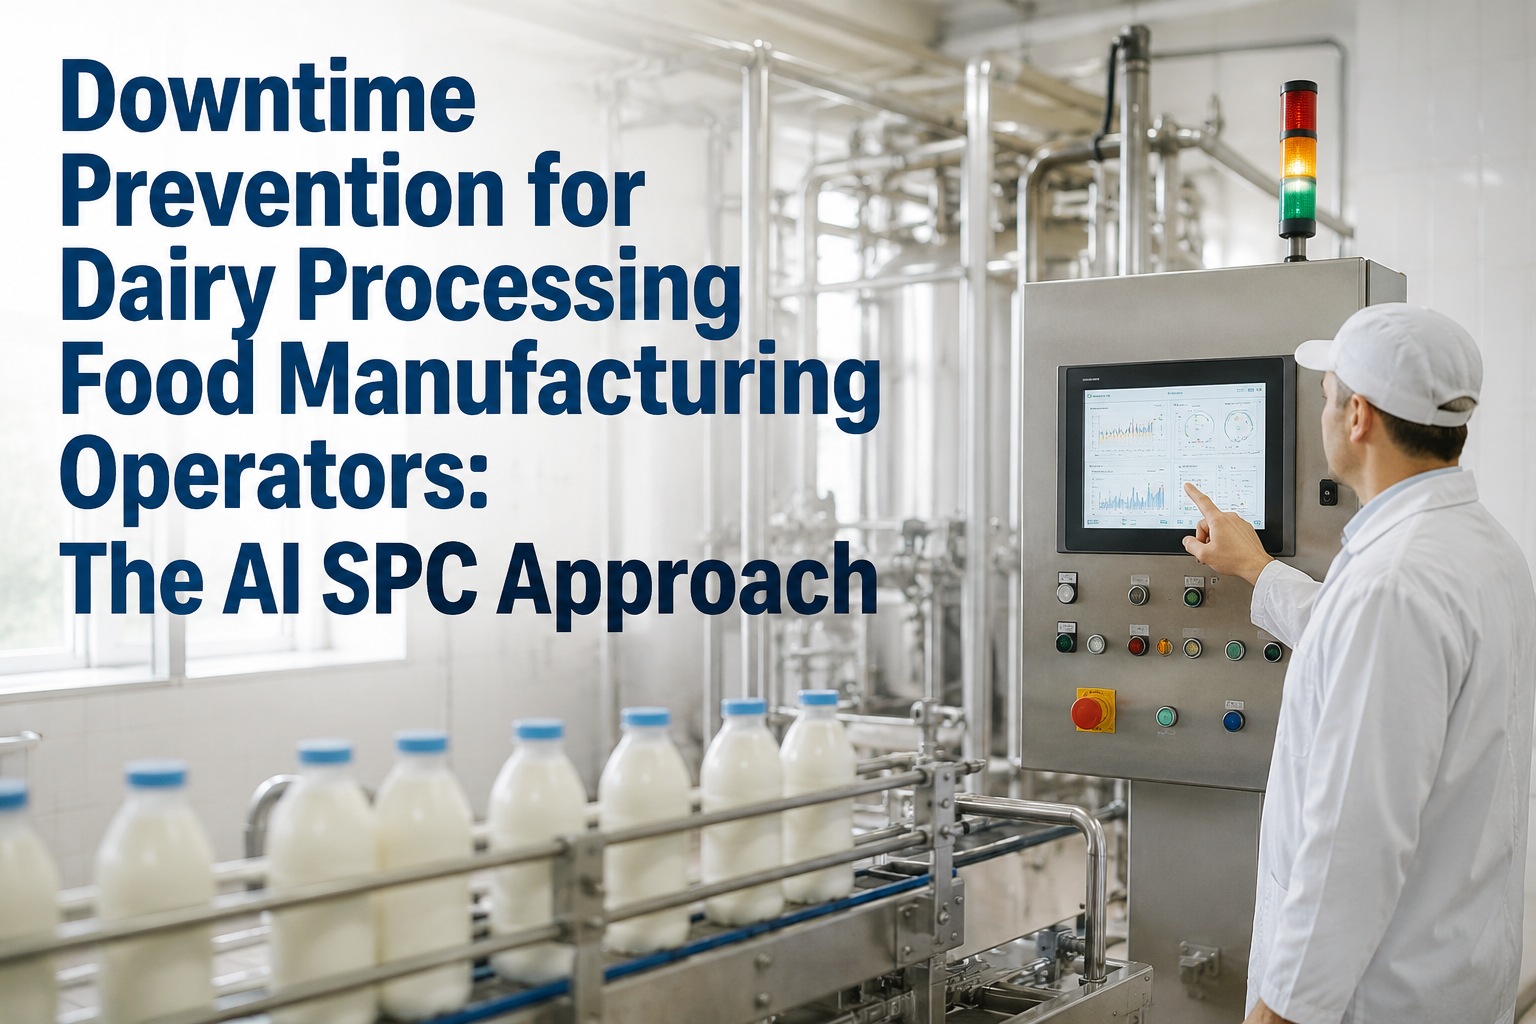
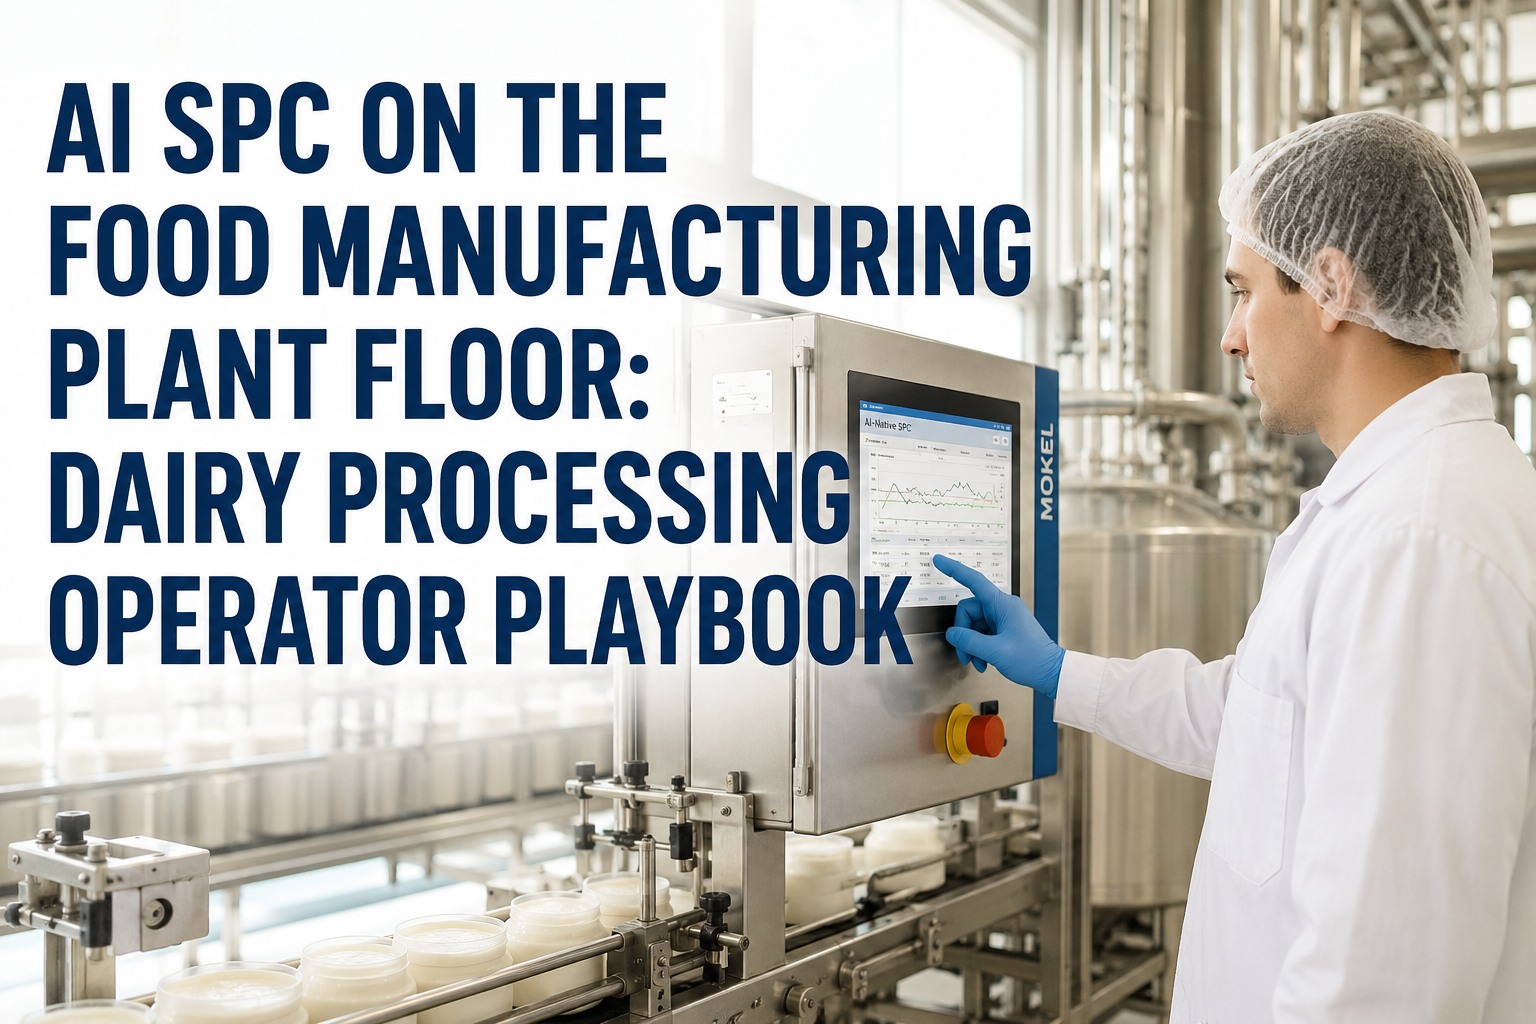
This is the practical guide to AI-native SPC for dairy line operators. It covers the four areas where AI SPC moves the yield needle most: CIP overruns and re-clean cycles, filler line giveaway, predictive maintenance integration, and the process drift that quietly costs 3–6% yield in most dairy plants. Each section is written for the operator running the line — concrete examples, real numbers, no executive abstractions. The goal: by the end of this guide you should know exactly where AI SPC would help on your specific lines and what the 6–12 week deployment would look like at your plant. Book a demo with us to walk through your current CIP and filler data together.
Operator’s Guide · Dairy Processing
Recover 3–6% Yield from CIP, Filler & Process Drift
Most dairy plants lose 3–6% yield to invisible drift — CIP overruns, re-clean cycles, filler giveaway, and process variability that traditional SPC can’t catch. This guide walks operators through where the yield goes and how AI-native SPC recovers it. 6–12 week deployment on your existing PLC/SCADA.
3–6%yield typically recovered
24–48 hrCIP frequency in dairy plants
0.5–2.5%milk losses (large → small dairy)
Where 3–6% yield goes
Recoverable
01
CIP overruns & re-cleans
Extended cycles, failed ATP swabs
0.5–1.5%
02
Filler giveaway
Overfill margin, changeover drift
1.0–2.0%
03
Unplanned maintenance stops
Pump seals, valve wear, sensor drift
1.0–2.0%
04
Process drift correction
Temperature, flow, pressure variance
0.5–1.0%
What This Guide Covers
Four sections, each addressing one source of yield loss with concrete examples and AI SPC mechanics. The sections build sequentially — CIP first because it’s the highest-frequency operation in dairy (every 24–48 hours), filler second because it’s the most direct yield lever, predictive maintenance third because it prevents the unplanned downtime that compounds the other losses, and the yield math last to tie the recovery numbers to your specific plant.
01
CIP Overruns & Re-Clean Cycles
Condition-based vs time-controlled cleaning. Turbidity and conductivity analytics. ATP-pass prediction.
0.5–1.5%
02
Filler Line Optimization
Giveaway reduction, changeover stability, weight variance tracking, drip and seal integrity.
1.0–2.0%
03
Predictive Maintenance Integration
Pump seal health, heat exchanger fouling, valve wear, sensor drift detection.
1.0–2.0%
04
Process Drift & Yield Math
Temperature, flow, pressure variance correction. How the 3–6% total ties to your plant.
0.5–1.0%
Section 01 — CIP Overruns & Re-Clean Cycles
CIP is the highest-frequency operation in a dairy plant — cycles run every 24–48 hours, and every minute of CIP cycle is a minute the line isn’t producing. Most plants run time-controlled CIP: fixed step durations regardless of actual fouling state. This wastes time when soil load is light and fails to clean adequately when soil load is heavy — either way, yield loss. Re-cleans happen when ATP swabs fail post-CIP or when turbidity/conductivity rinse-out hasn’t reached acceptance criteria. A typical re-clean costs 30–90 minutes of lost production plus chemical and water consumption. AI SPC turns CIP from time-controlled to condition-based, monitoring turbidity, conductivity, and temperature in real time to right-size each cycle.
A
Where CIP overruns originate
Heavy soil load: Previous production created more fouling than baseline cycle assumes. Time-controlled cycle ends before clean is complete → ATP fails → re-clean.
Caustic concentration drift: NaOH delivery system runs lean. Cycle hits time target but conductivity proves chemistry was below spec.
Temperature shortfall: Heat exchanger fouling on CIP supply reduces actual circulation temperature 5–10°C below setpoint. Cleaning kinetics drop sharply.
Inadequate rinse: Final rinse conductivity stays above the 30 µS/cm threshold. Caustic carryover into next batch.
Equipment scaling: Mineral buildup on stainless surfaces. Acid wash undersized for actual scale level. Bio-film risk rises silently.
B
What AI-native SPC does differently
Condition-based cycle termination: Each step ends when turbidity, conductivity, or temperature signals indicate clean is complete — not when timer expires.
Soil load prediction: Models incoming soil load from prior production (product type, hold time, fat content) to right-size caustic concentration and contact time per cycle.
ATP-pass probability: AI predicts post-CIP ATP swab result before the swab is taken. Operators see “ATP pass probability 94%” or get alerted to extend wash before re-clean is triggered.
Re-clean prevention: When AI detects the patterns that historically led to ATP failures, it recommends specific step adjustments (extend caustic, increase temperature, repeat rinse) to prevent the re-clean.
Chemical right-sizing: Across 200+ cycles per quarter, AI tracks chemical usage vs actual cleaning need and recommends concentration adjustments that maintain efficacy while reducing chemical cost.
Want to see CIP analytics applied to your last 90 days of cycle data? Book a demo with us — we’ll connect to a sample of your historian and show where condition-based cycles would have saved time and prevented re-cleans.
Section 02 — Filler Line Optimization
The filler line is where yield turns into revenue. Every gram of overfill is product given away free. Every underfill is a recall risk. Every changeover that takes 15 extra minutes is production lost. Filler giveaway typically runs 1–3% above target weight in dairy plants because operators set the overfill margin conservatively to avoid underfill complaints. AI-native SPC tightens the target distribution so overfill margin can be reduced safely, recovering 1–2% yield directly to the bottom line.
A
Where filler yield is lost today
Conservative overfill margin: Operators set fill target 1.5–3% above declared weight to ensure underfill never happens. Wider target distribution → more giveaway.
Piston wear drift: Piston seals wear over a run, causing fill volume to drift higher gradually. Static SPC catches the drift only when it crosses a hard limit.
Product viscosity variation: Yogurt, sour cream, and other viscous products fill differently as temperature shifts 1–3°C across a shift. Most fillers don’t compensate.
Headspace inconsistency: Carton or bottle headspace variation causes weight checkweigher inconsistency. Operators add overfill margin to compensate.
Changeover variability: First 30–60 minutes after a changeover see wider fill weight distribution as the line stabilizes. Lost yield concentrated here.
Seal & drip losses: Drip from nozzles between fills, seal residue, partial-fill rejects — small per-unit losses that compound across millions of units.
B
How AI SPC tightens the filler distribution
Adaptive fill target: AI calculates the minimum overfill margin that maintains 99.99% above-declared compliance — typically 0.8–1.2% instead of the 1.5–3% operators set manually.
Piston wear detection: Pattern recognition catches gradual fill volume drift signatures before they cross alarm limits. Operators adjust setpoint or schedule piston seal replacement before yield is lost.
Temperature-compensated fills: AI predicts viscosity changes from product temperature and adjusts piston stroke or fill time setpoints automatically to maintain weight target.
Changeover stabilization: AI recognizes changeover signature and tightens monitoring during the first 30–60 minutes, flagging stabilization issues that historically caused giveaway spikes.
Drip and reject tracking: Integration with checkweigher and reject station data identifies which positions on multi-head fillers contribute most to losses.
Section 03 — Predictive Maintenance Integration
Unplanned maintenance stops cost dairy plants 1–2% of annual capacity. Pump seal failure on a CIP supply pump means a delayed clean and rushed cleanup. Heat exchanger fouling reduces capacity gradually until throughput drops 10–20%. Valve seat wear on a process valve causes setpoint drift that quality investigates as a control loop problem. AI SPC integrates with predictive maintenance by treating equipment health signals as part of the process variable stream — not a separate system — so operators see equipment risk in the same view as process drift.
PdM 01
CIP & Process Pumps
Signals tracked
Vibration trend
Current draw vs flow
Seal flush water rate
Discharge pressure stability
Yield impact: Prevents emergency shutdowns mid-shift & failed CIP cycles
PdM 02
Heat Exchangers (PHE)
Signals tracked
Approach temperature
Pressure drop across plates
CIP cleaning effectiveness
Heat transfer coefficient
Yield impact: Maintains pasteurization capacity & prevents fouling-driven re-cleans
PdM 03
Process & CIP Valves
Signals tracked
Cycle count
Stroke time variance
Position feedback drift
Seat leakage indicators
Yield impact: Eliminates valve-driven setpoint drift & CIP isolation failures
PdM 04
Sensors & Instrumentation
Signals tracked
Reading variance vs ref probes
Response time degradation
Calibration drift rate
Output signal noise floor
Yield impact: Prevents false alarms & missed drift from sensor degradation
PdM 05
Filler Heads & Nozzles
Signals tracked
Per-head weight variance
Cycle time consistency
Drip detection events
Piston seal wear signature
Yield impact: Catches piston/nozzle wear before giveaway compounds
PdM 06
Conveyors & Drives
Signals tracked
Bearing temperature
Motor current vibration
Speed variance
Belt tension indicators
Yield impact: Prevents line stops from conveyor failures
Walk Through Your Yield Loss Sources
A demo session connects to a sample of your historian data and identifies where the 3–6% yield is going in your specific plant. CIP overruns, filler giveaway, predictive maintenance events, process drift — quantified by source for your environment.
Section 04 — Process Drift & The 3–6% Yield Math
Process drift — temperature, flow, pressure, concentration variances that stay within control limits but shift slowly — quietly costs 0.5–1.0% yield by itself. Combined with CIP, filler, and maintenance losses, the total recoverable yield runs 3–6% in most dairy plants. The math isn’t aspirational — it’s documented per loss source. Plants at the lower end (3%) typically deploy AI SPC on a single line or partial scope. Plants at the higher end (6%) deploy across all major lines with full CIP, filler, and predictive maintenance integration.
Source 01
CIP overruns & re-cleans
0.5–1.5%
Condition-based cycles eliminate fixed-time overruns. ATP-pass prediction prevents re-cleans. Typical baseline: 8–15 re-cleans per quarter, each 30–90 min of lost production.
Source 02
Filler giveaway
1.0–2.0%
Tightened fill distribution. Overfill margin reduced from 1.5–3% to 0.8–1.2% while maintaining 99.99% above-declared compliance. Highest direct revenue impact.
Source 03
Unplanned maintenance stops
1.0–2.0%
Predictive maintenance prevents emergency shutdowns mid-shift. Pump seals, valve wear, heat exchanger fouling caught with intervention windows of 1–4 weeks.
Source 04
Process drift correction
0.5–1.0%
Temperature, flow, pressure variance within control limits but slowly shifting. Pattern detection across Western Electric and Nelson rules catches drift early.
Total recoverable yield
3.0–6.5%
Range depends on baseline state & deployment scope
Reading Your AI SPC Display — Quick Reference
Once AI SPC is live, operators interact with three core display elements: the alert stream (what needs attention now), the control chart view (process trends over time), and the recommendation panel (what to do about it). This quick reference covers what each element shows and how to act on it during a shift.
What you see
Plain-language alerts ranked by severity. Each alert names the equipment, describes the pattern, and recommends an action.
What to do
Act on top-severity alerts first. Use the “recommended action” as the starting point. Mark alerts as actioned, deferred, or not-actionable — the AI learns from your responses.
Element 02
Control Chart View
What you see
Time-series control charts with adaptive UCL/LCL bands. Pattern markers highlight Western Electric and Nelson rule triggers as they occur.
What to do
Scan the chart at start-of-shift and at hourly intervals. Click any pattern marker for the underlying rule explanation and historical similar events.
Element 03
Recommendation Panel
What you see
Specific setpoint or operational recommendations: “Reduce filler target 0.5g” or “Extend caustic wash 90 sec.” Each recommendation shows expected impact.
What to do
Review recommendations at each break. Implement straightforward changes directly; escalate complex changes to supervisor. Log results for AI learning.
Element 04
Shift Handoff Summary
What you see
End-of-shift digest with key events, open alerts, recommendations in progress, and pattern notes from your shift.
What to do
Review with incoming shift operator. Flag any open items requiring continuation. The handoff summary preserves context across shift changes.
Want a walk-through of the operator display on your actual line data? Book a demo with us — we’ll show the three display elements running against a sample of your historian data.
6–12 Week Deployment — Yield Recovery Focus
Deployment runs 6–12 weeks from kickoff to live yield recovery. The phasing prioritizes the four yield loss sources in order: CIP analytics first because cycles run every 24–48 hours and learning accelerates fastest, filler optimization next because the yield impact is most direct, predictive maintenance third, process drift integration last.
Week 1–2
Connection & CIP Baseline
Pre-configured AI server installed in plant network
PLC/SCADA/historian tag mapping for CIP skid and filler
Historical CIP cycle data ingested for baseline
Re-clean events from last 90 days analyzed
Week 3–6
Shadow Mode & Tuning
AI runs alongside existing SPC, no operator action required
CIP condition-based cycle predictions validated against ATP results
Filler adaptive target calculated and reviewed with operators
Predictive maintenance signals correlated with historical failures
Week 7–12
Live Yield Recovery
Operators transition to AI SPC primary view
CIP cycles transition to condition-based termination
Filler overfill margin tightening begins
Quarterly yield review baseline established
Expert Perspective
"The 3–6% yield recovery range in dairy isn’t a marketing claim — it’s documented across plants that fully deploy AI SPC for CIP, filler, predictive maintenance, and process drift. The math is concrete: CIP overruns and re-cleans alone run 0.5–1.5% in most plants because cycles use fixed timers instead of condition-based completion criteria. Filler giveaway runs 1–2% because operators set overfill margin conservatively to avoid underfill complaints. Unplanned maintenance stops contribute another 1–2% through emergency shutdowns that disrupt CIP and production schedules. Process drift — the subtle temperature, flow, pressure variances that stay within control limits — quietly costs another 0.5–1%. The plants that hit the higher end of the range (closer to 6%) integrate all four sources. Plants at the lower end typically deploy partially — CIP-only or filler-only. The CIP integration delivers fastest results because cycles run every 24–48 hours so the AI accumulates learning quickly. Operators see the value within the first two months of live operation, which keeps engagement high through the rest of the deployment."
— Dairy Operations Practice, 2026 industry perspective
3–6%
total recoverable yield across four sources
24–48 hr
CIP cycle frequency drives fast AI learning
6–12 wk
deployment to live yield recovery
Map Your Specific Yield Recovery Opportunity
A demo session connects to your historian, walks through your CIP cycle history and filler line data, and identifies the specific yield recovery quantified by source for your plant. No procurement of the software required to participate.
Frequently Asked Questions
Is 3–6% yield recovery realistic for our plant specifically?
The range covers most dairy plants but your specific outcome depends on three factors. First, your starting baseline — plants with frequent re-cleans, wide filler giveaway, or aging maintenance backlog have more recoverable yield. Second, your deployment scope — full integration across CIP, filler, and predictive maintenance delivers the higher end (5–6%), while partial deployments deliver less (3–4%). Third, your operator adoption pace — faster transition to AI recommendations accelerates recovery. The demo session reviews your specific baseline data (CIP cycle history, filler giveaway distribution, maintenance event log) and projects a realistic range for your environment before any deployment commitment.
How does condition-based CIP differ from what our current CIP system does?
Most CIP systems run time-controlled cycles — each step has a fixed duration regardless of actual cleaning need. Some modern systems have endpoint conductivity monitoring that ends rinse steps when conductivity drops below threshold, which is a partial form of condition-based control. AI-native condition-based CIP goes further: it monitors turbidity, conductivity, temperature, and flow continuously across all steps; predicts soil load from prior production data; adjusts caustic concentration, contact time, and rinse duration to current conditions; and validates ATP-pass probability before the legal swab is taken. The result is shorter average cycles when soil is light, extended cycles when soil is heavy, and significantly fewer re-cleans triggered by ATP failures.
Can we just deploy on the filler line first and add CIP later?
Yes — phased deployment is common. Filler-only deployment typically delivers 1–2% yield recovery within the first quarter, which builds the business case for CIP and predictive maintenance integration in subsequent phases. The trade-off: CIP integration would have started accumulating learning data earlier (cycles run every 24–48 hours), so adding it later means a 4–6 week learning phase before CIP yield recovery starts. Most plants we work with deploy CIP and filler together because the integration cost is similar and the combined yield impact accelerates payback. Predictive maintenance can be added as a third phase once the AI infrastructure is established.
How does this fit with our existing CIP supplier (Ecolab, Diversey, etc.)?
Complementary — AI SPC works with whichever chemical supplier and CIP equipment you have today. The integration reads CIP cycle data (turbidity, conductivity, temperature, flow, time) from your existing CIP skid PLC and historian. Chemical supplier specifications (caustic concentration ranges, acid concentration ranges, temperature targets) become inputs to the AI’s condition-based optimization. Many of our plants work with major chemical suppliers (Ecolab, Diversey, JohnsonDiversey, Birko) and we’ve seen condition-based optimization reduce chemical usage by 10–20% on average — which suppliers can either view as competitive risk or as a value-add for their long-term customer relationships. Plants typically inform their CIP chemical supplier about AI deployment as a partnership signal.
What happens to our existing SPC charts and quality records?
They continue. AI SPC complements your existing quality system rather than replacing it. Legal records under PMO and FSMA 21 CFR 117 Subpart C continue through your existing legal recorders and QMS. Static SPC charts that operators are familiar with continue to display for the variables where static limits work fine. AI-native SPC adds adaptive limits, pattern detection, and recommendations on top of the existing framework. Operators transition gradually — they can switch between static and AI views during the shadow-mode phase, and most operators choose the AI view by week 8–10 because the alert quality and recommendation specificity are clearly better. Quality records become richer because AI pattern detection events feed into preventive control documentation alongside traditional out-of-spec records.
Does predictive maintenance require new sensors we don’t have today?
In most cases, no. iFactory’s predictive maintenance integration uses existing PLC and SCADA data: motor current, pump discharge pressure, valve stroke times, temperature differentials across heat exchangers, sensor reading variance. These data points are already collected by your control system but typically aren’t used for predictive maintenance because the analysis layer doesn’t exist. AI SPC adds the analysis layer. For specific failure modes that require additional instrumentation (vibration analysis on critical pumps, ultrasonic detection on valve seats, advanced bearing temperature sensors), the deployment includes recommendations on which 5–10 additional sensors would deliver the highest ROI for your specific equipment portfolio. The base deployment doesn’t require any new sensors.