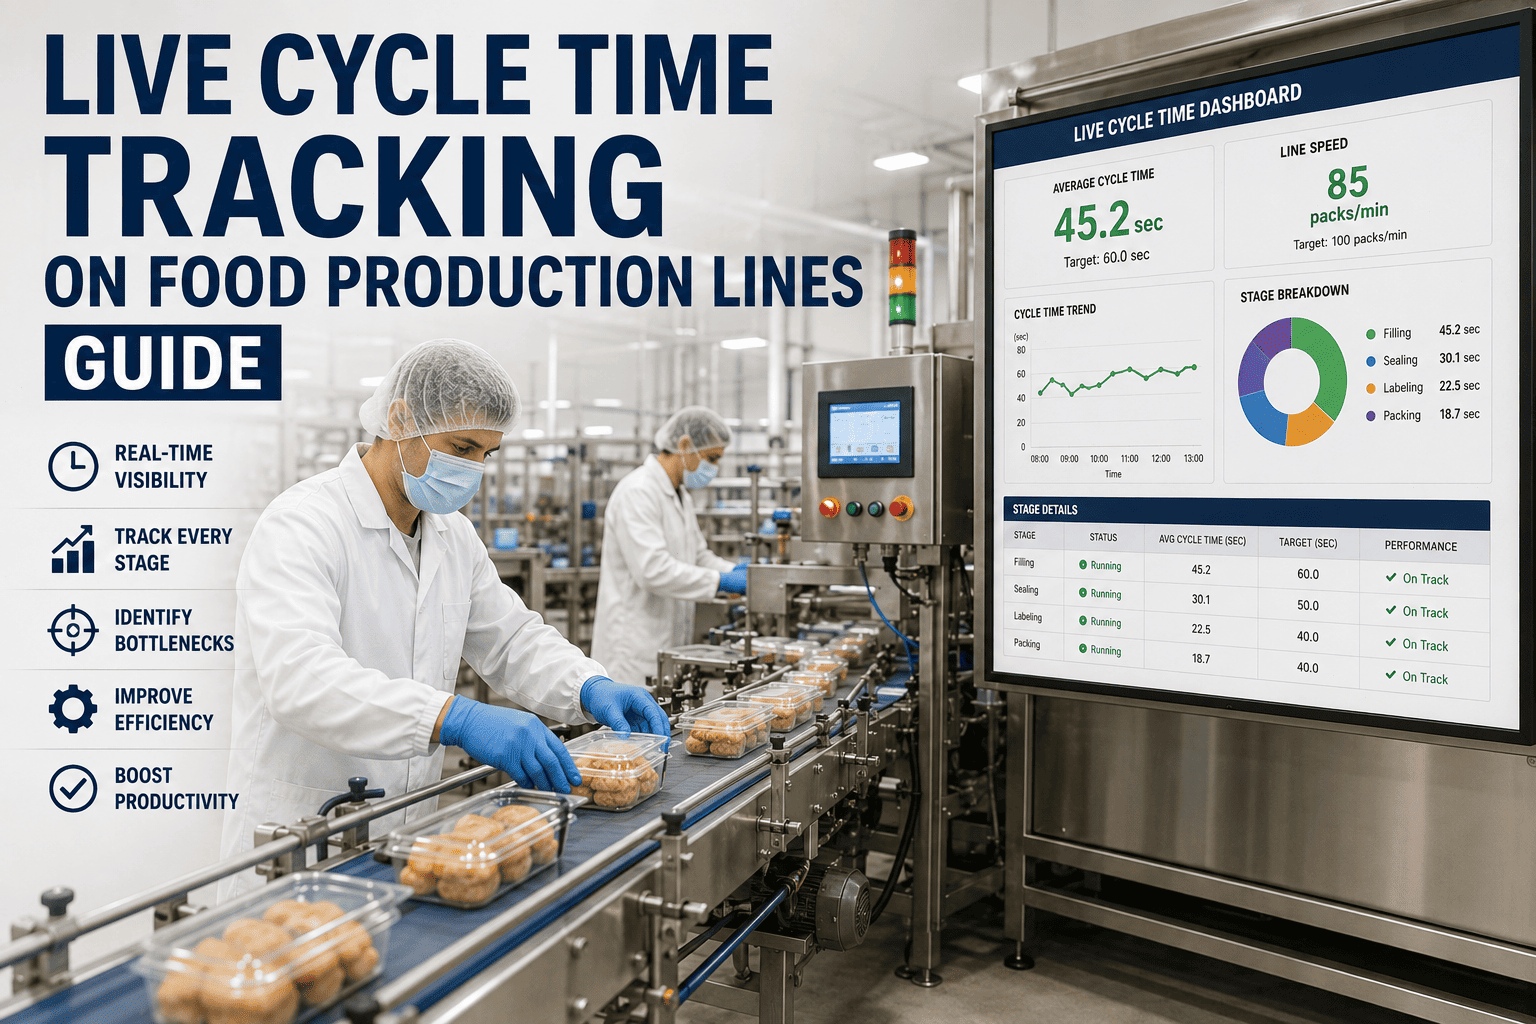
Cycle time is the quiet number that decides whether a shift hits target or falls short, and yet most food plants only look at it after the fact, once a shift report shows output below plan and someone has to reconstruct what happened hours earlier. By the time that reconstruction happens, the slow cycles have already cost the shift its output, and the actual cause — a worn part, a filling head running a half second slower, an operator working around a jam — is buried somewhere in a shift nobody was watching in real time. Live cycle time tracking closes that gap by surfacing the slowdown while it's still happening. Reach out to our team if you want to see what this looks like on your specific lines.
Production Analytics · Food Manufacturing
Live Cycle Time Tracking: Catching Slow-Cycle Patterns Before They Cost a Shift
Capture actual cycle time against ideal, in real time, and expose the creeping slowdowns and recurring patterns that compound into missed shift targets long before the end-of-shift report ever shows it.
Why It's Worth Watching
What Cycle Time Actually Drives Downstream
Compounding Loss
A half-second slowdown per cycle sounds trivial until it's multiplied across thousands of cycles in a single shift
Hidden Until Shift-End
Without live tracking, a gradual slowdown often isn't visible until the shift total comes in under target
Early Warning Signal
A rising cycle time trend frequently precedes a full stoppage, giving maintenance a window to intervene first
The Baseline Concept
What "Ideal Cycle Time" Actually Means in Practice
Ideal cycle time is the fastest a machine or line can complete one unit of work under normal operating conditions, without breakdowns, minor stops, or speed loss. It's the number the entire OEE calculation is built on, and it's also the number most plants set once during commissioning and never revisit. Actual cycle time, tracked continuously, is what really happened on that specific cycle — and the gap between the two, measured live rather than in aggregate, is where the useful information lives. A shift average that looks acceptable can still hide long stretches of degraded performance offset by a few unusually fast cycles, which is exactly the kind of pattern only live, cycle-by-cycle tracking will reveal.
See the Pattern, Not Just the Average
iFactory Tracks Every Cycle, Not Just the Shift Total
Get a live view of actual versus ideal cycle time by line, machine, and SKU, with alerts the moment a pattern starts trending away from normal, instead of waiting for the shift report to tell the story after it's too late to act.
Three Patterns Worth Knowing
How Slow-Cycle Problems Actually Show Up on a Line
The Creeping Slowdown
Cycle time drifts upward gradually over hours, often from mechanical wear, a partially clogged nozzle, or friction building up somewhere in the mechanism. It's the hardest pattern to catch without live tracking because no single cycle looks alarming on its own.
The Sudden Cliff
Cycle time jumps sharply at a specific moment and stays elevated, typically pointing to a component failure, a jam that partially cleared, or an operator working around a fault without formally logging a stop.
The Recurring Sawtooth
Cycle time oscillates in a repeating pattern tied to a specific point in the process, often a changeover step, a manual feed interval, or a recurring micro-stop that's small enough to go unlogged individually but adds up significantly over a shift.
The Difference in Practice
Planned Cycle Time Review vs. Live Tracking
| Aspect | End-of-Shift Review | Live Tracking |
|---|---|---|
| When a slowdown is noticed | Hours after it started, if at all | Within minutes of the trend starting |
| Root cause traceability | Reconstructed from memory and logs | Tied directly to timestamp and machine state |
| Ability to intervene mid-shift | Generally not possible | Supervisor can act before the shift ends |
| Pattern visibility | Averages can mask sub-shift variation | Cycle-by-cycle view exposes the actual shape |
Where This Pays Off
Real Use Cases for Live Cycle Time Data
Predictive Maintenance Triggers
A steadily rising cycle time on a specific machine, even within acceptable tolerance, often signals wear that maintenance can address during a planned window rather than an unplanned breakdown.
Shift-to-Shift Performance Comparison
Comparing live cycle time patterns across shifts on the same line and product isolates whether a performance gap is operator technique, equipment condition, or something environmental.
Changeover Optimization
Tracking cycle time recovery speed immediately after a changeover highlights which changeovers consistently take longer to stabilize than others, pointing to a specific setup step worth reviewing.
New Operator Ramp-Up Tracking
Live data shows how quickly a new operator's cycle times converge toward the line average, giving training teams an objective measure of ramp-up progress instead of a subjective impression.
Averages lie by omission. I've seen shifts that hit their overall cycle time target on paper while actually running significantly degraded for the first four hours and then compensating with an unsustainable fast stretch near the end, which usually means someone skipped a quality check to catch up. You only see that story in the cycle-by-cycle data, never in the shift summary. If a plant is only reviewing averages, they're seeing the outcome without ever seeing the actual behavior that produced it.
Ingrid Alámo-Petrov
Continuous Improvement Lead · 14 years in food and beverage manufacturing operations
Common Questions
Live Cycle Time Tracking — Frequently Asked
What data source is needed to track cycle time live rather than in a shift report?
Live cycle time tracking typically pulls from a PLC signal, an encoder pulse, or a discrete sensor that marks the completion of each unit or cycle, fed continuously into a monitoring system rather than aggregated and reviewed at shift end. Most modern PLCs already generate this signal for other control purposes, so the integration work is often about routing existing data into a live dashboard rather than adding entirely new sensors to the line.
How is a meaningful slowdown distinguished from normal cycle-to-cycle variation?
A well-tuned system establishes a statistical baseline for normal variation on each specific line and product, then flags deviations that exceed that baseline by a meaningful margin over a sustained window, rather than reacting to every single slightly-slow cycle. This avoids alert fatigue while still catching genuine trends. The threshold typically gets refined over the first few weeks of live use as the system learns what normal variation actually looks like for that specific line.
Does live cycle time tracking replace the need for OEE reporting?
No, the two are complementary rather than competing. OEE gives you the aggregate performance picture across availability, performance, and quality for reporting and trending purposes, while live cycle time tracking gives you the real-time, granular view needed to actually catch and act on a developing problem while the shift is still running. Contact our support team to see how the two connect in practice.
Can this level of tracking work across multiple lines with different products?
Yes, cycle time baselines are typically set per line and per product combination, since ideal cycle time naturally varies by SKU, and the system compares live performance against the correct baseline for whatever is currently running. This allows a supervisor to view a consistent format across every line on the floor even though the underlying ideal numbers differ significantly between products.
Who on the floor actually acts on live cycle time alerts?
In most plants, the line supervisor is the first responder to a live cycle time alert, deciding whether it warrants a maintenance call, an operator check-in, or simply continued monitoring. Maintenance teams typically get looped in for alerts tied to specific equipment trends rather than every individual deviation, keeping the alert volume manageable for each role. Book a demo to see the alerting workflow in action.
Stop Finding Out After the Shift Ends
See Cycle Time Slowdowns While There's Still Time to Act
iFactory tracks actual versus ideal cycle time live, by line and by SKU, so your supervisors catch the pattern while the shift is still running, not after the report lands.