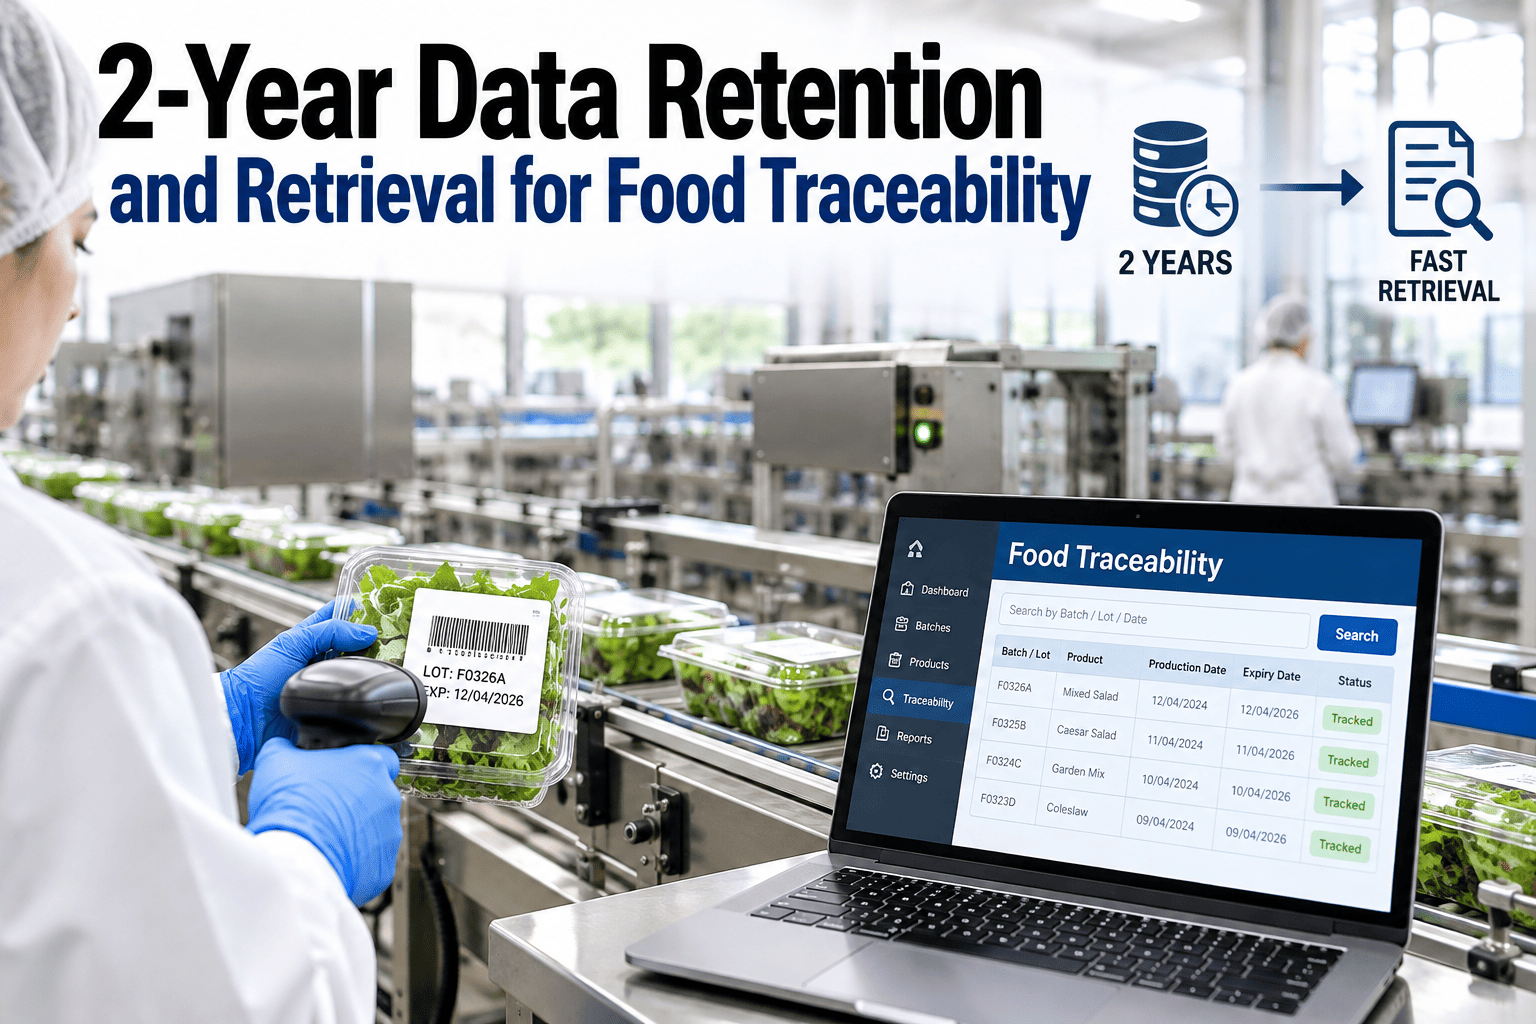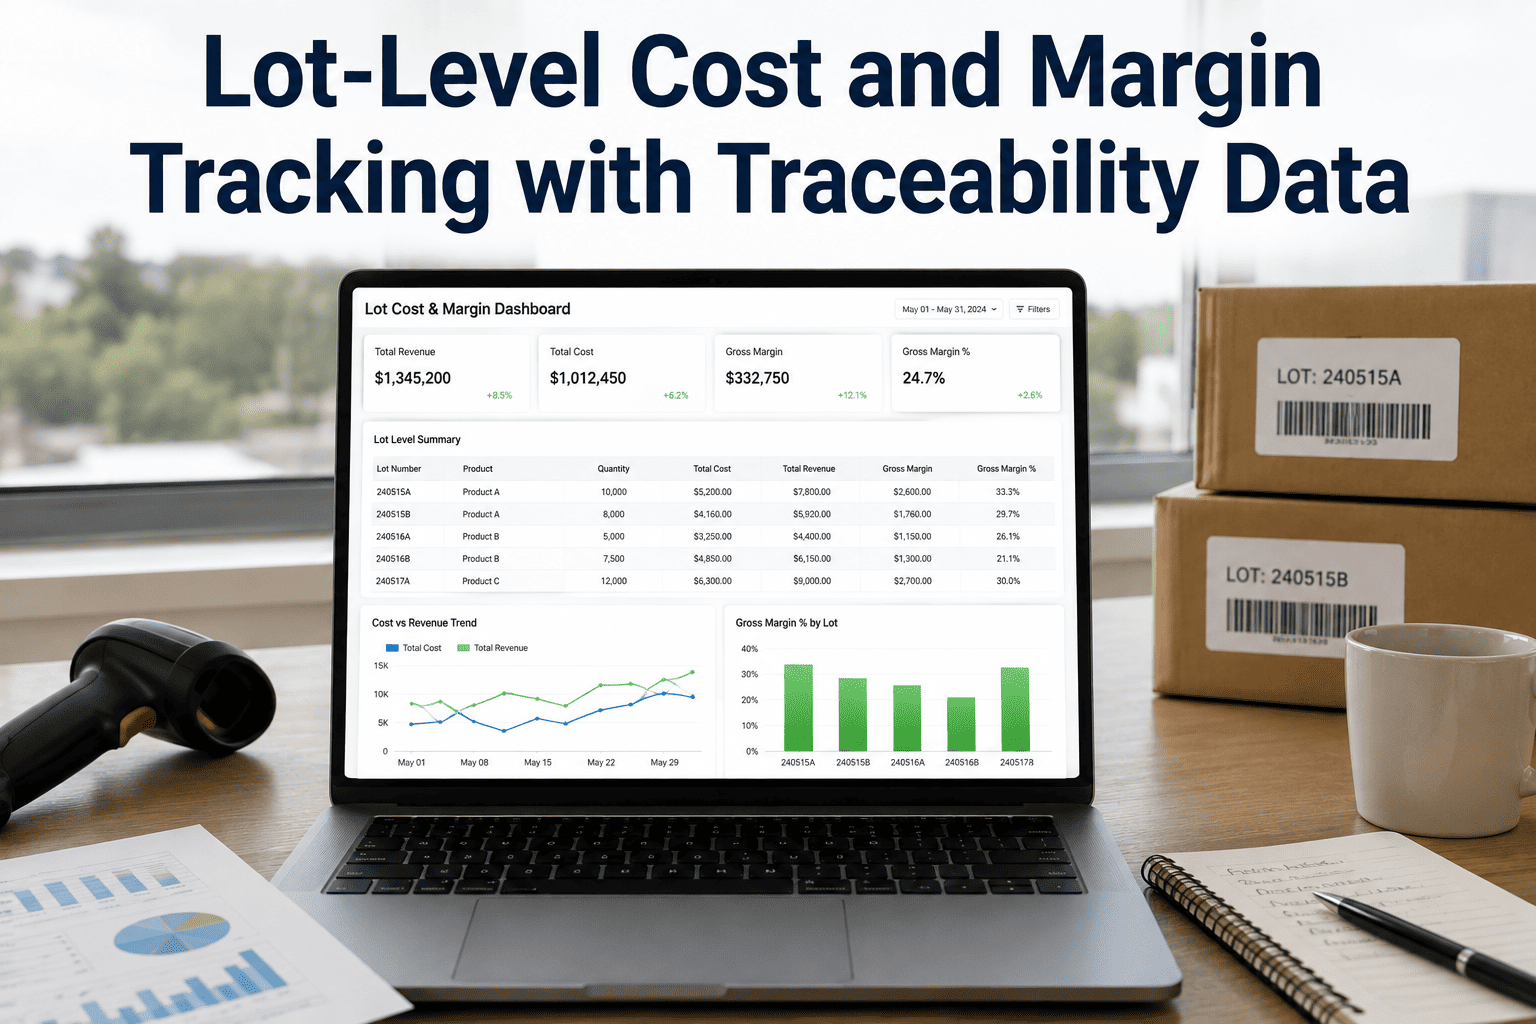
Ask a plant controller what a single lot of finished product actually cost to make, and the honest answer is usually a rough allocation built from monthly averages rather than anything tied to that specific lot's real ingredient cost, yield, and downtime. Traceability systems already capture the raw material lots, quantities, and timestamps behind every batch, yet that data almost never makes it into a margin number finance can trust. The gap is not a data problem so much as a connection problem — the same batch record that proves where a lot came from can just as easily calculate what it cost, if someone builds the bridge between traceability and cost accounting. iFactory closes that bridge directly, turning every batch record into a lot-level margin figure finance can actually use, and our team can show you what that looks like against your own batch records.
Turn Every Batch Record Into a Finance-Ready Margin Number
The same traceability data that proves lot genealogy also carries the ingredient cost, yield, and downtime detail needed to calculate real per-lot margin, automatically, without a separate costing exercise.
Why Lot-Level Margin Is Almost Never Calculated
Finance teams want lot-level margin. Plant systems have the underlying data. The two rarely meet because the connection between traceability records and cost accounting was never built.
Monthly cost averaging
Standard cost is applied uniformly across a month's production, hiding which specific lots were actually profitable.
Disconnected systems
Traceability data sits in a batch record system while cost data sits in the ERP, with no automatic link between the two.
Manual reconciliation only at month-end
Any lot-level cost view that does exist is built manually, after the fact, too late to influence a production decision.
Yield loss invisible per lot
Scrap and rework are tracked in aggregate rather than tied back to the specific lot that generated them.
From Batch Record to Margin Figure
Every element needed for a real lot-level cost figure is already generated somewhere in the plant during production. The work is in connecting each element to the specific lot it belongs to.
Raw material lot cost capture
Actual purchase cost of every raw material lot consumed is tied to the finished lot it went into, not a blended average.
Yield and scrap attribution
Scrap, rework, and giveaway generated during that specific batch run are attributed to the lot that produced them.
Downtime and labor allocation
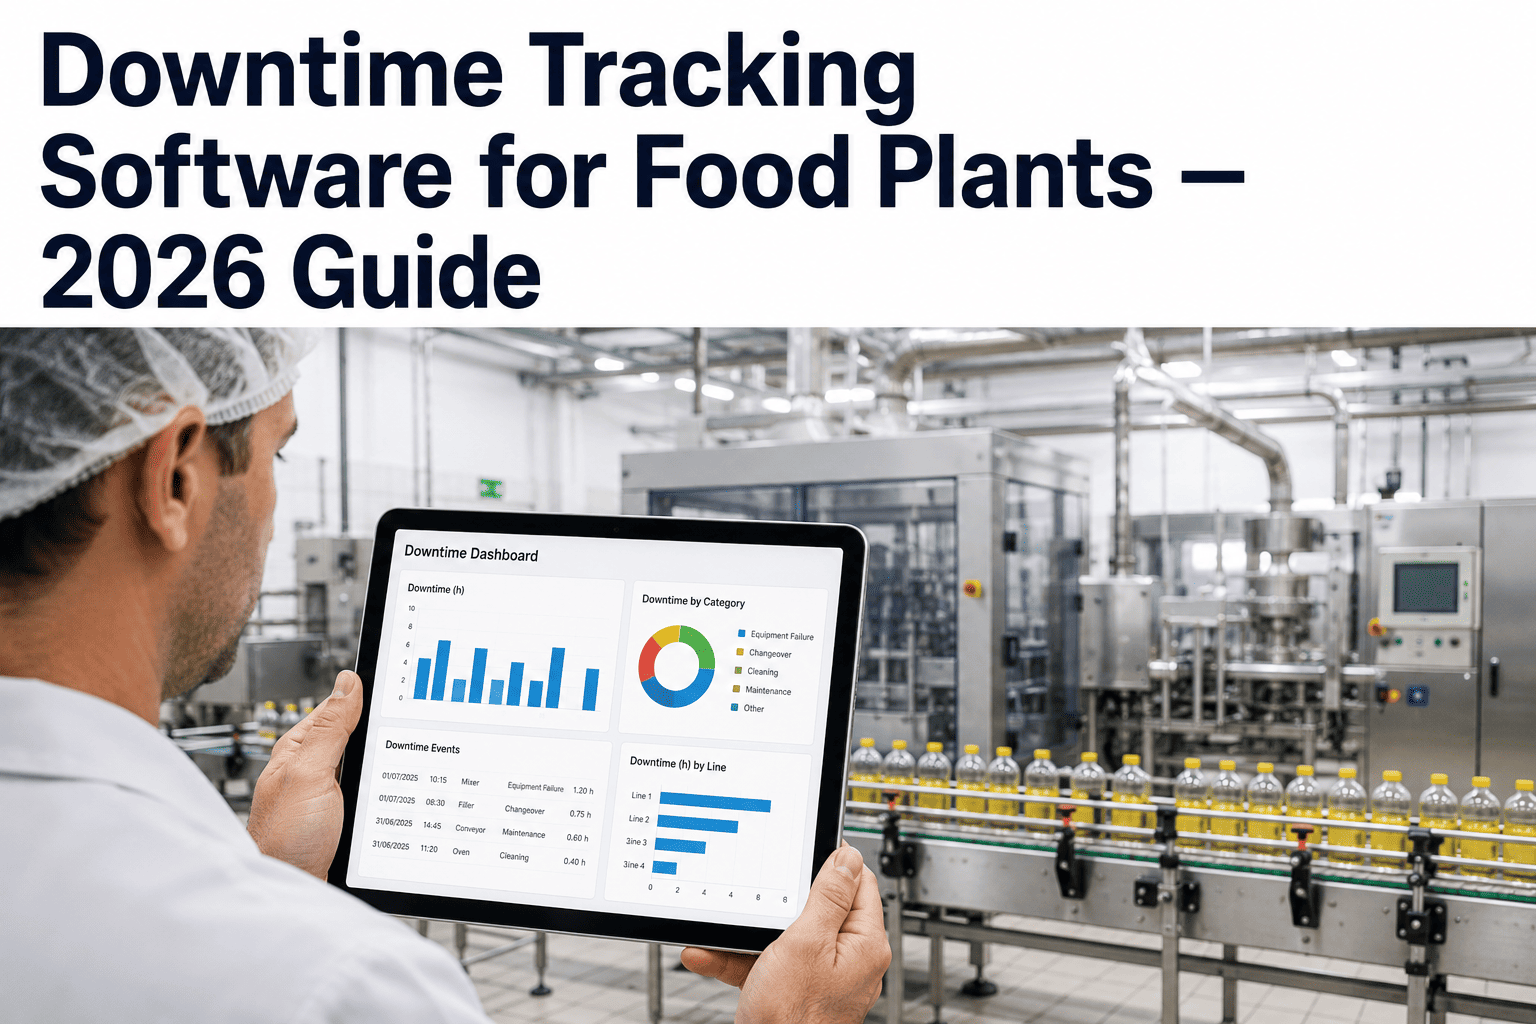
Line downtime and labor hours during the batch window are allocated proportionally to the lot in production.
Margin calculation and dashboard
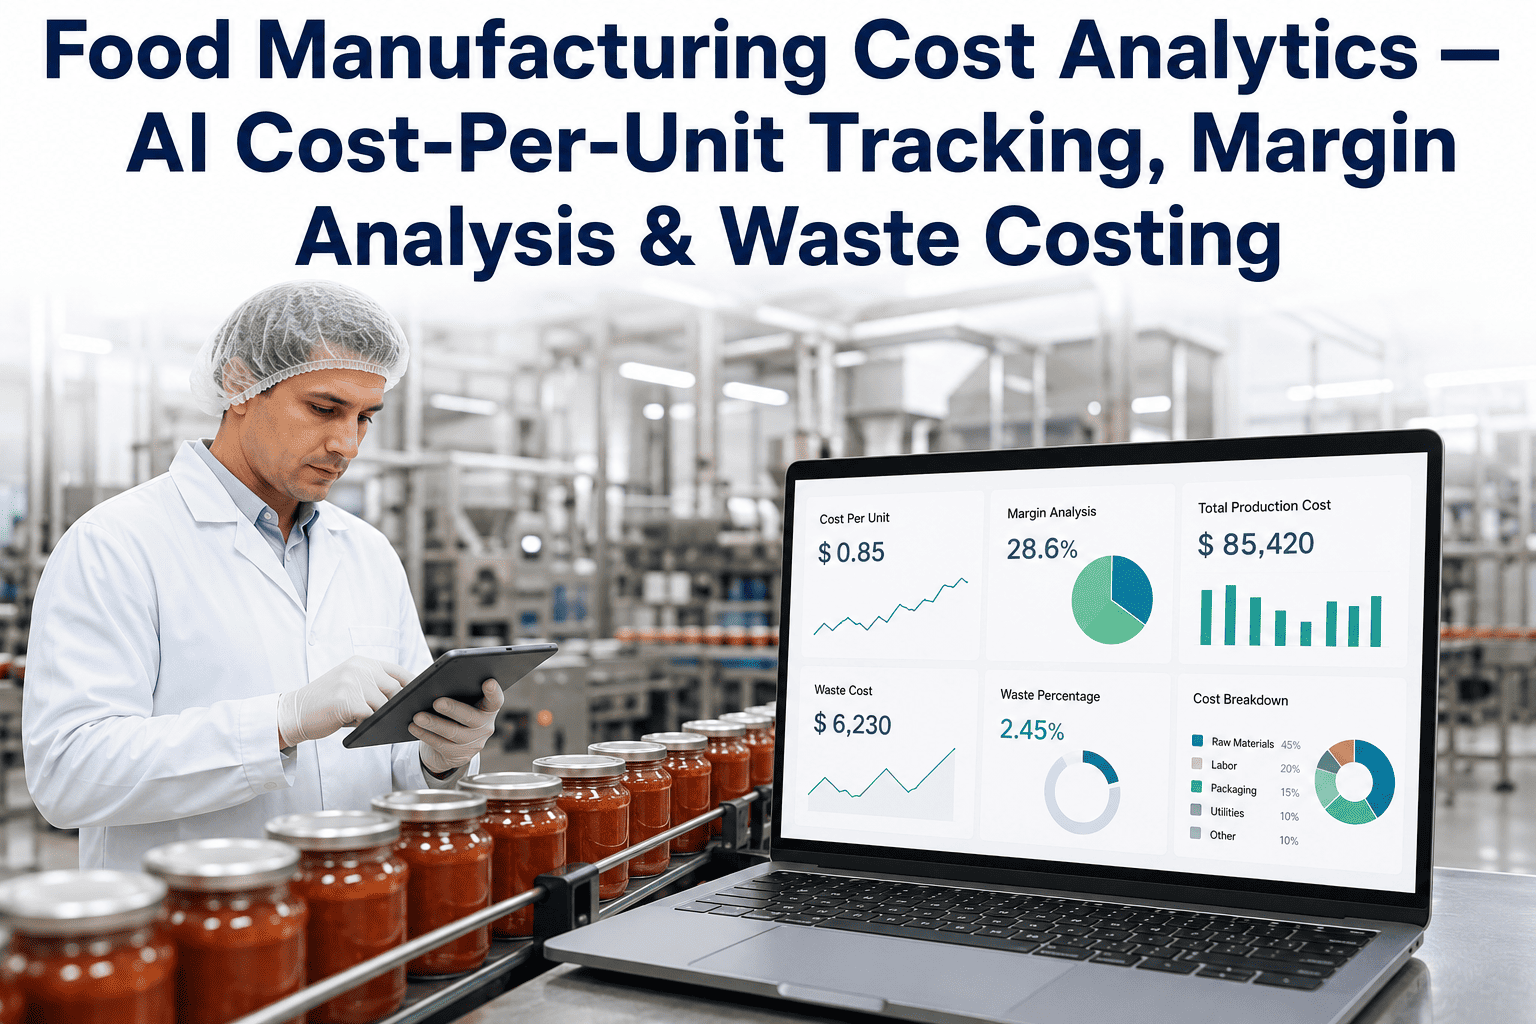
Actual cost is compared to net sales price for that lot, producing a real margin figure finance can review directly.
See Your Own Batch Data as a Margin Dashboard
Bring a sample of recent batch and cost records. We will show you what lot-level margin actually looks like once the connection between traceability and cost is built.
Monthly Standard Cost vs Lot-Level Actual Cost
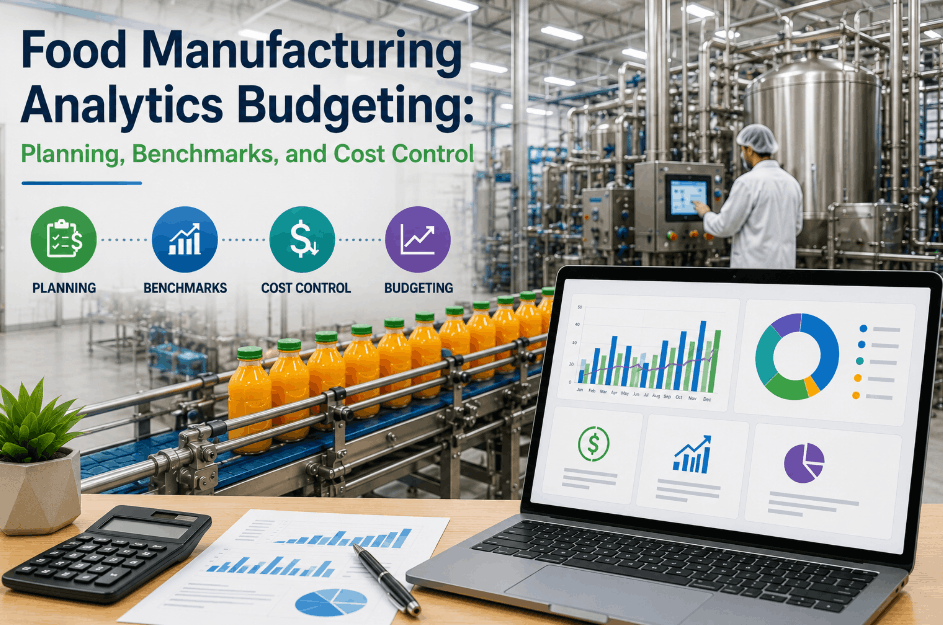
The gap between what a monthly average shows and what a specific lot actually cost is where most unexplained margin variance hides.
- One blended cost figure applied to every lot in the period
- Cannot identify which specific lots underperformed
- Raw material price swings averaged away across the month
- Reviewed only after the accounting period closes
- Every lot carries its own real ingredient, yield, and labor cost
- Underperforming lots identified individually, with root cause data attached
- Raw material price paid at time of consumption reflected accurately
- Available the moment the batch record closes, not at month-end
What a Lot Margin Dashboard Shows
A finance-ready lot margin view pulls together data that already exists across production, quality, and procurement systems into one comparable record per lot.
What Changes Once Lot-Level Margin Is Visible
Plants adopting lot-level cost and margin tracking typically see the following shift within the first two quarters.
Frequently Asked Questions
Do we need to replace our ERP or costing system to get lot-level margin?
No. Lot-level margin tracking reads cost, production, and quality data out of the systems you already run and connects it through the shared lot identifier your traceability system already assigns to every batch. Your ERP remains the system of record for general ledger and standard cost; the lot margin dashboard sits alongside it as a more granular view built specifically for lot-by-lot decisions. Book a demo to see how this connects to your current ERP.
How far back can lot-level margin be reconstructed for historical batches?
Historical reconstruction depends on whether the underlying raw material cost, yield, and sales data still exist in accessible records for those batches. Most plants can reconstruct meaningful lot-level margin for at least twelve to eighteen months of history where batch and cost records were retained, which is usually sufficient to establish a baseline pattern before moving to live, ongoing tracking going forward.
Can this handle shared or blended lots where multiple raw material lots go into one batch?
Yes, this is one of the most common real-world scenarios and the cost allocation logic is built specifically to handle it. When a batch draws from multiple raw material lots, the actual cost of each contributing lot is apportioned according to the quantity consumed, so the finished lot's cost reflects a true weighted blend rather than a single assumed input cost. Talk to our team about your specific blending and formulation setup.
Who typically uses the lot margin dashboard day to day?
Plant controllers and finance analysts use it for margin review and variance investigation, while operations and quality teams use the same underlying data to trace which specific batch conditions drove a low-margin lot. Because both teams are looking at the same lot record rather than reconciled reports from separate systems, conversations between finance and operations about a specific lot become far more direct and evidence-based.
The Bottom Line on Lot-Level Margin
The data needed to calculate real per-lot margin already exists across procurement, production, and quality systems — it has simply never been connected through the lot identifier that traceability systems were built to track in the first place. Making that connection turns a monthly average into a number finance can actually act on, lot by lot, the same day the batch closes.
See Real Lot-Level Margin on Your Own Production Data
Book a 30-minute call. Bring a sample batch record and its underlying cost data, and we will show you the margin figure hiding inside it.