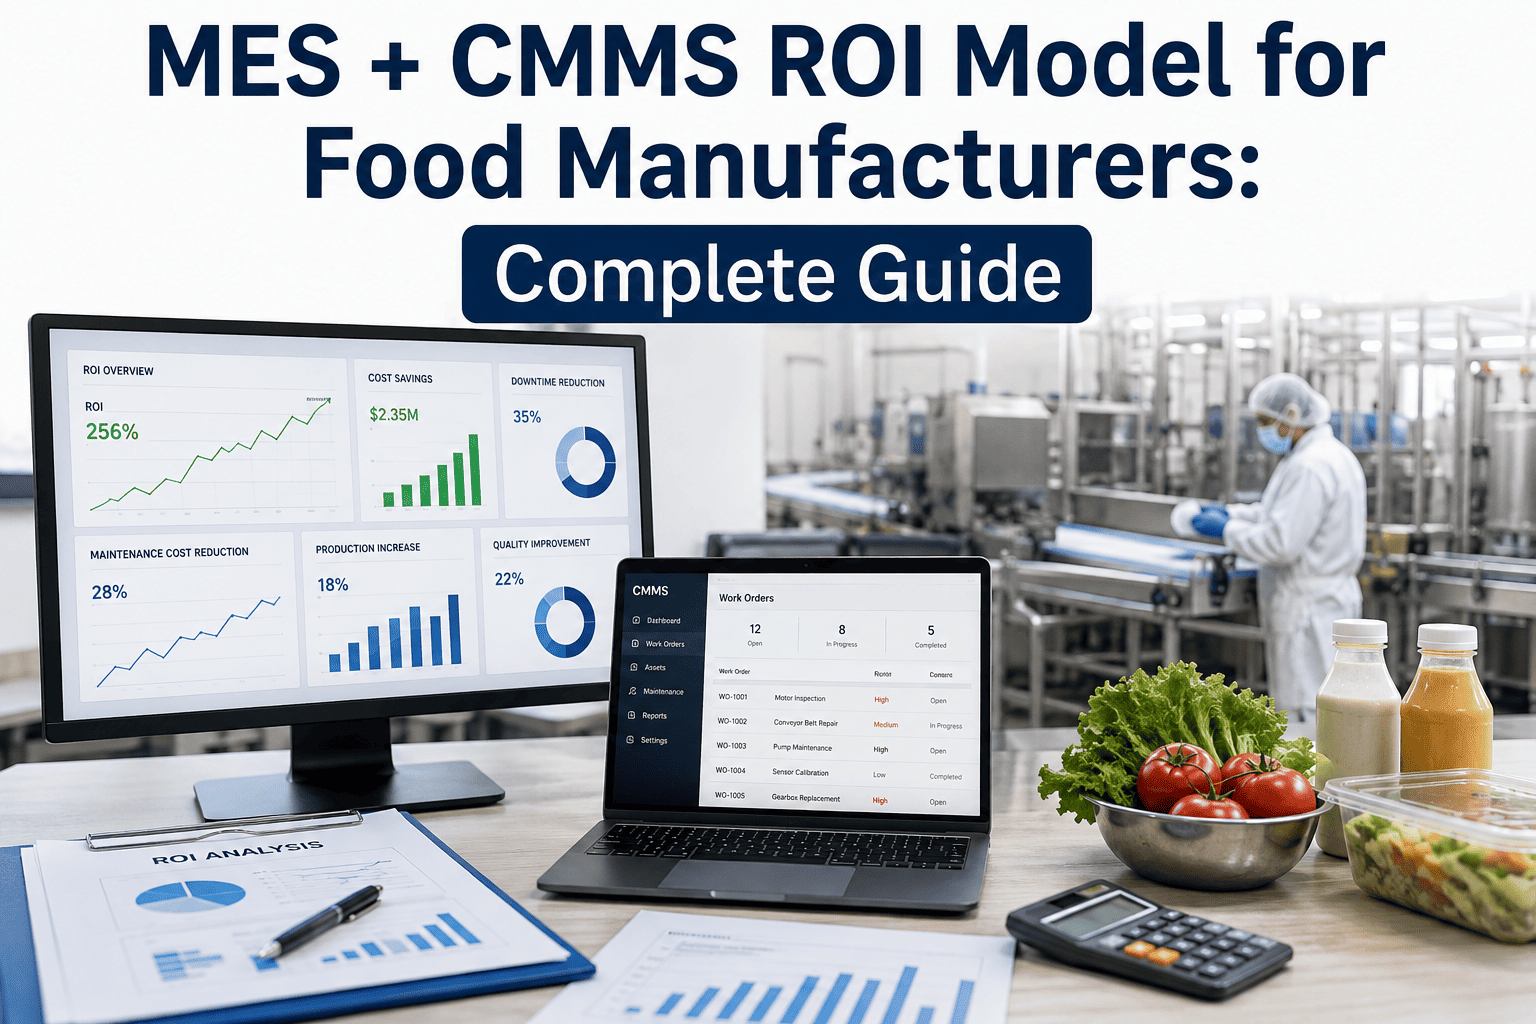
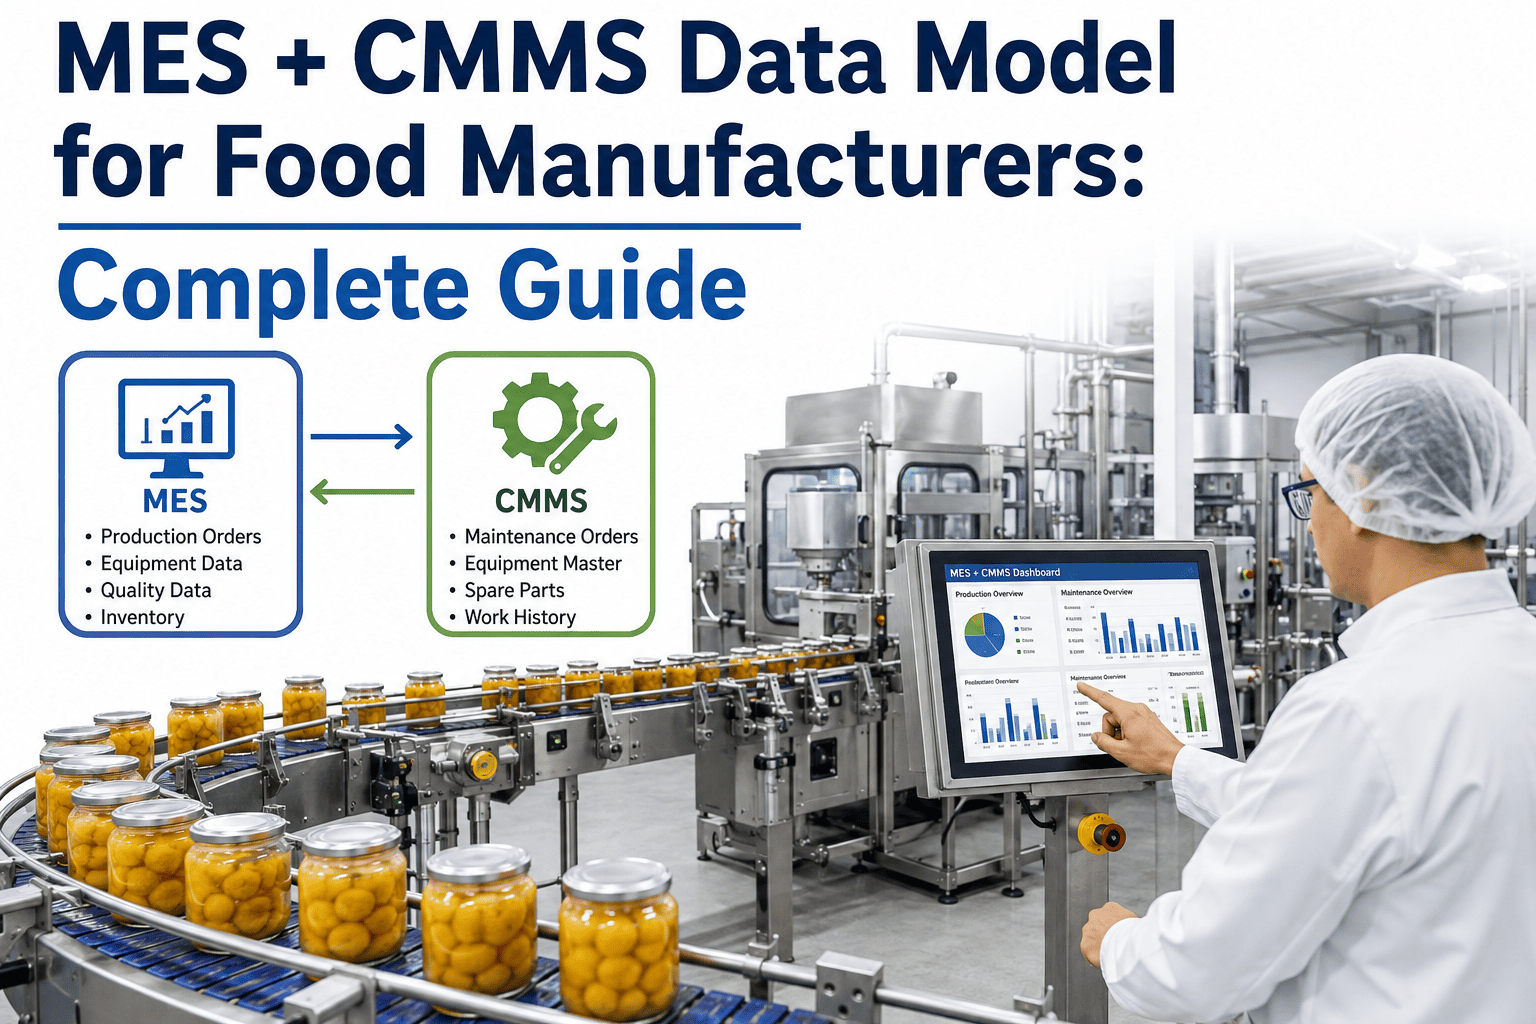
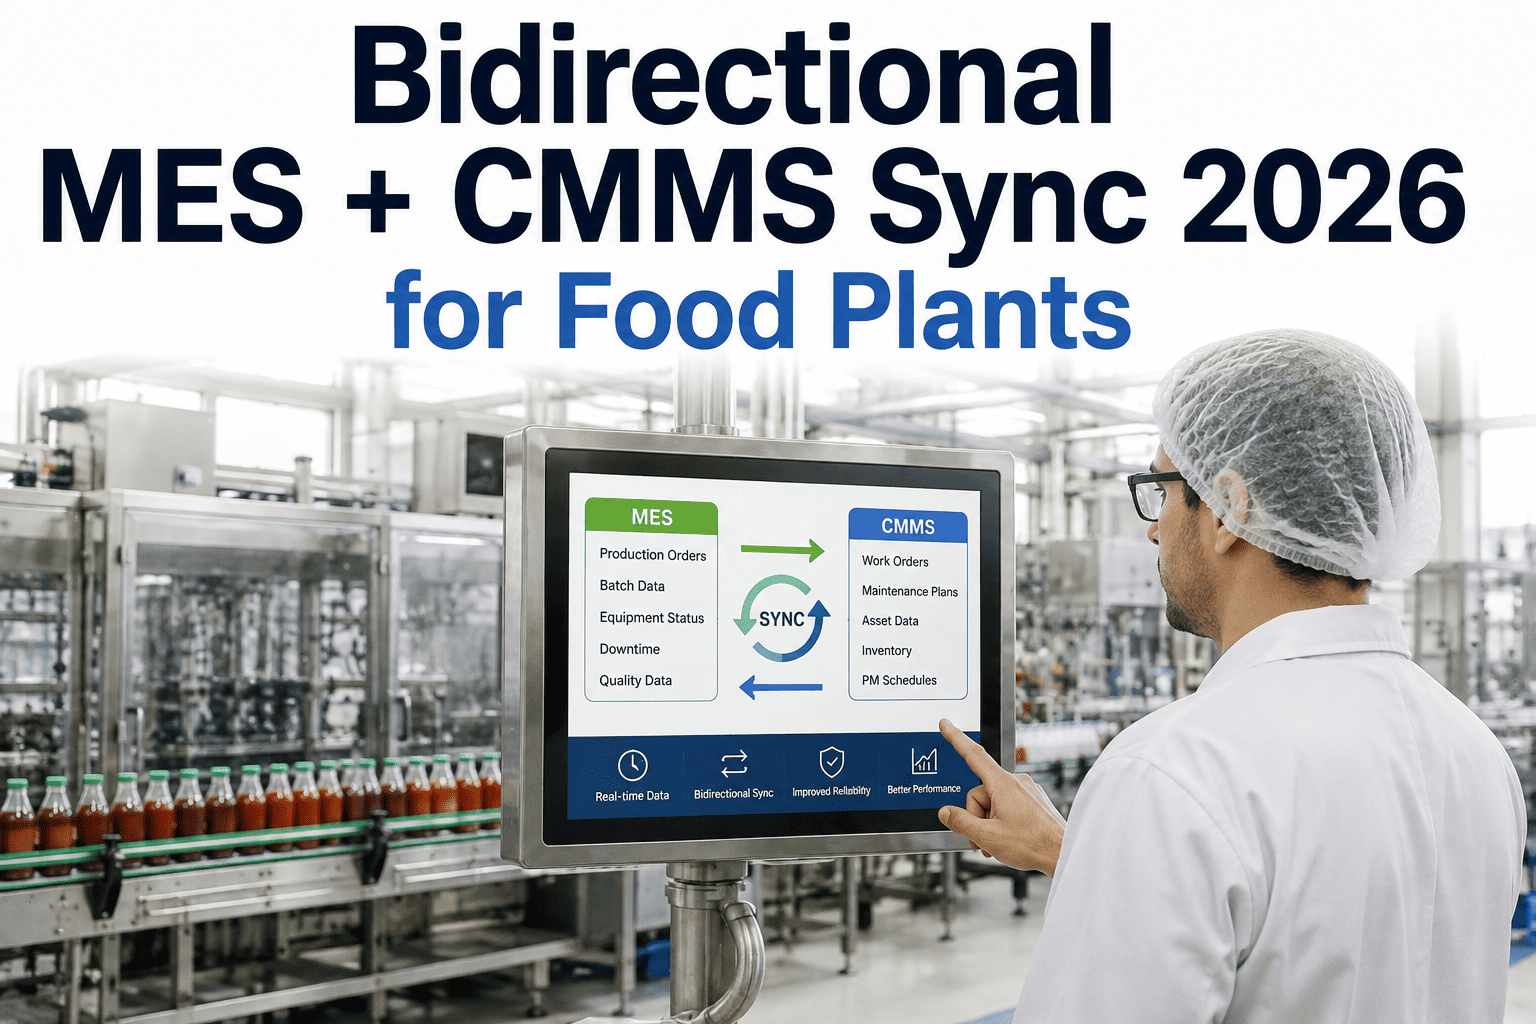
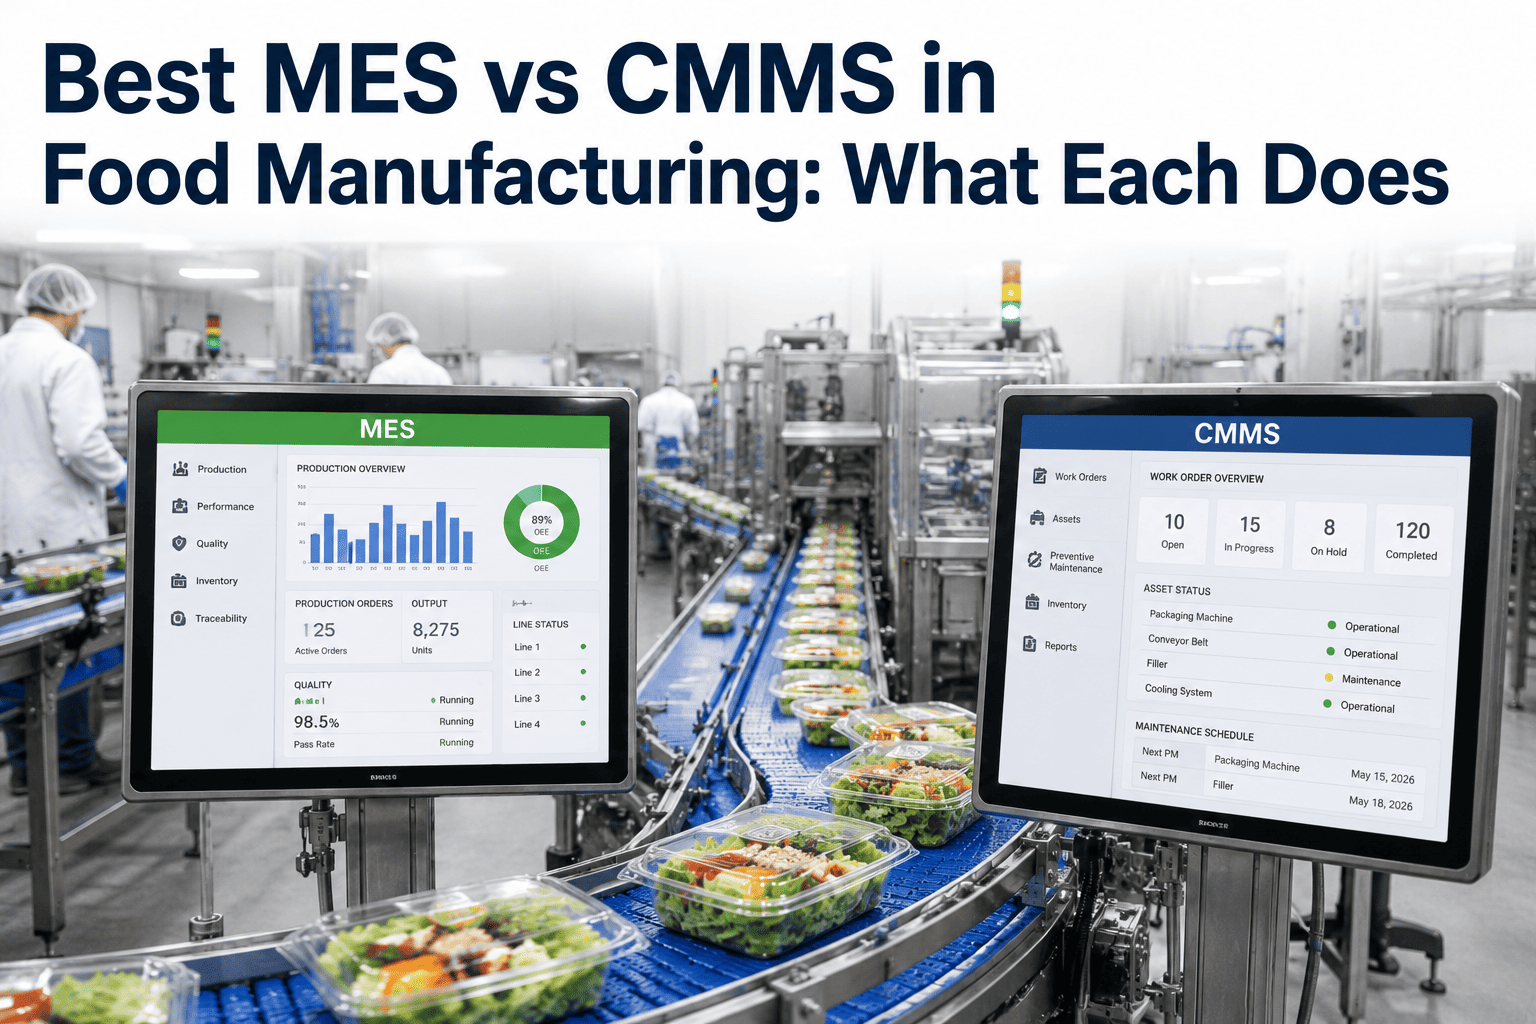
Every MES-CMMS integration proposal eventually lands on a finance director's desk, and the question that follows is always the same one: what does this actually save, in dollars, on a timeline someone can hold the project accountable to. Vague claims about "better visibility" don't survive that conversation. What does is a defensible model built on three measurable levers — downtime prevented, mean time to repair improved, and scrap reduced — each translated into a dollar figure using assumptions the finance team can independently verify. iFactory's solutions engineering team builds this model with every food manufacturing client before a contract is signed, specifically so the payback claim can survive scrutiny after go-live.
Food & Beverage · Financial Justification
The MES + CMMS ROI Model Food Manufacturers Can Defend to Finance
A payback model built on downtime prevented, MTTR improvement, and scrap reduction — with the assumptions shown, not hidden — so your integration business case survives the finance review it's going to get.
The Three ROI Levers
Where the Financial Case Actually Comes From
A credible MES-CMMS ROI model resists the temptation to count every conceivable benefit and instead concentrates on the three levers that are both large enough to matter and measurable enough to defend after the fact.
01
Downtime Prevented
Faster downtime-to-work-order handoff and better asset state visibility shrink the gap between a failure occurring and a technician being dispatched with the right information, directly reducing total downtime minutes per month.
02
MTTR Improved
Technicians arrive at the asset with downtime reason codes, asset history, and spare parts status already synced from the MES, cutting the diagnostic portion of mean time to repair that typically consumes the largest share of total repair duration.
03
Scrap Reduced
Quality holds that correctly block maintenance scheduling, and maintenance completions that correctly clear production restrictions, reduce the incidence of product run against equipment that shouldn't have been producing in the first place.
Build Your Own Numbers
Walk Through the ROI Model With Your Actual Plant Data
iFactory's solutions engineering team will build a payback model live using your downtime logs, repair time history, and scrap rates — not industry benchmarks — so the number you take to finance is one your own numbers actually support.
Illustrative Scenario
What This Looks Like for a Mid-Size Food Plant
The figures below are an illustrative composite, not a guarantee — actual results depend entirely on your plant's current downtime, repair, and scrap baselines, which is why the formula above is built around your own inputs rather than a fixed percentage claim.
15–20%
Typical downtime reduction range reported by plants after sync go-live
20–30%
Typical MTTR improvement range from synced diagnostic data
5–10%
Typical scrap reduction range from better hold-to-maintenance coordination
9–14mo
Typical payback window across all three levers combined
Building the Business Case
From First Meeting to Board-Ready Number
Step 1
Baseline Data Pull
Twelve months of downtime logs, repair time records, and scrap data are pulled from existing systems to establish the current-state baseline for each lever.
Step 2
Conservative Improvement Estimate
Improvement percentages are set conservatively against comparable food plant deployments rather than best-case vendor claims, protecting the credibility of the resulting payback figure.
Step 3
Finance-Ready Output
The model is delivered as a working spreadsheet with every assumption visible and editable, so your finance team can stress-test the numbers before the business case goes to a capital approval committee.
1000+Clients on iFactory platform
99.9%Platform uptime SLA
3Measurable ROI levers modeled
12moBaseline data window used
Common Questions
Frequently Asked Questions
What if we don't have clean twelve months of downtime and scrap data?
Most plants have some usable history even if it's incomplete or spread across a few different systems and spreadsheets, and a shorter baseline window — three to six months — can still produce a defensible model as long as it's representative of normal operating conditions rather than an unusually good or bad stretch. Where genuine gaps exist, conservative industry ranges can fill them temporarily, clearly labeled as estimates rather than measured baselines, with a plan to replace them with your own data once the sync platform starts capturing it.
iFactory's solutions engineering team can work with whatever data exists today.
How conservative are the improvement percentage assumptions?
The improvement ranges used in the model are drawn from actual post-deployment results across comparable food and beverage plants, and the model defaults to the lower end of each observed range rather than the average or best case, specifically so the resulting payback figure holds up even if your plant's results land toward the lower end of what's typical. This conservative bias is a deliberate design choice — a business case that survives being wrong in the pessimistic direction is worth far more than one that only works if everything goes perfectly.
Does the ROI model account for the ongoing platform subscription cost?
Yes, the implementation cost line in the model includes both the one-time integration and configuration fee and the recurring annual platform cost, and the payback period calculation is run against total cost of ownership rather than just the upfront investment. This matters because a model that only counts implementation cost against savings will understate the true payback period and create a credibility gap when the first annual renewal invoice arrives and finance asks why it wasn't in the original case.
Can this ROI model be adapted for a single-line pilot instead of a full plant rollout?
Yes, and in fact starting the model with pilot-scope numbers is a common and reasonable approach — you scale the downtime, repair, and scrap baseline inputs down to just the pilot line's historical performance, then use the pilot's actual measured results to validate or adjust the assumptions before building the full-plant business case. This sequencing gives finance a smaller initial approval to evaluate and gives your team real data to strengthen the larger case that follows.
Who typically presents this ROI model internally — plant engineering or finance?
It varies by organization, but the model is deliberately built as a shared spreadsheet with transparent formulas specifically so both plant engineering and finance can own their respective parts of the conversation — engineering defends the operational assumptions like downtime baselines and improvement ranges, while finance validates the cost inputs and payback calculation methodology.
Booking a demo with both stakeholders in the room tends to produce the fastest path to approval.
Build a Business Case Finance Will Approve
Get Your MES + CMMS ROI Model Built With Your Own Data
iFactory's solutions engineering team builds a transparent, defensible payback model using your plant's actual downtime, repair time, and scrap data — no hidden assumptions, no best-case-only numbers.