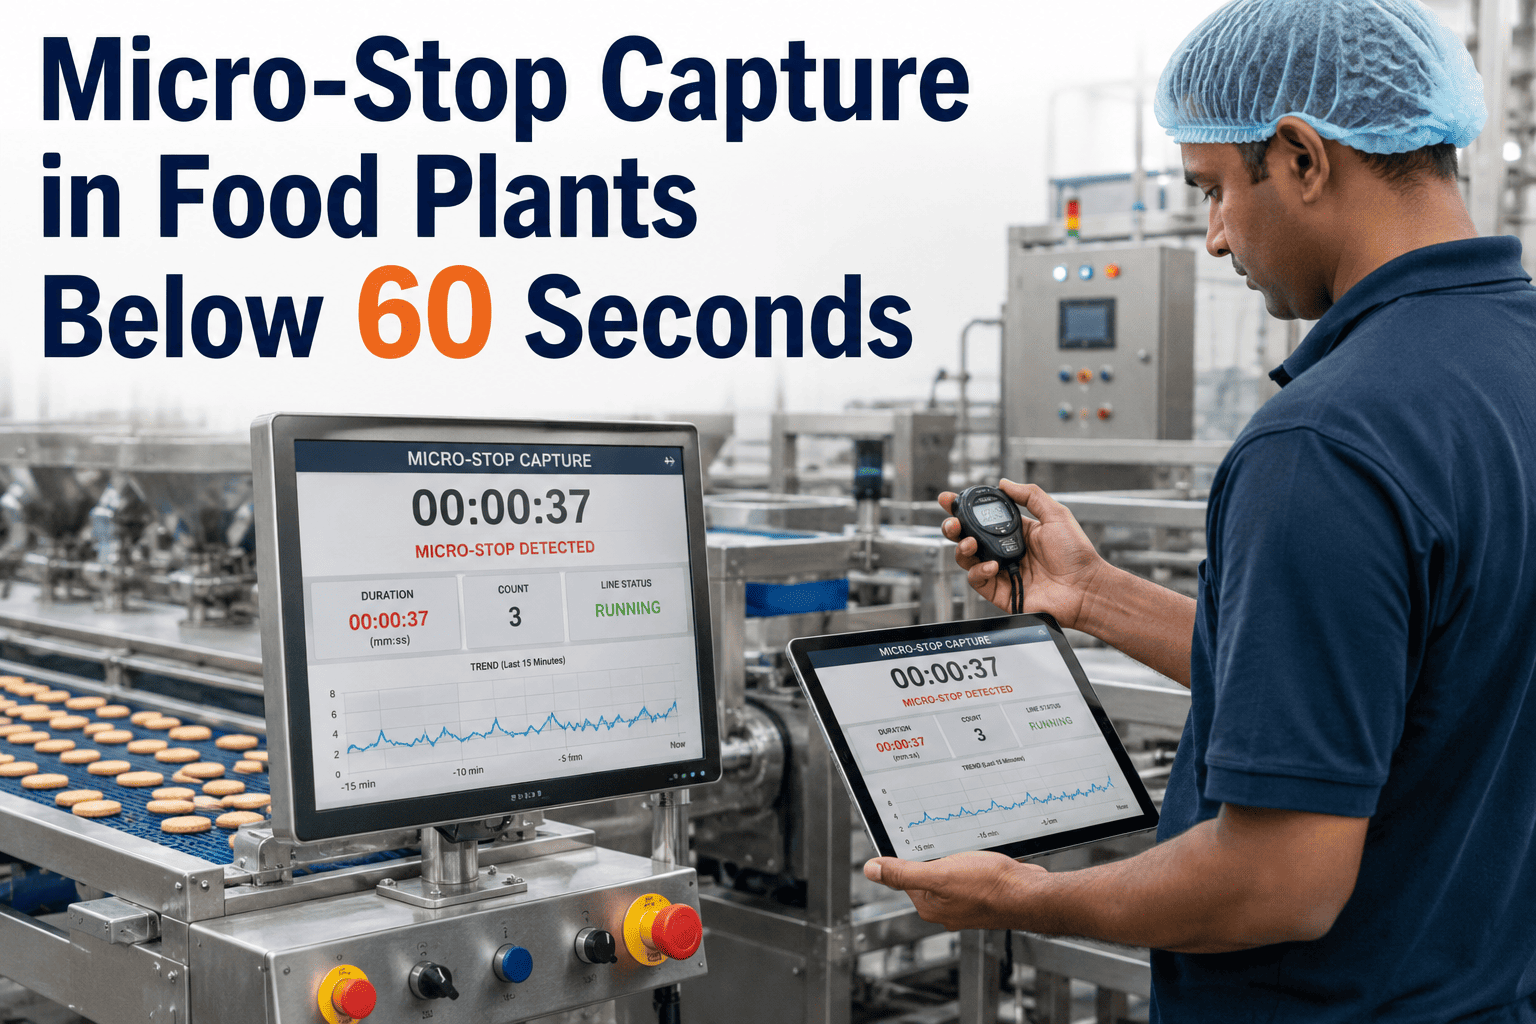
A single micro-stop barely registers. Fifteen seconds here, twenty-two seconds there, a filler nozzle that hiccups and recovers before anyone even looks up from what they were doing. The trouble is that these sub-minute stoppages rarely happen once; on a high-speed beverage or packaging line they can repeat dozens or even hundreds of times across a shift, and the accumulated total often dwarfs the big, memorable downtime events that actually get written down. Most manual logging systems, and even a fair number of automated ones, quietly fail to capture anything under a sixty-second threshold, which means a huge share of a line's true availability loss simply disappears from the record. iFactory is built with signal-based architecture specifically tuned to catch and classify sub-minute stops in real time. You can book a demo to see micro-stop capture running live on a line similar to yours.
MICRO-STOP CAPTURE · SUB-60-SECOND DETECTION · FOOD & BEVERAGE
The Downtime Hiding Below The One-Minute Threshold
iFactory captures, classifies, and quantifies micro-stops under sixty seconds in real time, recovering OEE that most reporting systems never even see.
WHERE A TYPICAL SHIFT'S DOWNTIME ACTUALLY GOES
Micro-Stops (Under 60s)
44%
WHY THE 60-SECOND THRESHOLD MATTERS
Most Systems Are Not Built To See This Small
Traditional downtime tracking, whether manual or automated, was often designed around a minimum threshold, sometimes explicitly, sometimes as a side effect of polling intervals too slow to register a brief interruption. Anything shorter simply never enters the record, even though the cumulative effect across a shift can be substantial.
40-45%
Typical share of total line downtime made up of stops under 60 seconds on packaging lines
3-6 pts
Common OEE recovery after implementing dedicated micro-stop capture and reduction
100+
Micro-stops that can occur on a single high-speed filler in one eight-hour shift
THE ARCHITECTURE BEHIND CAPTURE
Signal-Based Detection Built For Sub-Minute Events
Capturing a fifteen-second stop reliably requires a fundamentally different technical approach than logging a thirty-minute changeover, since polling intervals, signal filtering, and threshold tuning all need to be built around speed and precision from the start.
01
High-Frequency Signal Polling
Sub-second polling of run state signals so brief interruptions are never missed between reads.
02
Noise Filtering
Distinguishing a genuine micro-stop from normal speed fluctuation or sensor noise through calibrated tolerances.
03
Automatic Sub-Categorization
Each captured micro-stop classified by likely cause based on signal pattern, not left as an unlabeled blip.
04
Pattern Aggregation
Individual micro-stops rolled up into recurring patterns so the highest-frequency root cause surfaces clearly.
See What Your Micro-Stops Are Really Costing You
iFactory can show you a real micro-stop breakdown from a line similar to yours within a single demo session. Book a demo and bring a recent production week.
TUNING THE THRESHOLD
Setting The Right Cutoff For Your Equipment
Sixty seconds is a common industry reference point, but the ideal threshold for classifying a stop as a micro-stop rather than a standard stoppage can vary by line type and equipment speed.
| Line Type |
Typical Threshold |
Common Cause |
| High-Speed Filling |
Under 30 seconds |
Nozzle misfeed or cap jam |
| Packaging And Cartoning |
Under 45 seconds |
Carton misfeed or sensor fault |
| Labeling |
Under 20 seconds |
Label web tension fault |
| Case Packing |
Under 60 seconds |
Case erector jam |
WHERE THE OEE COMES BACK
Reduction Projects That Follow Capture
Once micro-stops are captured and pattern-aggregated, the highest-frequency causes usually point toward a small number of specific, fixable issues rather than a diffuse, unsolvable problem.
Sensor Recalibration
Misaligned or degraded sensors causing false jam detection are often the single largest recurring cause.
Guide Rail And Feed Adjustment
Mechanical guide adjustments that reduce misfeeds on packaging and cartoning equipment.
Speed Curve Tuning
Adjusting acceleration and deceleration curves that trigger stops during speed transitions.
Preventive Component Replacement
Targeting wear parts identified through recurring micro-stop patterns before a major failure occurs.
WHO THIS SERVES
High-Speed Lines Benefit Most
Micro-stop capture delivers the fastest and clearest return on lines running at high cycle rates, where sub-minute interruptions accumulate quickly and are hardest for a person to track manually.
Beverage Filling Lines
High-speed fillers are among the most common sources of frequent, brief interruptions.
Packaging And Cartoning Lines
Mechanical feed systems are especially prone to recurring sub-minute jams.
Labeling Operations
Web tension and alignment faults tend to cluster into short, frequent stoppages.
Multi-Line Facilities
Comparing micro-stop patterns across lines helps prioritize maintenance investment.
FREQUENTLY ASKED QUESTIONS
Questions About Micro-Stop Capture
Can our existing PLCs support sub-second polling for micro-stop capture?
Most modern PLCs can support the polling frequency needed for reliable micro-stop capture without additional hardware, since the requirement is on the data collection and processing side rather than the controller itself. Older controllers with slower native cycle times may need a supplementary sensor at a specific point to achieve the same resolution.
Book a demo to review your specific controller capability.
How is a genuine micro-stop distinguished from normal speed variation?
Threshold tuning during onboarding establishes what normal speed fluctuation looks like on your specific equipment, so the system learns to distinguish a true stop from an expected dip in a way that generic default settings could not reliably do. This tuning is revisited periodically as equipment condition changes over time.
Contact our support team to discuss threshold tuning for your lines.
Will capturing every micro-stop overwhelm our reporting with too much noise?
Individual micro-stops are automatically aggregated into recurring patterns rather than presented as an overwhelming raw list, so a supervisor sees the handful of high-frequency causes that matter rather than hundreds of individual line items. The underlying detail remains available for anyone who wants to drill into a specific pattern.
Book a demo to see the pattern aggregation view.
How quickly can we expect to see recovered OEE after starting capture?
Most lines identify at least one clear, fixable pattern within the first two to three weeks of connected data, and the actual OEE recovery follows once that root cause is addressed rather than at the moment of detection itself. The speed of recovery depends more on how quickly the identified fix can be implemented than on the detection technology.
Contact our support team to discuss a realistic recovery timeline for your line.
Does micro-stop capture require a different threshold for every line?
Yes, the appropriate threshold varies by equipment type and speed, so each line is calibrated individually rather than applying one universal cutoff across the whole plant, since a fixed threshold that works for a slow case packer would miss meaningful stops on a high-speed filler. This calibration is part of the standard onboarding process.
Book a demo to see threshold calibration across different line types.
Recover The OEE Hiding In Your Micro-Stops
iFactory captures every sub-minute stop, classifies it, and surfaces the recurring patterns worth fixing first. Book a demo and see it running on your own line data.