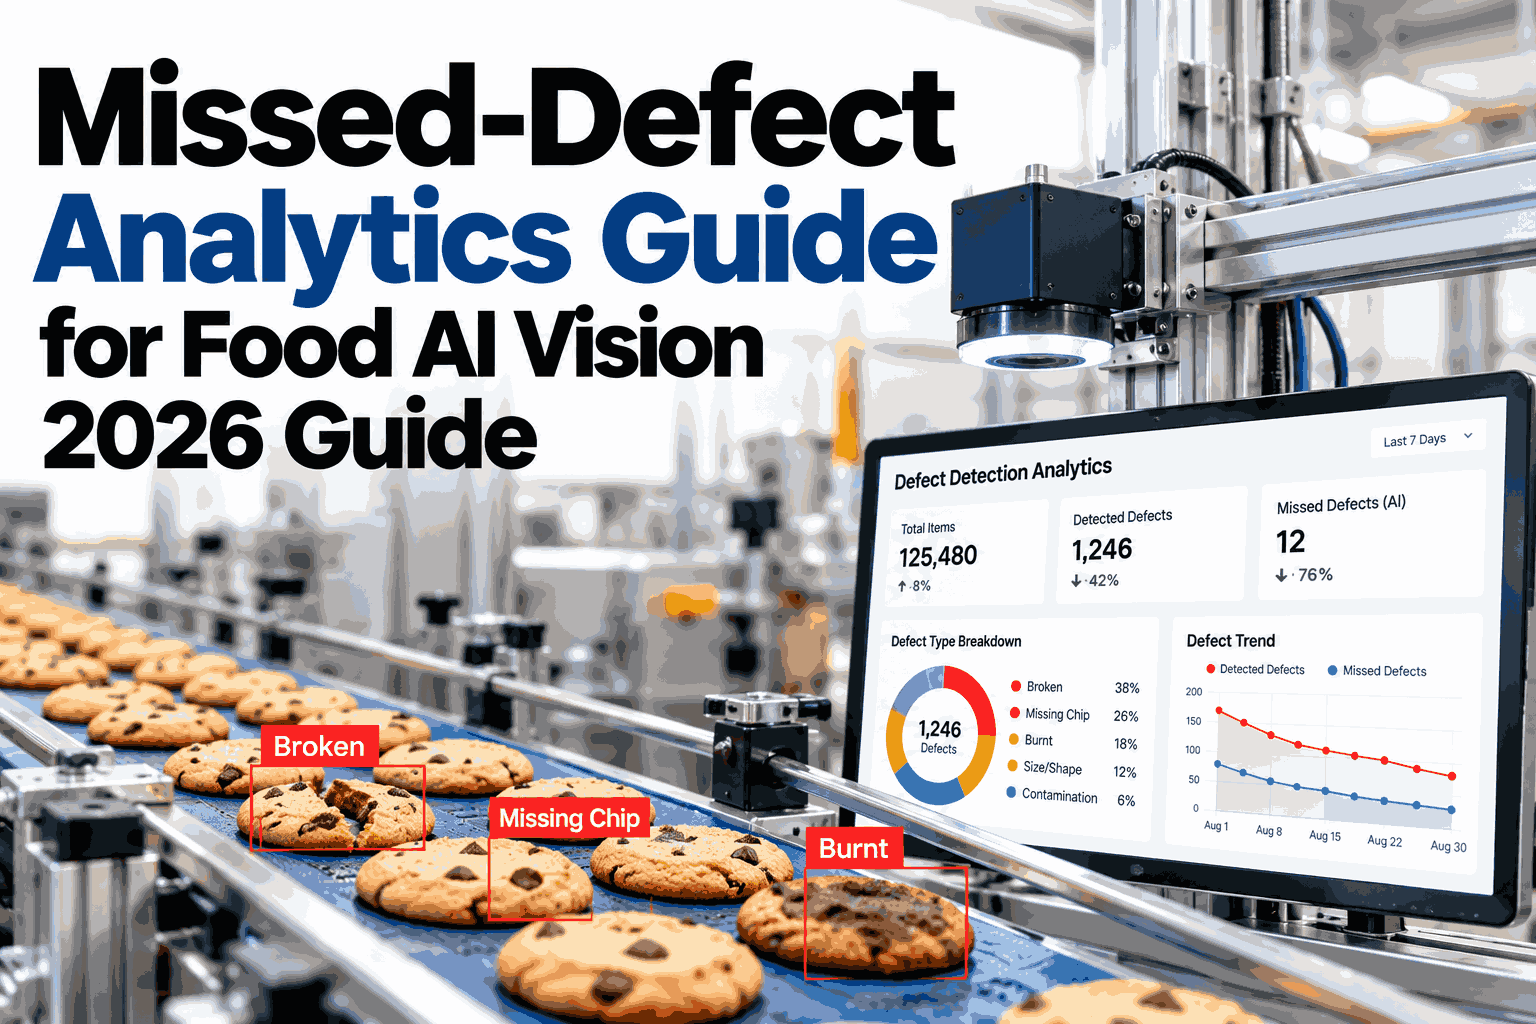
Food plants running AI vision systems often trust the dashboard's accuracy number without ever checking it against what actually left the line. A vision system can report ninety-nine percent precision while quietly missing defects that surface later as customer complaints, retailer returns, or audit flags. The gap between a reported accuracy figure and the real-world miss rate is where most hidden quality risk lives, because nobody is comparing camera decisions against outbound product until something goes wrong. Running a structured sampling audit against your own outbound product is the only reliable way to know your true miss rate, and if you want a walkthrough of how that audit works, our team can show you.
Missed-defect analytics, 2026
Find Out What Your AI Vision System Is Actually Missing
A practical framework for outbound sampling audits, true miss rate calculation, and the labeling loop that turns escaped defects into a smarter model instead of a repeated complaint.
What reported accuracy usually hides
Dashboard precision98-99%
True miss rate, unauditedUnknown
Typical escape share found2-6%
Plants that audit outbound productFew
The blind spot
Why Reported Accuracy and Real Miss Rate Rarely Match
A vision model's accuracy score is calculated against the images it was trained and tested on, not against everything that actually crosses the belt in production. New packaging angles, lighting drift, and rare defect types all sit outside that original test set.
Test set bias
Training accuracy reflects a curated image set, not the full variety of real production conditions.
Silent drift
Camera angle, lighting, and product mix shift gradually, and the model keeps scoring itself against the old baseline.
Rare defects
Low-frequency defect types are the ones most likely to be under-represented in training data and most likely to escape.
No feedback loop
Without an outbound audit, a missed defect simply disappears into the next truck with no record for the model to learn from.
The formula
How to Calculate Your True Miss Rate
True miss rate is not the inverse of the dashboard's precision score. It has to be measured against a sample of product the system already passed, checked again by a second method.
Run this on a rolling basis rather than once. A single audit tells you where you stand today, but a repeated audit tells you whether the gap is closing, holding steady, or quietly widening as conditions on the line change.
The method
Running an Outbound Sampling Audit Without Slowing the Line
An outbound audit does not need to inspect every unit. A statistically sound sample, pulled consistently, gives a defensible miss rate without adding meaningful labor or downtime.
1
Pull a fixed sample size from product the vision system already passed, at a consistent interval across the shift.
2
Inspect the sample with a second method, either a trained human checker or a higher-resolution reference camera.
3
Log every confirmed miss with defect type, location on the unit, and the production conditions at that moment.
4
Calculate miss rate weekly and track it as its own line on the quality dashboard, next to accuracy.
5
Feed every confirmed miss back into the labeling queue instead of filing it only as an incident report.
See Your Own Miss Rate, Not Just an Industry Average
Share your current vision setup and sampling practice, and we will map out an outbound audit designed for your line and product mix.
Know your escapes
The Four Types of Defects That Typically Escape Inspection
Not all misses come from the same cause. Grouping escapes by type makes it much easier to decide whether the fix is a camera change, a lighting change, or a labeling gap.
Low-contrast defects
Marks or discoloration close to the product's own surface tone, easy for a camera to blend past.
Edge and seam defects
Flaws sitting right at a package seam or product edge, where the model's confidence is naturally lower.
Rare defect types
Defects seen only a handful of times in training, so the model has little pattern to recognize them by.
Occluded defects
Flaws partly hidden by packaging, condensation, or product orientation at the moment of capture.
Ranked by frequency
Which Escape Types Show Up Most Often in Audits
Across repeated outbound audits, escape types are not evenly distributed. Knowing which category dominates your own data tells you exactly where to focus labeling and camera effort first.
Low-contrast defects tend to dominate because they are the hardest category for any camera system to separate from normal product variation, which is why lighting and contrast tuning usually deliver the fastest miss rate improvement.
Closing the loop
The Labeling Loop That Turns Misses Into Model Improvement
An outbound audit is only half the work. The value comes from feeding every confirmed miss back into the system so the model actually learns from it instead of repeating the same escape next shift.
1
Capture
The audit image and the vision system's original decision are saved together as one record.
2
Label
A reviewer tags the confirmed defect type, location, and severity on the saved image.
3
Queue
Labeled misses are grouped into a retraining batch once enough examples accumulate for that defect type.
4
Retrain
The model is updated on a set schedule, not only after a major incident forces an emergency fix.
5
Re-audit
The next sampling audit confirms whether the retrained model actually closed the gap for that defect type.
Setting a target
What a Reasonable Miss Rate Target Looks Like by Risk Level
Not every defect carries the same cost, so a single miss rate target for the whole line usually misrepresents the real risk. Splitting targets by severity gives a more honest picture of where attention belongs.
| Defect severity | Typical unaudited miss rate | Reasonable target after audit loop | Primary risk if missed |
| Critical (safety or recall risk) |
0.5 to 1.5% |
Under 0.1% |
Recall, regulatory action |
| Major (returns, complaints) |
2 to 4% |
Under 0.5% |
Customer complaints, chargebacks |
| Minor (cosmetic) |
4 to 8% |
Under 2% |
Brand perception, repeat downgrades |
Critical defects deserve the tightest target and the fastest labeling turnaround, since the cost of one escape in that category can outweigh months of minor-defect cleanup combined.
Avoid these mistakes
Common Mistakes That Keep Miss Rate Programs From Working
Most outbound audit programs fail quietly, not because the method is wrong but because of a handful of repeatable gaps in how they are run.
Auditing once and stopping
A single audit is a snapshot, not a program. Conditions drift, so the sampling has to continue on a schedule.
No defect-type breakdown
A single blended miss rate number hides which specific defect categories actually need attention.
Misses filed, never labeled
Logging an incident report without labeling the image means the model never actually sees the correction.
Retraining only after a crisis
Waiting for a major complaint to trigger retraining means smaller recurring misses accumulate unaddressed.
Frequently asked questions
What Plants Ask Before Starting a Miss Rate Audit
How big does the outbound sample need to be to trust the result?
Sample size depends on your production volume and how confident you need the result to be, but most lines get a usable baseline from a few hundred units per week sampled consistently.
Work out a sample plan with our team for your specific volume.
Do we need a second camera system to run this audit, or can people do it manually?
A manual secondary check by a trained inspector works for most plants starting out, and a reference camera can be added later once the program proves its value.
Ask support about audit setup options for your line.
How often should the model actually be retrained once misses start getting labeled?
Most plants settle on a monthly or quarterly retraining cadence once a labeling queue builds up, rather than retraining after every single confirmed miss.
Discuss a retraining schedule that fits your defect volume.
Will tracking miss rate separately from accuracy confuse the quality team?
In practice it clarifies things, since accuracy describes the model's own test performance while miss rate describes what customers actually experience, and both numbers answer different questions.
Get help setting up the dashboard split with our team.
What is a realistic first improvement to expect after one labeling cycle?
Plants that label and retrain around their single largest escape category typically see that category's miss rate fall noticeably within the first one to two retraining cycles, though total gains vary by defect mix.
Walk through expected outcomes for your product line.
Know what's actually escaping your line
Build an Outbound Audit and Labeling Loop With iFactory AI
Book a session with our team to set up a sampling audit, calculate your true miss rate, and connect it to a labeling loop that keeps improving your vision system.