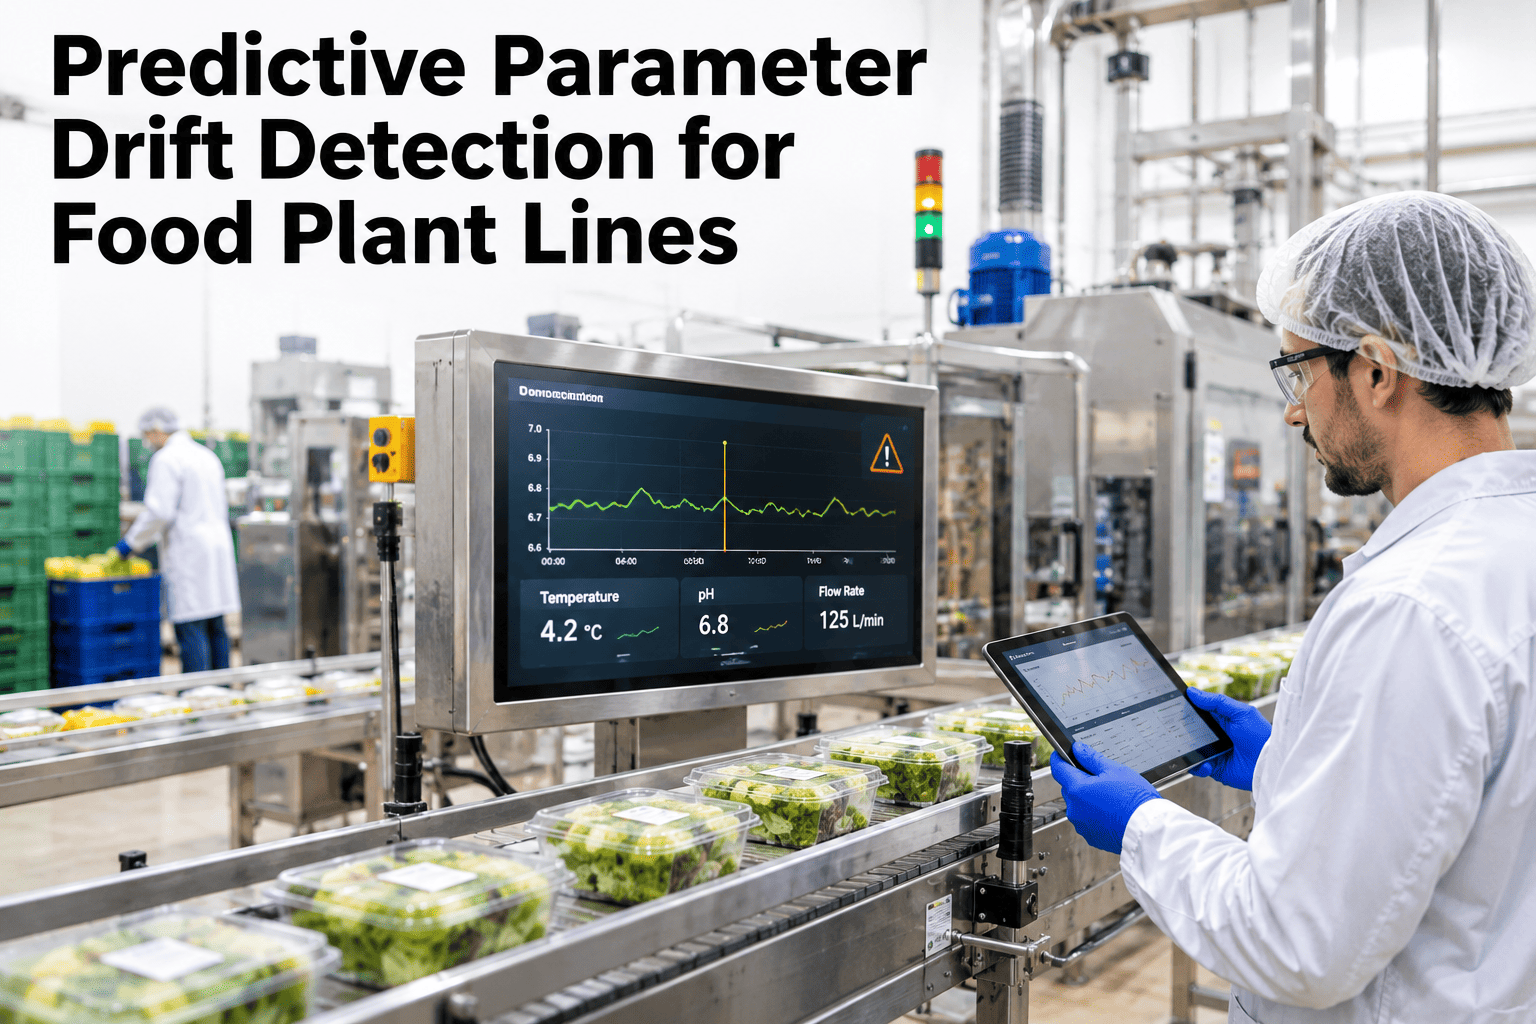
A single parameter chart can look perfectly in control while the process is already drifting — because the drift is hiding in the relationship between variables, not in any one of them alone. iFactory, an on-premise AI platform with automated analytics reporting built in, reads pressure, temperature, and speed together as one multivariate signal. Food plant quality teams who want this on their own lines can request a demo with our team.
Predictive Parameter Drift Detection · Food Plant Lines, 2026
Every Individual Chart Looks Fine. The Combination Doesn't.
iFactory AI reads pressure, temperature, and speed as one correlated signal, catching the drift that hides between variables weeks before any single chart would flag it.
Combined signal
Drift flagged
Why single-variable SPC misses this
Univariate Charts Were Never Built to See a Combination
A traditional control chart tracks one variable against its own historical limits. It cannot see that pressure and temperature have started moving together in a way they never did before, even though each one individually stays inside its own control band — the drift is in the correlation, and a one-variable-at-a-time view has no way to represent that.
How multivariate detection works
Three Elements Behind a Combined Drift Signal
Correlation baseline
The system learns the normal relationship between pressure, temperature, and speed during stable production.
Combined distance metric
Each new reading is scored by how far it sits from that normal relationship, not just from a single variable's own limit.
Trend over time
A rising combined-distance score over days or weeks is the signature of a genuine drift, not a momentary blip.
What drift looks like before it's a defect
The Window Between Drift and Impact
| Stage | What's happening | What a single chart shows |
|---|
| Early drift | Parameters begin moving together away from the learned baseline | Nothing — each variable individually still looks fine |
| Established drift | The combined relationship is now clearly abnormal | Still nothing on a single-variable chart |
| Quality impact | Product begins falling outside acceptable limits | A reject or lab result finally shows the problem |
See Whether a Combined Drift Is Already Hiding in Your Data
Share a sample of your current pressure, temperature, and speed logs, and iFactory AI will show what a combined-signal view reveals that your single-chart SPC does not.
From signal to response
Four Steps From a Flagged Drift to a Corrected Process
1
Combined score rises
The multivariate distance metric starts trending upward over several readings.
2
Contributing variables identified
The system shows which parameters are driving the drift, not just that one exists.
3
Operator investigates
The flagged relationship narrows the search to a specific likely cause.
4
Correction confirmed
The combined score returning to baseline confirms the adjustment actually worked.
Building the baseline
What the System Needs to Learn First
A multivariate drift model is only as good as the stable production period it learns from. Most deployments start by identifying a known-good run — a period with no quality complaints and confirmed in-spec product — and using it to establish the normal correlation baseline before any live monitoring begins.
Expert review
What a Process Engineer Checks First
Multivariate drift detection earns trust when the flagged relationship actually points to a specific, investigable cause, not just a vague "something changed" alert.
Verdict
Strong when the baseline was built from a genuinely stable, confirmed-good production period.
Watch for
A baseline built during a period that included an undetected quality issue — the model would then treat that issue as normal.
Do next
Pull your last confirmed-good production week and check whether pressure and temperature data from that period are both captured and time-aligned.
Frequently asked questions
What Food Plant Teams Ask About Drift Detection
Why would parameters that each look normal individually still be a problem?
A process can drift through a combined shift in how variables relate to each other, even while each one stays within its own historical range — this is a well-documented limitation of single-variable control charts in process engineering.
See how this applies to your line's parameters.
How many parameters need to be monitored together for this to work?
Most deployments start with the three to five parameters most closely tied to known quality outcomes on a given line, expanding as the correlation model proves useful.
Ask support which parameters to start with.
How far in advance does this typically catch a drift?
Lead time depends on how gradually the process is drifting and how tightly the baseline correlation was established, so it varies by line and parameter set rather than being a fixed number.
Discuss typical lead times for your process.
Does a seasonal or recipe change require rebuilding the baseline?
Yes — a genuine change in recipe, raw material source, or seasonal operating conditions shifts what "normal" correlation looks like, so the baseline should be reviewed and potentially rebuilt after any such change.
Ask support about baseline maintenance.
Can this integrate with our existing SPC charts rather than replacing them?
Catch the drift no single chart can see
Read Your Line's Parameters as One Combined Signal
Book a demo to see how iFactory AI detects multivariate drift weeks ahead of a quality impact.