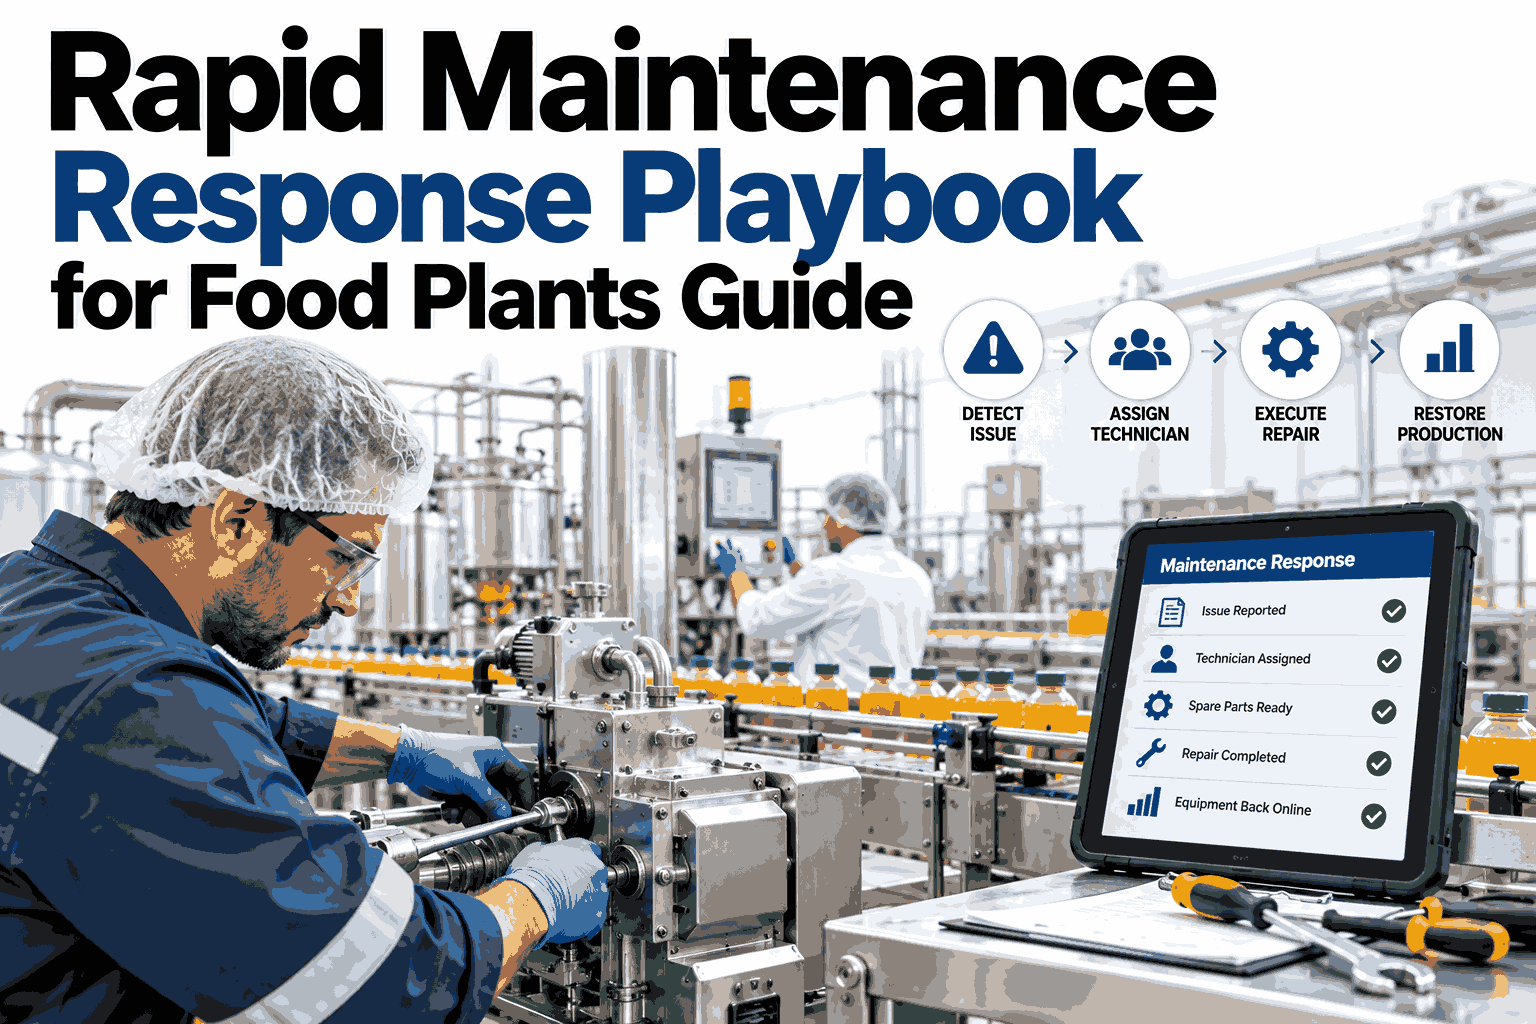
When a line goes down in a food plant, the clock does not only run on repair time. It runs on product sitting in kettles, ovens, and chillers, on crews standing idle, and on a shelf-life window that keeps closing while someone hunts for the right spare. Most plants have no written protocol for those first thirty minutes, so every event gets improvised from scratch. A minute-by-minute playbook removes the guesswork, and you can see how iFactory structures the response in a short walkthrough.
MAINTENANCE RESPONSE GUIDE FOR FOOD PLANTS
Rapid Maintenance Response Playbook for Food Plants
A practical, minute-by-minute protocol for line-down events that stages spares first, assigns clear roles, protects food safety, and gives your team a repeatable way to cut mean time to repair.
WHY SPEED MATTERS
A Food Line Does Not Pause Politely When It Fails
In discrete manufacturing, a stopped line mostly means lost output. In food manufacturing, a stopped line also means product that is still alive in a biological and thermal sense. Dough keeps proofing, sauces keep cooling, and frozen product keeps warming.
Product in Process
Material inside an oven, fryer, kettle, or tunnel freezer is exposed to the failure. Every minute of delay raises the chance that a batch must be reworked, held, or scrapped.
Shelf-Life and Hold Risk
Chilled and short-life products run against a clock. A long stoppage can push finished goods past the point where they can ship with the shelf life customers expect.
Idle Labor and Overtime
Operators, packers, and QA staff are paid while the line is stopped, and recovery often means overtime to catch up on a committed production plan.
Sanitation Windows
A late repair eats into the cleaning and changeover window that follows. Squeezing sanitation to recover time is how food safety shortcuts begin.
A rapid response playbook does not ask technicians to work faster. It removes the waiting, searching, and confusion that surround the actual repair, which is where most of the lost time hides. Teams that want to see this applied to real asset data can request a guided session with the iFactory team.
ANATOMY OF AN EVENT
Where the Minutes Actually Go During a Line-Down Event
Most plants measure mean time to repair as one number, which hides the stages inside it. Splitting an event into five phases shows that the wrench time is often the smallest part of the delay.
Detection and Call-Out
Without playbook: 10 min
With playbook: 4 min
Diagnosis
Without playbook: 25 min
With playbook: 16 min
Locating and Staging Parts
Without playbook: 25 min
With playbook: 6 min
Hands-On Repair
Without playbook: 20 min
With playbook: 24 min
Verification and Restart Clearance
Without playbook: 10 min
With playbook: 10 min
Illustrative model of a 90-minute event becoming a 60-minute event. These are teaching numbers, not an industry benchmark. Replace them with your own work order timestamps.
Notice what happens to hands-on repair in the model. It gets slightly longer, because the technician now works methodically with the right parts in hand and a proper lockout. The savings come from detection, diagnosis, and parts.
THE PROTOCOL
The Minute-by-Minute Line-Down Protocol
The protocol below is a template. Adjust the timings to your products and equipment, but keep the structure: one trigger, one owner at every step, and a hard escalation checkpoint.
Minute 0
Declare the Line Down
The operator sends one standard call-out with four facts: line, asset, symptom, and state of the product on the line. A fixed format stops the guessing that usually follows a vague radio call.
Minute 2
Acknowledge and Assign
A dispatcher or shift lead acknowledges the call, names a lead technician, and notifies QA that product is exposed. Silence at this step is the single most common source of early delay.
Minute 5
Make It Safe
The lead technician applies lockout and tagout, isolates the asset, and confirms that product on the line has been secured or put on hold. A photo of the failure is captured before anything is moved.
Minute 10
Diagnose With History
The technician checks the asset failure history and a short symptom checklist. Past work orders often point to the likely cause within minutes, and the parts list is called out at the same moment.
Minute 15
Pull and Stage Spares
A second person, not the lead technician, retrieves the parts and brings them to the line. If the part is not in the plant, the vendor call and expedited shipping decision start immediately.
Minute 30
Escalation Checkpoint
If there is no confirmed repair path by now, the maintenance manager and production lead join. They decide on product disposition, rerouting to another line, and whether outside help is required.
Minute 45+
Repair, Verify, Release
The repair is completed, tools and parts are counted, sanitation is verified, and QA releases the line. The work order is closed with the real cause, not a generic note.
The checkpoint at minute thirty matters more than it looks. Without a defined moment to escalate, events drift, and everyone assumes someone else has already made the hard call.
Want this protocol running against your own assets and work orders?
iFactory can map the playbook to your lines, your roles, and your failure history so the first drill is built on real data.
STAGE SPARES FIRST
Three Tiers of Spares That Decide Your Repair Time
Spare parts are the largest controllable delay in most line-down events. The fix is not stocking everything. It is deciding in advance which parts live where, based on how often they fail and how badly their absence hurts.
Tier 1: At the Line
Conveyor belts and food-grade chain links
Proximity sensors and photo-eyes
Common bearings, seals, and gaskets
Fuses, relays, and small contactors
Rule: cheap, frequent, and fatal to the line when missing.
Tier 2: Plant Storeroom
Gearmotors and variable frequency drives
Pumps, valves, and spray nozzles
Temperature probes and thermocouples
PLC input and output cards
Rule: moderate cost, fetched within minutes by a named runner.
Tier 3: Vendor or Consignment
Large motors and custom shafts
Specialized forming or slicing assemblies
Control panels and HMI units
Heat exchanger and oven components
Rule: expensive and rare, covered by a pre-agreed supplier response.
Review the tiers against actual failure data every quarter. A part that moved from rare to frequent belongs closer to the line, and a part untouched for two years may not deserve its shelf space. You can ask the support team how spares and failure history can be viewed together.
WHO DOES WHAT
Clear Roles Remove the Hesitation That Costs Minutes
Events slow down when several capable people each wait for someone else to take charge. Assign five roles in advance, and make sure every shift has a named person for each one.
Small plants often combine roles, and that is fine. What matters is that a single person is accountable for each task during the event, and that the name appears on the shift board before the shift starts.
FOOD-SAFE RESTARTS
Fast Does Not Mean Careless: Protecting Food Safety During Repairs
The pressure to restart is greatest exactly when the risk of a food safety mistake is highest. A rapid playbook has to make the safe path the fast path, not the path people skip.
Before Work Begins
Lockout and tagout applied and verified
Exposed product covered, removed, or put on hold
Tools drawn from a controlled, counted kit
Allergen status of the area confirmed
Failed part photographed and kept for review
Before the Line Restarts
Tools, fasteners, and offcuts counted and cleared
Affected zone cleaned and inspected
Sanitation check completed to plant procedure
Metal detection or inspection equipment verified
QA signs off and the work order is closed
Each item on the restart side exists because a repair is also an opportunity to introduce a foreign object or a contamination risk. Documenting these checks inside the work order means they happen the same way every time, and they are easy to show an auditor.
PRACTICE MAKES MINUTES
A Drill Ladder That Builds Real Response Speed
A playbook nobody has rehearsed fails on its first real test. Drills turn a document into a habit, and they expose weak spots while the cost of finding them is still low.
Step 1: Desk Walkthrough
A thirty-minute session where the shift team reads a past event aloud and marks where the protocol would have changed the outcome.
Step 2: Call-Out Drill
A simulated line-down call with no repair. The team practices the standard message, the acknowledgment, and the role assignment against a timer.
Step 3: Parts Retrieval Drill
The parts runner is given a failure scenario and must locate and deliver the correct spares. Storeroom labeling problems surface quickly.
Step 4: Full Live Simulation
During a planned stop, run the whole protocol from call-out through restart clearance, and review the timeline with everyone involved.
Run the lower steps monthly and the live simulation once or twice a year. After every real event, hold a ten-minute review while memories are fresh, and feed what you learn back into the playbook. A live product demo can show how event timelines are captured for these reviews.
EQUIPMENT QUICK CARDS
Pre-Agreed First Checks for the Equipment That Stops Food Lines
Diagnosis speeds up when the first three checks for each asset family are already written down. These quick cards are a starting point, and your own failure history should reshape them over time.
Conveyors and Belting
Typical symptoms are belt tracking drift, a tripped overload, or a stalled drive. Check belt tension and tracking, drive current, and guard or sensor interlocks first. Keep spare belt sections, bearings, and photo-eyes at the line.
Ovens, Fryers, and Kettles
Typical symptoms are temperature that will not hold, burner or element faults, and failed circulation. Check probes and their calibration, safety interlocks, and control outputs first. Stock spare thermocouples and common control relays.
Mixers and Blenders
Typical symptoms are motor overload, seal leakage, and gearbox noise. Check the load history, shaft seal condition, and lubrication state first. Keep seals and a spare gearmotor in the storeroom, because a failed unit has few workarounds.
Filling and Packaging
Typical symptoms are jams, misaligned film, and sensor misreads. Check sensor cleanliness, alignment, and recent changeover settings first. Many stoppages here come from small wear parts, so a labeled changeover parts kit pays for itself.
Refrigeration and Freezing
Typical symptoms are rising temperatures, icing, and compressor trips. Check defrost cycles, airflow, and alarm history first, and notify QA at once because product temperature may be at risk. Pre-agree a transfer plan for stored product.
Inspection and Detection Systems
Typical symptoms are false rejects, failed verification tests, and reject mechanism faults. Check test piece results, belt condition, and reject device operation first. These units protect your customers, so restart rules must stay strict.
Print the cards for the line, or attach them to the asset record so a technician sees them the moment a work order opens. Teams that want to see this done digitally can schedule a conversation for options.
HIDDEN TIME LOSSES
Six Habits That Quietly Add Minutes to Every Event
Most delay is not dramatic. It comes from small, familiar habits that every plant has built up over the years, and each one is fixable once it has a name.
1. The Vague Call-Out
A message like "line three is down" forces the technician to walk over and ask questions. Four standard facts in the call save the walk and the first five minutes.
2. One Person Doing Everything
When the lead technician also fetches parts and phones suppliers, the repair waits. Splitting those tasks across two people is the cheapest speed gain available.
3. Unlabeled or Moved Spares
A part that exists but cannot be found is worth nothing. Consistent labels, fixed locations, and a return rule keep the storeroom trustworthy.
4. Ignoring Failure History
The same fault often happened six months ago, and someone already solved it. If that record is buried in notebooks, the solution is lost with it.
5. No Defined Escalation Point
Without a set checkpoint, a stuck repair can run for an hour before management hears of it. A fixed time removes the awkwardness of asking for help.
6. Vague Close-Out Notes
Entries such as "fixed" or "replaced part" teach nothing. Recording the real cause and the parts used makes the next diagnosis shorter.
Pick the two habits that sound most familiar and fix those first. Visible progress on a small scope earns the trust you need to roll the full playbook out across the plant.
MEASURE IT
Five Numbers That Tell You Whether the Playbook Works
What gets timed gets better. Track these five measures from your work orders, and review them monthly with the maintenance and production leads together.
Mean Time to Repair
Total repair time divided by number of events
The headline measure. Break it into the five phases to see which one moved.
Time to Acknowledge
Call-out time to named technician
Shows whether dispatch discipline is real or only written down.
Time to Parts on Site
Diagnosis complete to spares at the line
Directly reflects how well your spares tiers match real failures.
First-Time Fix Rate
Events solved without a repeat call
Guards against fast repairs that only hide the underlying fault.
Repeat Failure Rate
Same asset and failure mode within a set period
Tells you which events deserve a root cause study instead of another quick fix.
Be careful when comparing numbers across lines. A packaging line and a fryer have very different repair profiles, so measure each line against its own history first.
HOW IFACTORY SUPPORTS THE PLAYBOOK
Turning the Protocol Into Something Your Team Can Run Daily
A playbook on paper depends on memory and goodwill. iFactory is built to put the same steps inside the systems your team already uses, so the protocol runs the same way on night shift as it does on day shift.
01
Capture
Line-down events are logged with the asset, symptom, and time, creating the data a fair MTTR measure depends on.
02
Dispatch
Work is assigned to a named technician, with escalation prompts when the checkpoint time passes.
03
Equip
Failure history and spare part information sit next to the work order, so diagnosis and parts staging begin together.
04
Learn
Closed events feed phase timings and repeat failure views, showing where the next improvement will come from.
The goal is simple. Fewer minutes lost to searching and waiting, and a clear record of what happened each time. If you would like to see how this could be configured for your lines, reach out to our support team with the iFactory team.
YOUR FIRST 30 DAYS
A Four-Week Rollout That Starts Small and Builds Trust
You do not need to launch across every line at once. Starting with one high-impact line gives the team a real result to point to, and it keeps the first round of mistakes small and cheap.
W1
Choose and Baseline
Pick the line with the most unplanned stops. Pull the last several months of work orders and estimate the phase timings for a typical event, even if the data is rough.
W2
Write and Assign
Agree the call-out format, the five roles, and the escalation checkpoint. Put names on the shift board and print the equipment quick cards for the chosen line.
W3
Stage and Rehearse
Move the tier 1 spares to the line, label the storeroom, and run a call-out drill and a parts retrieval drill on each shift.
W4
Run and Review
Use the protocol on every real event, hold a short review after each one, and compare the phase timings with the week one baseline.
At the end of the month, decide what to change, what to keep, and which line comes next. The playbook should feel slightly different on the second line, because the second line has different equipment and different failure patterns. If you want help planning that first month, talk through your rollout with an iFactory specialist.
FREQUENTLY ASKED QUESTIONS
What Food Plant Teams Ask About Rapid Maintenance Response
How long does it take to put a response playbook in place?
A first version can be written in a few days, because most of it is agreeing on roles, call-out format, and the escalation checkpoint. The slower work is stocking the right spares and running the drills.
plan a realistic rollout with a demo to plan a realistic rollout for your plant.
Do we need new software to use a playbook like this?
You can start with a laminated card and a shift board, and many plants do. Software becomes valuable when you want reliable timestamps, escalation prompts, and failure history in one place.
get help matching this to your setup to discuss what fits your current setup.
How do we decide which spares belong at the line?
Rank parts by how often they fail and how much downtime their absence causes. Cheap, frequent, line-stopping parts belong at the line, while costly and rare ones can sit with a supplier.
see how failure history guides spares ranking to see how failure history can guide that ranking.
Will a faster response put food safety at risk?
It should not, because the playbook builds lockout, tool counts, sanitation checks, and QA release into the sequence rather than treating them as extras. The time saved comes from searching and waiting, not from skipped controls.
learn how food safety checks are recorded how these checks can be recorded.
How should we measure whether the playbook is working?
Track mean time to repair by phase, time to acknowledge, time to parts, first-time fix rate, and repeat failures. Compare each line against its own baseline before drawing conclusions across the plant.
view how these measures are reported to see how these measures can be reported.
FEWER LOST MINUTES, EVERY LINE-DOWN EVENT
Give Your Team a Response Protocol They Can Trust
Move from improvised emergencies to a rehearsed, measured, food-safe response. See how iFactory can help your plant shorten the time between breakdown and restart.