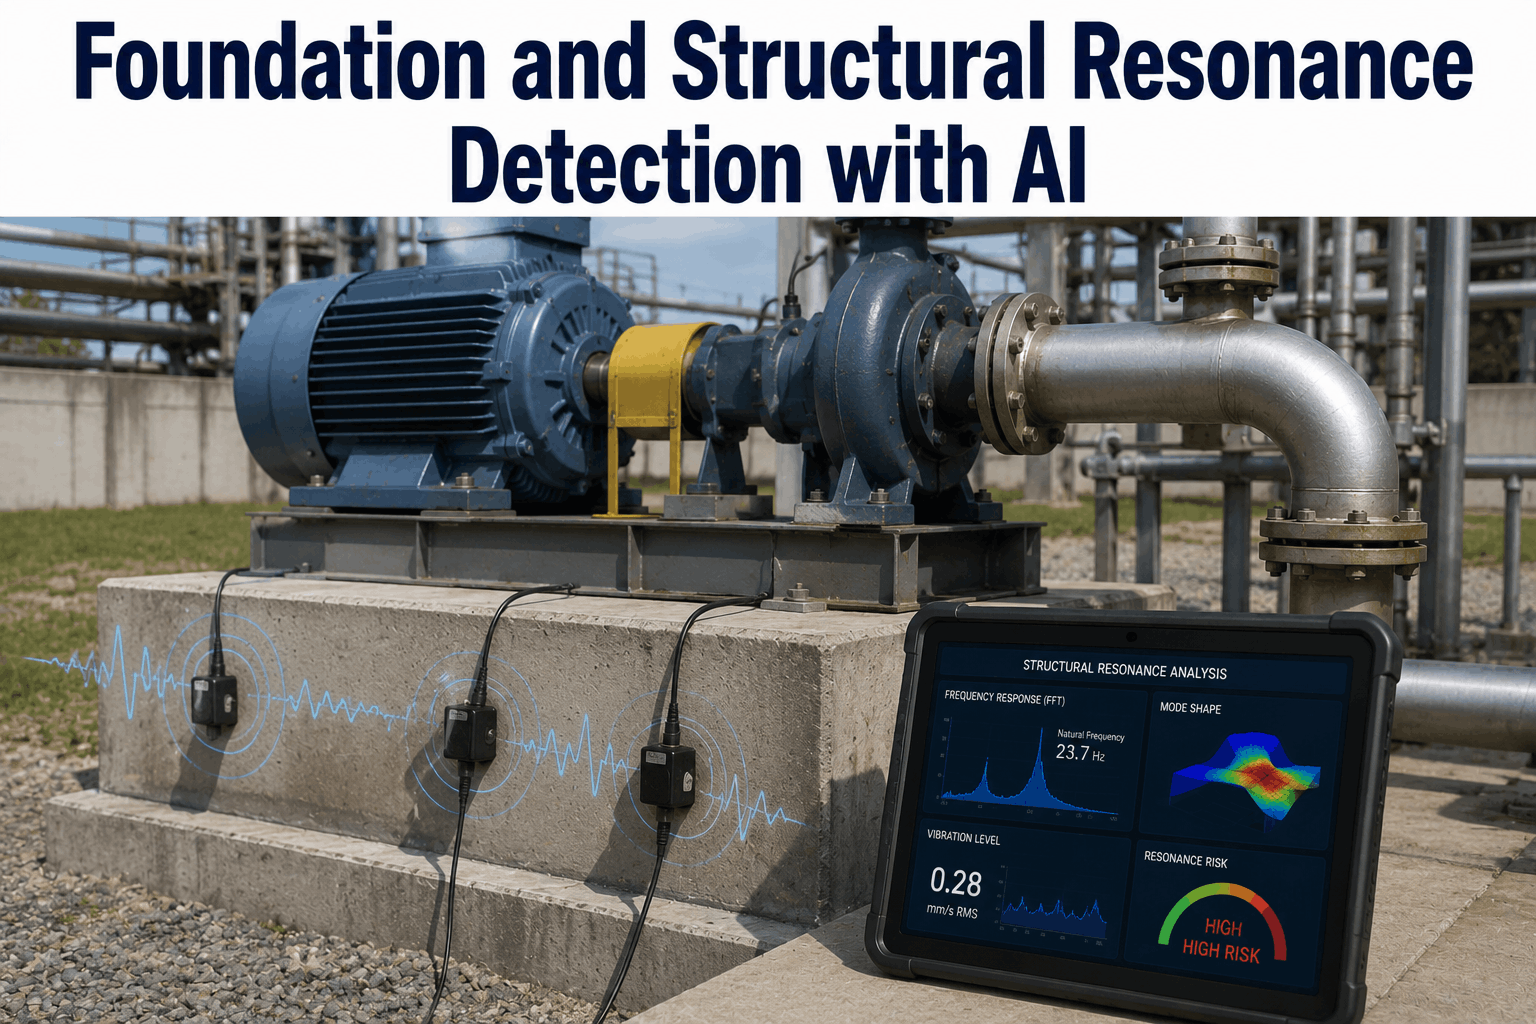
AI identifies structural natural frequencies and resonance conditions that amplify vibration and accelerate fatigue failure in rotating equipment foundations and supporting structures — detecting resonance before cyclic loading accumulates to structural damage. Start Trial Free to see how iFactory gives structural reliability engineers the natural frequency identification and resonance tracking needed to protect equipment foundations and supporting steelwork from vibration-induced fatigue.
Identify Resonance Before It Amplifies Into Structural Fatigue Failure
iFactory tracks natural frequencies of equipment foundations and supporting structures — alerting when operating speed harmonics approach resonant frequencies and when structural stiffness changes indicate fatigue progression.
Why Structural Resonance Causes Failures That Vibration Severity Limits Miss
Resonance amplification is a multiplier on machine-generated vibration, not an additive factor. When a rotating machine operates near the natural frequency of its foundation, baseplate, or supporting structure, the structural response can amplify transmitted vibration by factors of five to fifty times — turning acceptable machine vibration into destructive structural loading without any change in machine condition. Standard vibration severity limits applied at the machine bearing housing do not capture this amplification because the measurement point is the machine, not the structure. AI structural resonance detection identifies when natural frequencies are being excited, quantifies the amplification factor, and tracks structural stiffness changes that indicate whether resonance conditions are developing or worsening. Engineering teams that Book a Demo with iFactory see how structural frequency tracking changes the diagnostic picture for machinery with unexplained vibration severity or recurring structural fastener failures.
-
Natural Frequency Identification
iFactory identifies structural natural frequencies from impact response tests and operational vibration spectra — building a structural frequency map for each equipment foundation and support frame that resonance monitoring references continuously.
-
Operating Speed Resonance Proximity Tracking
iFactory monitors the separation margin between operating speed harmonics and identified natural frequencies — alerting when speed changes, process adjustments, or structural modifications bring running harmonics within a defined proximity band of resonant frequencies.
-
Structural Amplification Factor Quantification
iFactory computes the vibration amplification ratio between machine and structural measurement points — quantifying how much resonance is magnifying transmitted vibration relative to what the machine is generating.
-
Stiffness Degradation Detection
Natural frequency decreases as structural stiffness degrades from fatigue cracking, grout deterioration, or fastener loosening. iFactory tracks natural frequency drift over time as a structural health indicator independent of machine condition.
-
Variable Speed Machine Sweep Monitoring
Variable speed drives that sweep through a speed range can pass through resonant conditions during acceleration and deceleration. iFactory tracks structural response during speed sweeps — identifying transient resonance excitation that steady-state monitoring misses.
-
Multi-Structure Portfolio Comparison
iFactory compares structural frequency maps and amplification factors across similar foundations — identifying structures where stiffness has degraded relative to peer installations as early-stage fatigue indicators before cracking is visible.
Core Structural Resonance Detection Capabilities
-
Operational Modal Analysis: Natural Frequency Extraction from Running Data
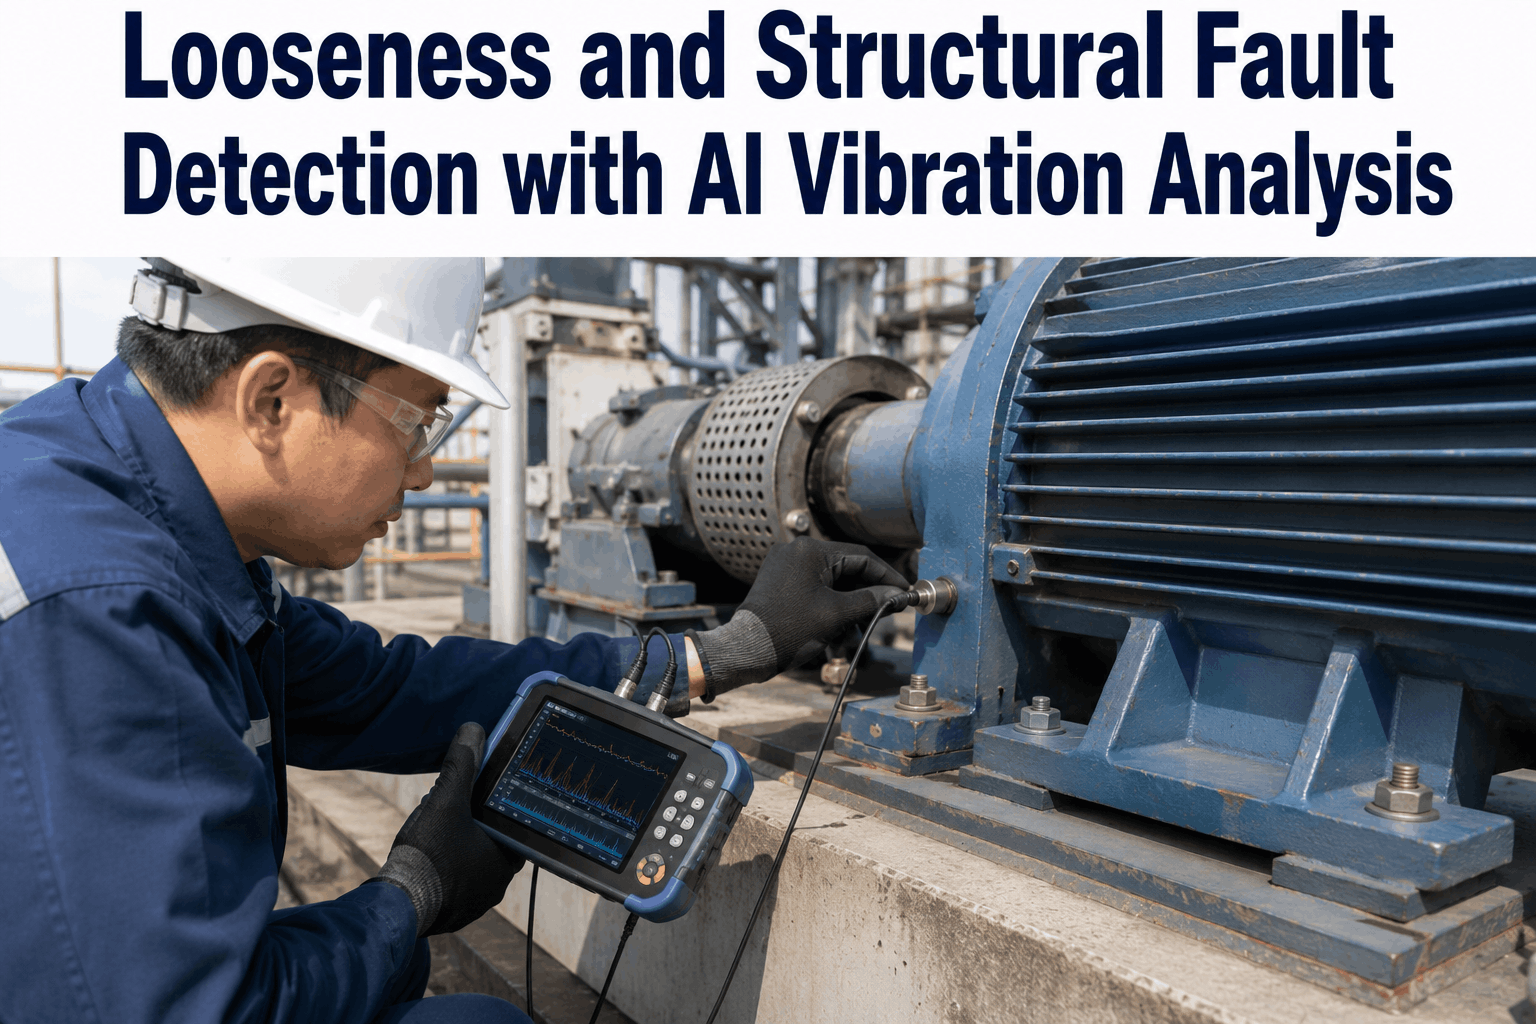
Foundation CapabilityOperational modal analysis extracts natural frequencies, mode shapes, and damping ratios from vibration data collected while the structure is under normal operating loads — without requiring a shutdown impact test. iFactory applies OMA algorithms to multi-channel structural vibration data, identifying natural frequencies as peaks in the power spectral density that respond consistently across measurement points with correlated phase relationships. For rotating equipment foundations, this means structural frequency identification can occur during normal production without a dedicated modal test — and can be repeated periodically to detect frequency shifts caused by stiffness changes. Teams that Start Trial can begin operational modal analysis on priority foundations from existing multi-channel vibration measurement infrastructure.
Analysis Method
Operational modal analysis from production-state vibration data
Output
Natural frequencies, mode shapes, and damping ratios per structure
iFactory Record
Structural frequency map archived per foundation with trend history
-
Resonance Proximity Margin Monitoring
Speed-Frequency RelationshipResonance risk is not binary — it is a function of how close a running speed harmonic is to a structural natural frequency and how much damping the structure provides. iFactory maintains a resonance proximity matrix for each foundation: the natural frequencies identified by operational modal analysis plotted against the machine's operating speed harmonics (1X, 2X, 3X, and higher) across the full operating speed range. When any harmonic falls within the configured proximity band — typically defined as the natural frequency ±20% for lightly damped structures — iFactory generates a proximity alert that quantifies the separation margin and the expected structural amplification at the current operating point. For variable speed machines, the proximity matrix is continuously updated as speed changes. Teams that Book a Demo can review proximity margin configuration for their specific speed range and structural frequency landscape.
Proximity Band
Natural frequency ±20% for lightly damped structures (configurable)
Alert Output
Separation margin percentage and estimated amplification factor
iFactory Record
Proximity margin history tracked per structure and operating speed
-
Structural Stiffness Trend Monitoring via Natural Frequency Drift
Fatigue Progression IndicatorA structure's natural frequency is directly proportional to the square root of its stiffness — as stiffness decreases from fatigue cracking, grout deterioration, anchor bolt loosening, or corrosion, natural frequencies shift downward in proportion. iFactory tracks identified natural frequencies across successive operational modal analyses — detecting downward frequency drift as a structural health indicator that precedes visible cracking or fastener failure by weeks to months. A foundation showing a 5% downward shift in its first bending mode natural frequency over six months is exhibiting stiffness degradation that warrants investigation before the degradation progresses to a crack requiring weld repair or concrete replacement. This frequency-as-health-indicator approach is particularly valuable for foundations where visual inspection access is limited by operating equipment or confined space constraints.
Health Indicator
Downward natural frequency drift indicating stiffness reduction
Alert Threshold
Configurable frequency shift percentage from established baseline
iFactory Record
Natural frequency trend archived per mode per structure over time
-
Grout and Anchor Bolt Integrity Monitoring
Foundation InterfaceGrout voids and loose anchor bolts produce characteristic changes in how machine vibration transmits to the foundation — reduced transmissibility at the bolt frequencies, changes in the coherence between machine and foundation measurements, and in severe cases, impulsive content timed to once-per-revolution excitation as the machine rocks on deteriorated support. iFactory analyzes coherence functions between machine bearing housing and foundation measurements — identifying transmissibility anomalies that indicate grout deterioration or anchor bolt loosening without requiring direct access to grouted surfaces. Early detection of grout deterioration enables targeted foundation repair during planned maintenance rather than emergency concrete work following a structural failure. Teams that Start Trial can configure grout integrity monitoring for critical machinery foundations from iFactory's first session.
Analysis Method
Coherence function between machine and foundation measurement points
Fault Indicators
Transmissibility anomalies, impulsive content at 1X frequency
iFactory Record
Coherence trend tracked per foundation interface measurement pair
-
Pipe and Structural Frame Resonance in Process Plant
Connected Structure AnalysisResonance in industrial facilities is not limited to equipment foundations — process piping, heat exchanger shells, structural steel frames, and equipment skids all have natural frequencies that can be excited by rotating machine harmonics, pulsating flow, or acoustic standing waves in connected piping. iFactory extends structural resonance monitoring beyond machine foundations to connected structures — tracking pipe span vibration, structural frame response, and skid natural frequencies against the frequency content generated by connected rotating equipment and process flow. Pipe resonance is particularly significant for systems with reciprocating compressors or pumps, where pulsation-driven excitation at multiples of stroke frequency can excite pipe span natural frequencies and produce fatigue failures at welded connections. Teams that Book a Demo can review structural resonance monitoring coverage for process piping and connected structures in their facility.
Structure Types
Process piping, heat exchanger shells, structural steel frames, skids
Excitation Sources
Rotating harmonics, pulsation frequencies, acoustic standing waves
iFactory Record
Structural response spectrum archived per connected structure
-
Fatigue Life Estimation from Stress Cycle Accumulation
Remaining Life AnalysisStructural fatigue failure results from cumulative stress cycle accumulation at stress concentrations — and when resonance amplifies stress cycles by a factor of ten, a structure designed for fifty years of operation may accumulate fatigue damage in five. iFactory uses measured structural vibration amplitudes, known structural geometry, and material S-N curve data to estimate cumulative fatigue damage accumulation at critical weld and connection locations — providing a remaining structural life estimate that prioritizes inspection and repair sequencing. Structures operating near resonance with degraded damping are flagged for accelerated inspection schedules based on calculated damage accumulation rates rather than fixed calendar intervals. Teams that Start Trial can configure fatigue life estimation for critical structural connections in iFactory's structural health module.
Estimation Method
Rainflow cycle counting with S-N curve damage accumulation
Output
Cumulative damage fraction and remaining fatigue life estimate
iFactory Record
Fatigue damage accumulation rate tracked per structural connection
Structural Resonance Detection Performance Indicators
Resonance Detection Lead Time
Operational modal analysis with stiffness drift tracking detects resonance risk 90 days ahead of structural failure versus zero lead time for visual inspection programs.
Natural Frequency Shift vs Stiffness Loss
Natural frequency drops predictably as structural stiffness degrades — a 25% stiffness loss produces a 13% frequency shift that iFactory's trend tracking detects before visible damage appears.
Amplification Factor at Resonance
Resonance amplifies machine-generated vibration by 5 to 50 times at the structural level — making resonance conditions the dominant structural fatigue driver even when machine vibration is within acceptable ISO limits.
Fatigue Life Consumed at Resonance vs Off-Resonance
A structure operating at resonance can consume its full fatigue life in one year — the same structure operating 20% away from resonance consumes approximately 4% annually, a 25x difference in remaining life.
Structural Resonance Monitoring: Reference Specifications
Scroll for more
| Monitoring Parameter | Analysis Method | Alert Condition | iFactory Data Source | Review Frequency |
|---|---|---|---|---|
| Natural Frequency Map | Operational modal analysis | Frequency shift >5% from baseline | Multi-channel structural vibration | Monthly re-analysis |
| Resonance Proximity | Speed harmonic vs natural frequency | Separation margin <20% | Speed signal + structural frequency map | Continuous |
| Stiffness Drift | Natural frequency trend tracking | Downward drift >3% per quarter | Repeated OMA results per structure | Quarterly |
| Grout and Bolt Integrity | Coherence function analysis | Transmissibility anomaly or 1X impulsive | Machine-to-foundation measurement pairs | Monthly |
| Fatigue Life Accumulation | Rainflow counting + S-N curve | Damage fraction >50% of design life | Structural vibration amplitude history | Quarterly |
How iFactory Supports Foundation and Structural Resonance Programs
Structural resonance is the hidden multiplier in rotating equipment failure analysis — machines can be in good mechanical condition, properly aligned, and operating within vibration severity limits while their foundations are experiencing fatigue loading that no standard bearing or vibration alarm will detect. iFactory provides the structural monitoring layer that rotating equipment programs typically lack: operational modal analysis identifying natural frequencies from existing vibration infrastructure, proximity margin tracking that alerts when speed harmonics approach structural resonant frequencies, and natural frequency drift monitoring that detects stiffness degradation before it progresses to visible structural damage. When iFactory identifies a 7% downward shift in a compressor foundation's first bending mode frequency over eight months, combined with a 2X proximity margin of 15% at operating speed, reliability engineers have the structural evidence to schedule foundation inspection and potential stiffness restoration before a fatigue crack forces an emergency repair. Facilities can Start Trial and begin structural frequency mapping from existing multi-channel vibration measurement infrastructure within the first iFactory configuration session.
Operational Modal Analysis
iFactory extracts natural frequencies, mode shapes, and damping ratios from operational vibration data — building structural frequency maps without shutdown impact tests using existing sensor infrastructure.
Resonance Proximity Alerting
iFactory monitors separation margins between running speed harmonics and structural natural frequencies — generating proximity alerts with estimated amplification factors when separation falls within the configurable risk band.
Stiffness Degradation Tracking
iFactory tracks natural frequency drift as a structural stiffness health indicator — detecting grout deterioration, anchor bolt loosening, and fatigue-induced stiffness loss weeks before visible structural damage appears.
Fatigue Life Estimation
iFactory applies rainflow cycle counting and S-N curve damage accumulation models to measured structural vibration — producing remaining fatigue life estimates that prioritize inspection sequencing at critical structural connections.
Deploying Structural Resonance Monitoring: Implementation Steps
01
Identify Structures and Sensor Coverage
Inventory existing vibration sensors on equipment foundations, structural frames, and connected piping — assessing which structures have sufficient measurement coverage for operational modal analysis and which require additional sensor installation.
02
Run Initial Operational Modal Analysis
Execute iFactory's OMA workflow on priority foundations to extract initial natural frequency maps — establishing the structural baseline frequencies that stiffness drift monitoring and proximity tracking will reference throughout the monitoring program.
03
Map Operating Speed Harmonics to Structural Frequencies
Build the resonance proximity matrix in iFactory for each machine-structure pair — mapping 1X through 5X running speed harmonics against identified natural frequencies to identify existing proximity risks and define the alert bands.
04
Configure Stiffness Drift and Proximity Alerts
Set frequency drift alert thresholds and proximity margin limits in iFactory for each monitored structure — defining the conditions that trigger engineer notification and those that generate immediate inspection work orders.
05
Establish Fatigue Life Reference Data
Load structural material specifications and weld configuration data into iFactory's fatigue module — enabling rainflow damage accumulation calculations at critical connections using the measured vibration history and material S-N curves.
06
Schedule Repeat OMA and Trend Reviews Quarterly
Configure quarterly operational modal analysis re-runs in iFactory to refresh natural frequency maps — tracking stiffness trend direction over successive analyses and updating proximity matrices when speed ranges or structural conditions change. Book a Demo to see the full structural monitoring workflow.
Frequently Asked Questions
What is structural resonance and why is it dangerous for rotating equipment?
Structural resonance occurs when a machine's operating speed harmonic coincides with the natural frequency of its foundation or supporting structure — causing the structure to amplify the transmitted vibration by factors of 5 to 50 times. This amplification dramatically accelerates fatigue damage accumulation at structural connections, producing failures that standard machine vibration severity monitoring cannot predict.
How does iFactory identify structural natural frequencies without a shutdown impact test?
iFactory applies operational modal analysis algorithms to vibration data collected during normal operation — extracting natural frequencies, mode shapes, and damping ratios from the operational response without requiring a dedicated impact test or production interruption.
What sensors are required for structural resonance monitoring?
Structural resonance monitoring requires accelerometers placed on the foundation, baseplate, and structural members surrounding the machine — typically three to six measurement points per foundation for adequate mode shape identification. Many facilities already have partial coverage that iFactory can supplement rather than fully replace.
How much frequency separation is needed to avoid resonance risk?
A separation margin of at least 20% between any operating speed harmonic and the nearest structural natural frequency is the generally accepted minimum for lightly damped industrial structures. iFactory configures the proximity alert band based on the measured damping ratio of each structure — tighter margins are acceptable for more heavily damped foundations.
Can iFactory detect resonance in variable speed machines that sweep through a speed range?
Yes. iFactory tracks the resonance proximity matrix continuously as speed changes — identifying transient resonance excitation during acceleration and deceleration sweeps and quantifying the structural response amplitude during resonance passage to assess fatigue impact from repeated startups and shutdowns.
Detect Structural Resonance Before It Consumes Your Foundation's Fatigue Life
iFactory gives structural reliability engineers the operational modal analysis, resonance proximity tracking, and stiffness degradation monitoring needed to protect rotating equipment foundations and supporting structures from vibration-induced fatigue — without requiring shutdown impact tests or dedicated structural instrumentation programs.