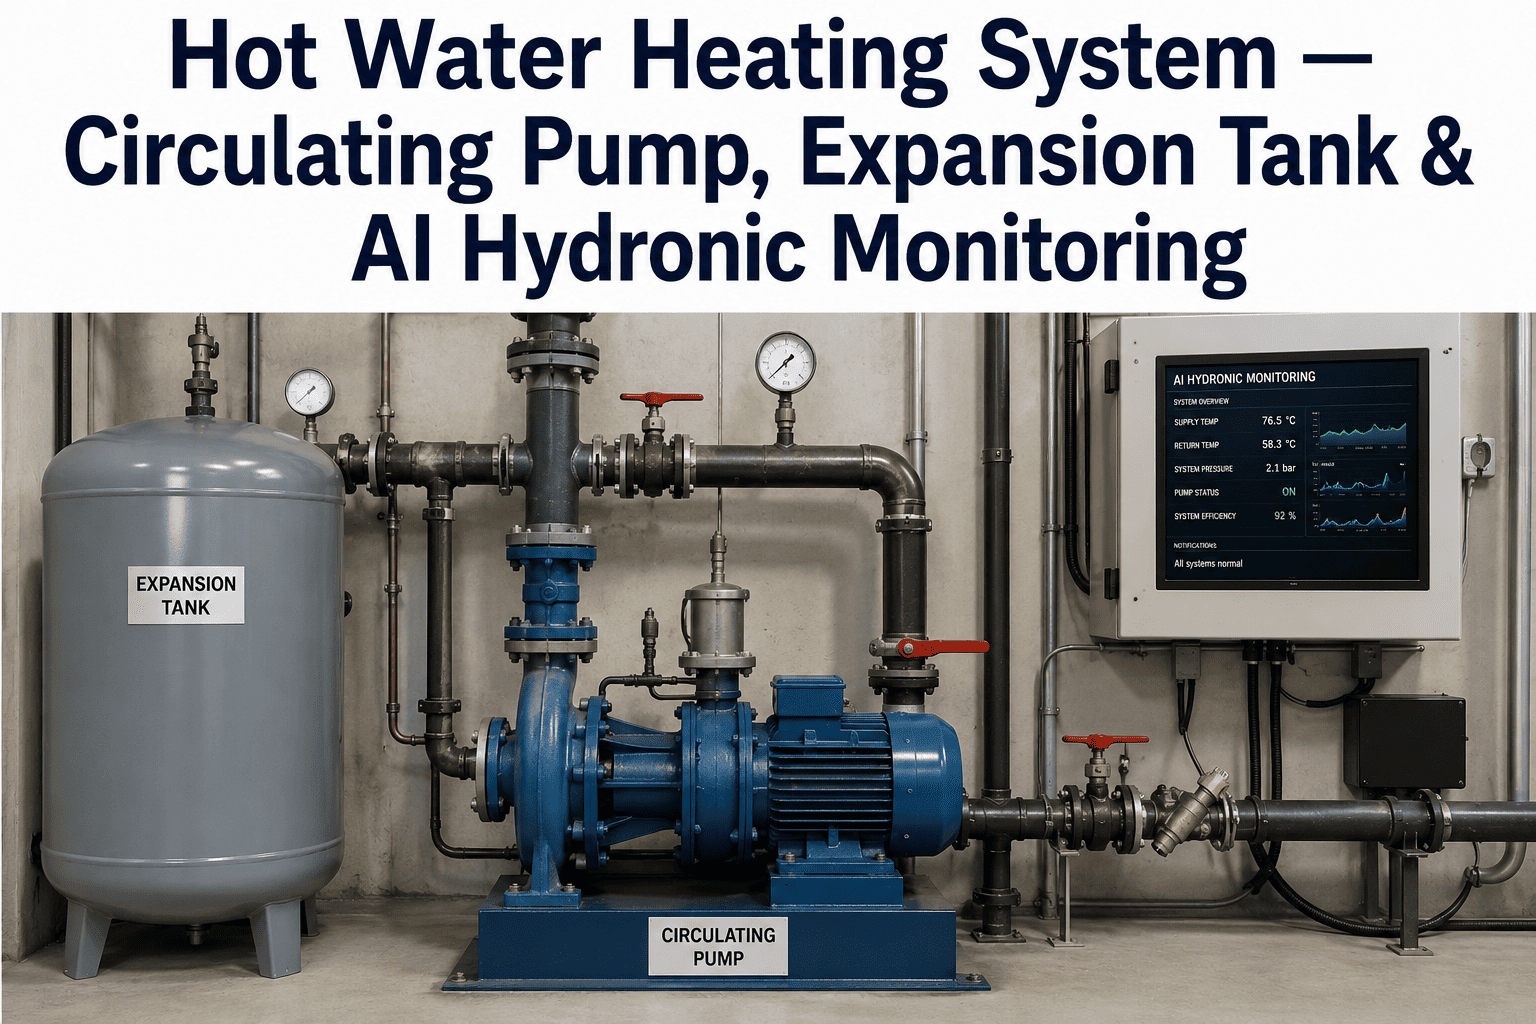
A hydronic heating system is deceptively simple on paper, a pump moves hot water through a closed loop, an expansion tank absorbs the water's thermal expansion, and radiators or air handlers give up the heat where it is needed. In practice, that closed loop depends on a handful of components staying in a narrow operating range, and when even one of them drifts, the whole system can start failing in ways that look like unrelated problems. A waterlogged expansion tank shows up as banging pipes. A cavitating pump shows up as uneven heat across the building. Neither looks like what it actually is until someone traces it back. Get a closer look at how continuous hydronic monitoring catches these earlier at ifactory support.
Find the Pump and Tank Problems Before Occupants Feel Them
AI reads circulating pump performance, expansion tank precharge, and system pressure together, catching the slow drift toward cavitation, waterlogging, and air-locked circuits before a heating call ever comes in.
Three Failures That Look Nothing Like Their Actual Cause
Pump cavitation is one of the most common and most misdiagnosed hydronic problems. It happens when the pump's suction side pressure drops low enough that dissolved gases or vapor bubbles form and then collapse violently as they hit the higher pressure zone near the impeller, and that collapse pits the impeller surface over time. From an occupant's perspective, cavitation shows up as reduced flow, a grinding or rattling sound near the pump, and rooms that never quite reach setpoint even though the boiler is firing normally. Because the boiler itself looks fine, the actual root cause often gets missed for weeks.
A waterlogged expansion tank is the second common failure, and it happens gradually as the air cushion inside a bladder-style or diaphragm tank slowly leaks out or the bladder itself fails. Without that air cushion to absorb thermal expansion, system pressure swings become far more severe with every heating cycle, tripping relief valves, causing banging or hammering noises in the piping, and in more severe cases stressing joints enough to cause leaks. The third common failure, air-locked circuits, happens when trapped air accumulates in high points of the piping system faster than it can be purged, blocking flow to specific zones while leaving the rest of the building heating normally, which makes it maddeningly hard to diagnose from a single building-wide temperature reading.
| Check Item | What Continuous Data Shows | Manual Equivalent |
|---|---|---|
| Pump suction pressure margin | Live trend against cavitation onset threshold | Annual pressure gauge spot check |
| Expansion tank air charge | Pressure swing amplitude per cycle | Manual precharge test, once a year |
| Zone return temperature spread | Continuous comparison across all zones | Room-by-room complaint tracking |
| System makeup water volume | Trended consumption, flags hidden leaks | Monthly meter reading review |
Bring a Season of Pressure Readings to a 30-Minute Call
We will walk through what a continuous view of pump and expansion tank performance would have shown across last winter's heating cycles.
Why Peak Demand Days Expose Every Hidden Weakness at Once
A hydronic system with a slightly undersized air cushion or a pump running close to its cavitation threshold can often get through mild weather without any obvious symptoms, because the system is not being pushed hard enough to expose the weakness. The first genuinely cold week of the season changes that instantly. Every zone calls for heat simultaneously, the pump runs at higher speed and longer duration than it has in months, and thermal expansion cycles the system pressure harder and more often. This is exactly when a marginal expansion tank finally waterlogs completely, and exactly when a pump riding close to cavitation finally starts pitting badly enough to lose meaningful flow.
The unfortunate pattern this creates is that hydronic failures cluster on the coldest days of the year, which is also when a comfort complaint is least tolerable and when contractor availability for an emergency call is at its worst. Catching the underlying drift during a mild October instead of discovering it during a January cold snap is the entire value proposition of continuous monitoring, and it turns a heating emergency into a scheduled repair completed weeks ahead of the load that would have exposed it.
Why Older Buildings Are More Exposed Than New Construction
Hydronic systems installed decades ago tend to carry more of this risk than newer construction, and not just because the pumps and tanks themselves are older. Piping layouts in older buildings were frequently designed and modified over multiple renovation cycles, often without a full as-built update, which means high points prone to air trapping are not always where the original drawings suggest they should be. Expansion tanks are also more likely to have been undersized relative to a system that has since been expanded with additional zones, meaning even a tank with a perfectly intact air charge may not have enough capacity to handle the thermal expansion of the system it is now attached to.
None of this means an older building's hydronic system is destined to fail, it means the value of continuous, data-driven visibility is proportionally higher, since institutional knowledge about exactly how the piping was modified over the years is often incomplete or lost entirely when staff turn over. A pressure and flow trend that isolates a specific zone as chronically underperforming does the diagnostic work that an incomplete set of as-built drawings cannot, regardless of how old or how modified the underlying system has become.
Coordinating Boiler Plant Health With Distribution System Health
It is easy to focus heating system attention entirely on the boiler itself, since that is usually the largest, most visible piece of equipment in the plant, but a perfectly healthy boiler sitting behind a struggling distribution system will still produce comfort complaints and wasted energy. A pump losing capacity to cavitation forces the boiler to run longer to deliver the same heat to occupied spaces, and an air-locked zone can leave a boiler cycling normally while a portion of the building it is meant to serve receives almost no benefit from that cycling at all. Watching pump, tank, and zone-level performance together with boiler firing data gives a genuinely complete picture of where heating energy is actually going, rather than assuming the boiler's own operating data tells the whole story on its own.
Frequently Asked Questions
Get Continuous Visibility Into Your Hydronic Loop
Bring last winter's pressure and flow data to the call, and we will show what a continuous health score would have flagged before the first cold snap.