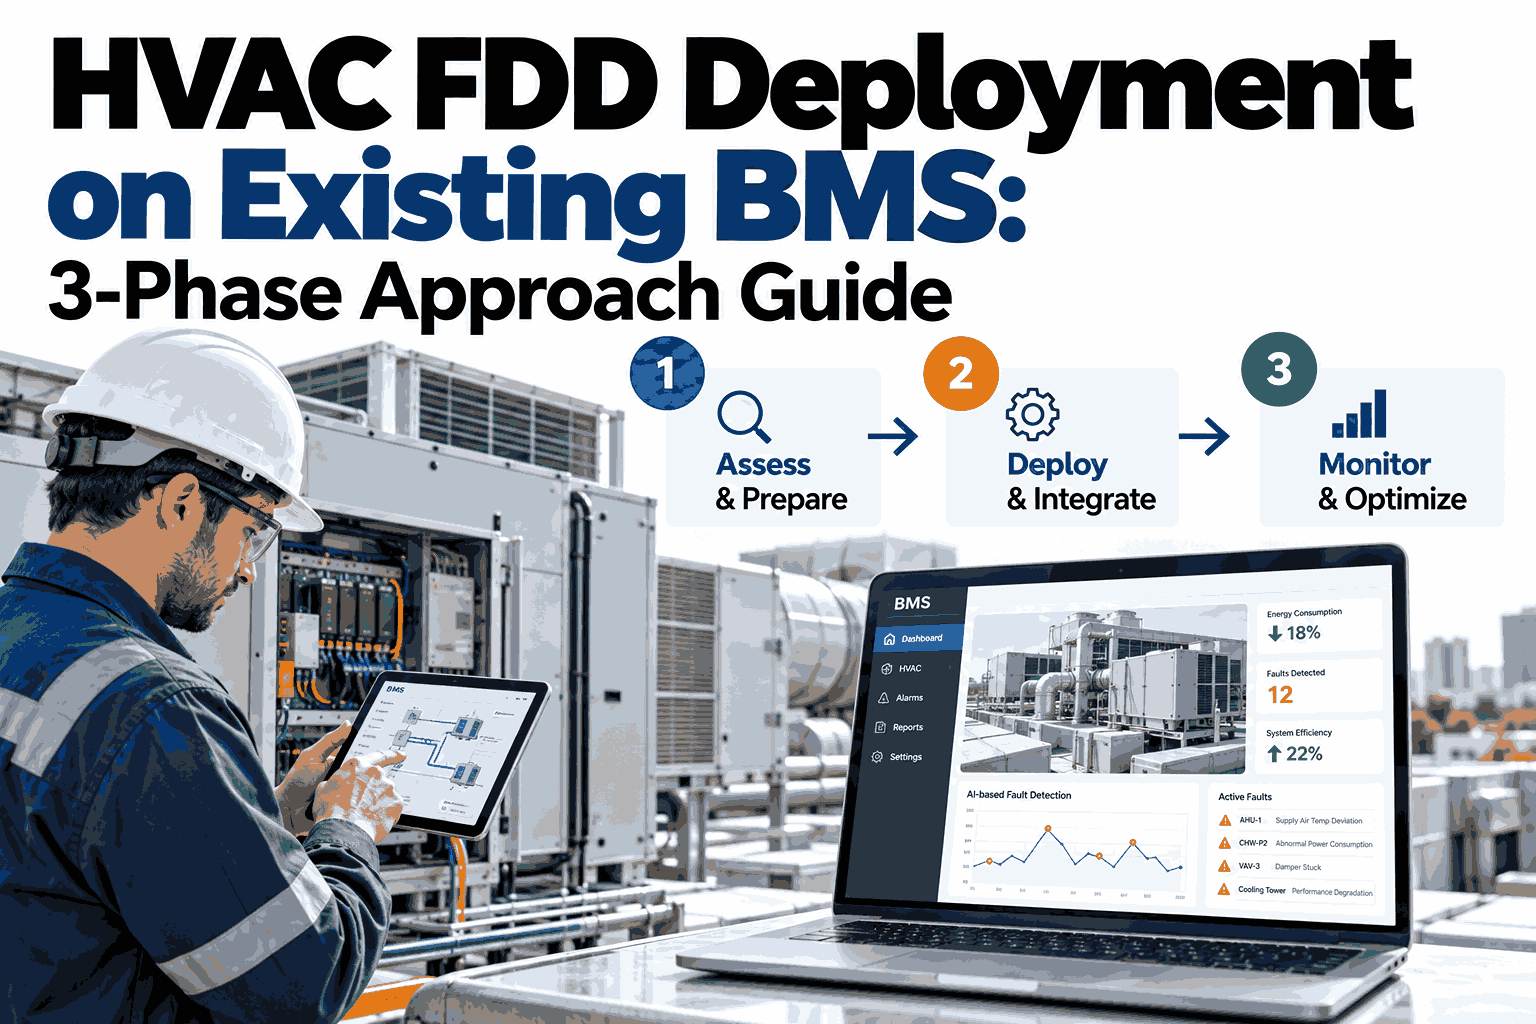
Most building teams assume fault detection means replacing the control system, so the project gets postponed for years. In practice, the existing building management system already holds the trend data that analytics needs, and the work is mostly about connecting to it carefully. A phased overlay lets a team prove value on a few air handlers before committing to a whole portfolio. The three phases below show how that rollout usually runs, and facilities teams that want it scoped for their site can ask iFactory AI which of their BMS points are already usable.
Add Fault Detection to the BMS You Already Own, in Three Phases
iFactory AI layers analytics over your current building automation system, so you keep your controls, your contractors and your graphics while gaining continuous fault detection.
Overlay Versus Rip and Replace
The biggest barrier to fault detection is the belief that it requires a new controls platform. An overlay reads from what already exists, which changes the cost, the risk and the timeline.
The Three-Phase Roadmap
Each phase has a clear purpose and a clear exit condition, so the team knows when to move on and nobody is asked to trust the system before it has earned it.
Connect and Discover
Secure, read-only access to the BMS is established and every air handler, chiller and boiler point is mapped to a standard naming model.
Baseline and Calibrate
Normal behaviour is learned for each unit, thresholds are tuned to the building, and early findings are reviewed with the operators.
Go Live and Act
Alerts, work orders and dashboards are switched on, the team is trained, and coverage expands to the rest of the portfolio.
See What Your Existing BMS Is Already Telling You
Book a 30-minute session and iFactory AI will review your BMS vendor, point list and equipment mix to outline a realistic pilot.
What the Timeline Looks Like
A typical overlay runs about 6 to 12 weeks from kickoff to live monitoring. The chart shows how the phases overlap, because calibration can begin while later equipment is still being connected.
The Data an Overlay Reads
Most air handlers already trend the points that fault detection depends on. The table shows what is typically needed and what it is used for.
| Point Group | Examples | Used To Detect |
|---|---|---|
| Temperatures | Supply, return, mixed, outdoor air | Economizer faults and coil problems |
| Commands and Feedback | Damper, valve and fan speed signals | Stuck, leaking or disconnected actuators |
| Pressures and Flows | Duct static and airflow readings | Fan, filter and distribution issues |
| Schedules and Setpoints | Occupancy and setpoint changes | Equipment running when it should not |
Common Worries and Straight Answers
Teams considering an overlay tend to raise the same concerns. Each one has a practical answer worth hearing before the project starts.
Are You Ready for Phase 1?
Readiness does not mean perfect data. It means a few basics are in place, and most buildings already clear them.
A Composite Scenario: The Pilot That Grew
This is a composite example rather than a named customer. It shows how a modest pilot often unfolds in a mixed commercial portfolio.
What iFactory AI Brings to the Overlay
iFactory AI is smart manufacturing and industrial software that applies fault detection and root-cause diagnostics to the equipment keeping a facility running. See the platform running on a live building to judge it for yourself.
Works With Your BMS
Reads from the system already installed, so controls, graphics and contractor relationships stay exactly as they are.
Root-Cause Diagnostics
Findings point to a likely cause, not just a symptom, which cuts diagnostic time on every call-out.
Operator-Reviewed Rollout
Each early finding is validated with your team before alerts spread, protecting credibility from day one.
Evidence With Every Alert
Trend data accompanies each fault so technicians can confirm the issue quickly and fix it with confidence.
Frequently Asked Questions
Do we have to replace our BMS to use fault detection?
No. An overlay reads data from the BMS you already have, so nothing needs to be ripped out. The main requirement is access to trended points. The support team can confirm compatibility with your vendor before any commitment.
How long does a phased deployment really take?
A typical rollout lands between 6 and 12 weeks, depending on how clean the point naming is and how many buildings are involved. Smaller pilots can show findings sooner. A scoping session gives a more accurate estimate for your portfolio.
Can we start with just a few units?
Yes, and most teams should. A small pilot proves the approach, builds operator trust, and exposes any data gaps early. Expansion then becomes a routine step rather than a leap of faith for the whole organisation.
What happens to the BMS during deployment?
Day-to-day control is unaffected, because the overlay observes rather than commands when run read-only. Your operators keep using the same interface. See how read-only access is set up in a live walkthrough.
Who needs to be involved from our side?
Usually a facilities lead, someone with BMS or network access, and a technician to act on early findings. Their time is concentrated in the first weeks, and the commitment drops once the system is running.
Start With a Pilot on the BMS You Already Have
iFactory AI turns your existing building data into continuous fault detection without replacing a single controller. Book a walkthrough to plan a three-phase rollout for your own site.