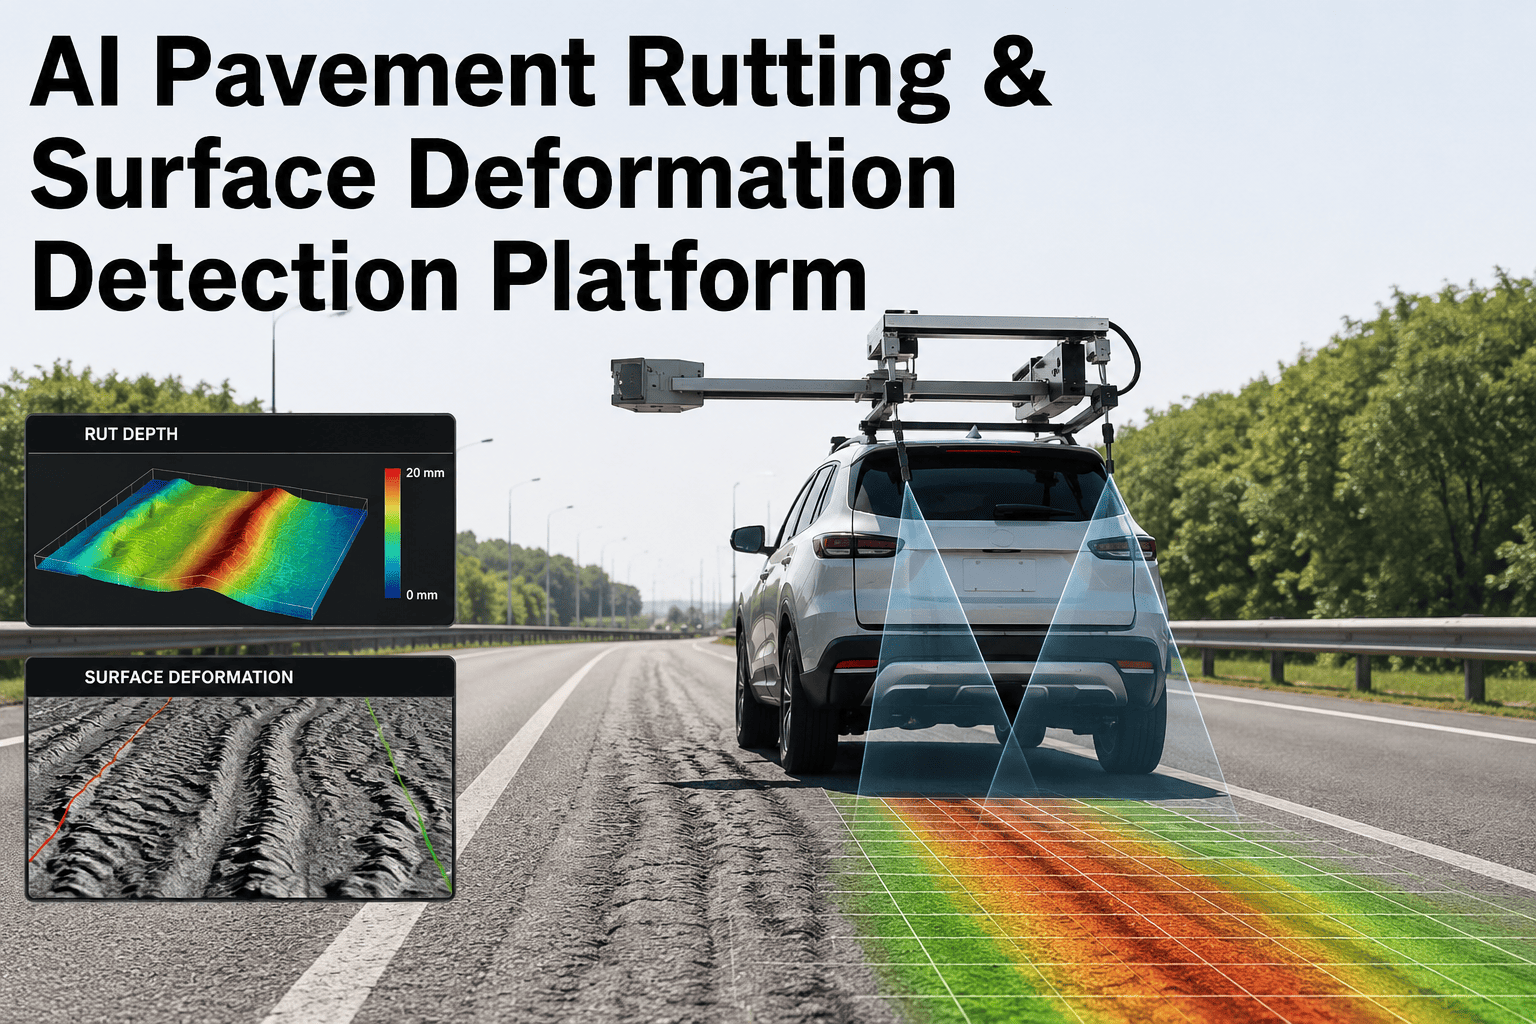
A rutting depth of half an inch across a busy arterial lane is enough to trap standing water, reduce tire contact under braking, and turn a routine evening commute into a hydroplaning risk. Most agencies still find this kind of surface deformation the way they always have, through a windshield survey, a paper rating sheet, and a backlog of segments that all look urgent once someone finally drives every mile of them. By the time a rut, shove, or depression gets logged in a spreadsheet, it has usually already widened past the point where a thin resurfacing pass would have fixed it, and the budget line jumps from preventive to reconstructive. iFactory's AI pavement rutting and surface deformation detection platform turns every inspection pass, whether from a survey van, a drone, or a routine fleet vehicle, into structured depth data your team can rank and act on, and you can book a demo to see it scored against your own network.
Every Rut, Shove, and Depression Measured Automatically, Not Guessed From a Windshield
iFactory's AI pavement platform converts road imagery and depth scans into a network-wide rutting and surface deformation map, replacing subjective field ratings with consistent, repeatable condition scores your maintenance team can prioritize against.
Why Manual Rutting Surveys Miss the Segments That Matter Most
Rutting and surface deformation develop slowly under repeated traffic loading, which makes them easy to underrate during a single visual pass and easy to overrate when a rater is being cautious after a recent complaint. Two inspectors walking the same stretch of road on the same day routinely record different severity classes for the same rut, because a windshield survey depends on judgment calls that are never quite consistent from person to person, season to season, or even hour to hour as lighting and fatigue change what the eye picks up. That inconsistency does not just create noisy data, it actively misallocates budget, sending crews to segments that look bad in bright afternoon light while a genuinely deteriorating rut nearby gets rated as acceptable because it was inspected on an overcast morning.
From Road Imagery to a Ranked Repair List in Five Steps
The platform is built around the same principle that made vision-based inspection work well in other asset-heavy industries: capture the surface consistently, measure it against a fixed reference, and let a trained model do the classifying instead of a rater under time pressure. None of this requires closing a lane or slowing traffic for a special survey pass, since the imagery can come from equipment already moving through the network. Here is what happens between a camera passing over a road segment and that segment landing on a prioritized work order.
The result is a rating that does not depend on who drove the survey vehicle or what the weather looked like that morning. A rut measured at eleven millimeters in March reads the same way in September, which is what makes trend analysis over multiple survey cycles actually meaningful instead of noise stacked on noise.
What the Platform Actually Measures on Every Pass
Rutting is only one type of surface deformation, and treating every dip in the road the same way leads to the wrong repair being scheduled. A shallow rut from tire wear needs a different fix than a deep depression caused by base failure, and the platform is built to tell those apart automatically rather than lumping everything under one generic distress label.
Stop Ranking Repairs by Guesswork and Complaint Calls
iFactory scores every segment on your network the same way, every time, so the worst rutting and deformation rise to the top of the work order queue automatically. Book a demo and bring a stretch of your own road network to see it scored live.
Manual Survey, Laser Van, or AI Vision, What Actually Fits Your Network
Every road agency eventually compares the same three options, and each one makes sense for a different combination of network size, budget, and survey frequency. The table below lays out where each method genuinely earns its cost rather than treating them as interchangeable.
| Method | Best Fit | Key Trade-Off |
|---|---|---|
| Manual Windshield Survey | Very small networks with limited budget for equipment or software | Cheapest to start, but inconsistent ratings and slow coverage over larger mileage |
| Laser Profiler Survey Van | State-level networks needing certified roughness and rut depth data | Highly accurate hardware, but expensive per mile and typically run only once a year |
| AI Vision-Based Platform | Agencies wanting frequent, low-cost surveys across large or growing networks | Runs on standard vehicle-mounted cameras or drones, enabling far more frequent passes |
Many agencies do not have to choose only one. A common pattern is to keep a laser profiler pass for the annual certified dataset while running the AI platform on a quarterly or monthly cycle across the full network, catching deterioration between the expensive survey cycles instead of waiting a full year to find out a segment has crossed into failure. Over two or three survey cycles, that combination also produces the first deterioration trend line most agencies have ever had for their secondary road network, since annual laser data alone is too sparse to show how quickly a given segment is actually moving toward failure.
Four Places Rutting and Deformation Detection Pays for Itself
Once the workflow is running, agencies find it useful well beyond the annual condition survey. It becomes a standing input into planning, safety review, and post-event assessment, compounding the value of the initial rollout.
Consistency Is the Feature, Not the Accuracy Number
It is tempting to compare detection methods purely on accuracy percentages, but the more important question for a maintenance program is consistency over time. A human rater's judgment shifts subtly with fatigue, weather, lighting, and even mood, which means the same road can drift up or down in reported condition without the pavement itself changing at all. An AI model applies the exact same measurement logic to every frame it processes, so a change in the reported score reflects an actual change in the road surface, not a change in who was driving the survey vehicle that week.
This matters most when agencies try to build a deterioration curve, the trend line that predicts when a segment will cross from acceptable into needing intervention. A noisy rating history makes that curve almost useless, since the model cannot tell whether a jump in severity is a real deterioration event or just rater variance. Clean, consistent AI-scored data turns the deterioration curve into something planners can actually trust when deciding whether to fund preventive maintenance this year or defer it, and getting that timing right is often the single biggest lever an agency has over its long-term pavement budget.
What Agencies Report After Deploying AI Rutting Detection
These figures reflect documented outcomes from agencies and highway operators that have moved rutting and deformation detection from occasional manual surveys to a continuous AI-scored workflow, once the tool becomes a normal part of how condition data gets collected rather than a one-time pilot project.
How Agencies Introduce AI Rutting Detection Without Disrupting Existing Surveys
Agencies get the fastest value by running the AI platform alongside their existing survey process first, rather than replacing it outright before the team trusts the output. A staged rollout builds that trust while the historical baseline is still being established.
Questions Agencies Ask Before Rolling Out AI Rutting Detection
Turn Your Next Survey Pass Into Ranked, Trustworthy Condition Data
iFactory measures rutting and surface deformation the same way on every mile, every survey cycle, so your maintenance budget goes to the segments that actually need it first. Book a demo and bring your own road imagery to see it scored.