Every maintenance manager in wastewater knows the cycle. A sinkhole opens on Birch Street. An emergency crew is dispatched. The repair cost runs three times what planned rehabilitation would have been. The city council asks why the pipe was not on the priority list. The answer is not that nobody knew the pipe was in poor condition — it is that the pipe was one of hundreds with CCTV data sitting in a folder, waiting for someone to manually compile defect scores, cross-reference against GIS attributes, and build the presentation that justifies the budget. That manual process takes three to six months. By the time the plan is ready, the sinkhole has already made the decision. AI condition-based prioritisation eliminates this sequence entirely — turning inspection data into a risk-weighted, budget-optimised rehabilitation plan in minutes instead of months, with every decision traceable to a NASSCO PACP defect code and a consequence-of-failure score.
The Pipe That Fails Is Not Always the Pipe in Worst Condition — It Is the Pipe Whose Risk Score Was Never Calculated. AI Closes the Gap Between Inspection Data and Capital Plan.
iFactory's AI-based prioritisation platform ingests existing CCTV and manhole inspection data, applies NASSCO-standard condition scoring with custom risk weighting, and generates defensible, presentation-ready rehabilitation plans that optimise every dollar of your collection system budget.
The Structural Gap in Collection System Rehabilitation Planning
Most wastewater utilities inspect less than 4% of their collection network annually — a 25-year assessment cycle that means the average pipe is inspected once every quarter-century. The pipes that are inspected generate CCTV footage that a NASSCO-certified operator reviews frame by frame, coding each structural and O&M defect. The result is a PACP-compliant dataset that accurately describes the condition of each inspected segment. The gap is not in the quality of the inspection data. The gap is in what happens next.
Translating defect codes into a risk-weighted capital plan requires compiling condition scores across hundreds or thousands of segments, overlaying consequence-of-failure data from GIS — pipe material, diameter, depth, proximity to critical infrastructure, soil type, hydraulic criticality — and then ranking every asset by combined risk. This work traditionally takes three to six months of engineering analysis, spreadsheet compilation, and manual report writing. By the time the plan is presented, the inspection data may already be two years old, and the budget cycle has moved on. Maintenance managers end up defending reactive emergency spending before city councils that keep asking why the same pipes keep failing without receiving a data-backed answer. AI condition-based prioritisation compresses the entire sequence — from inspection upload to risk-scored, budget-ready rehab plan — into a single session.
The Traditional Planning Timeline vs. AI-Powered Planning
Traditional Manual Process
Week 1-4Manual CCTV review and defect coding verification
Week 5-8Manual data export to spreadsheets for condition scoring
Week 9-16GIS overlay and consequence-of-failure analysis
Week 17-24Report writing, council presentation preparation
ResultPlan is outdated before approval. Reactive spend dominates.
Hour 2Risk weighting applied. LOF and COF scores calculated per asset.
Hour 3Priority-ranked rehabilitation plan with cost estimates generated.
Hour 4Presentation-ready maps, reports, and budget justification documents.
ResultPlan is live before the shift ends. Proactive spend is defensible.
The Four Pillars of AI Condition-Based Rehabilitation Prioritisation
iFactory's AI prioritisation engine is built on four integrated capabilities that work together to transform raw inspection data into an actionable capital plan. Each pillar addresses a specific failure point in the traditional planning process, and together they create a continuous, live prioritisation system that updates as new inspection data arrives.
01
Automated Condition Scoring
The AI ingests CCTV inspection data in any format and applies NASSCO PACP and MACP standard condition grading automatically — structural severity scores from 1 to 5 for every defect, segmented by structural and O&M categories. Manhole inspection data is scored simultaneously using MACP protocols. The result is a complete, standardised condition inventory of the collection system without manual coding backlogs. Every score is traceable to the original defect observation, which means the condition dataset is audit-ready from the moment it is generated.
02
Risk-Weighted Prioritisation
Condition scores alone do not determine rehabilitation priority — a grade-4 crack in a 12-inch residential collector has different consequences than the same defect in a 48-inch interceptor beneath a major arterial road. The iFactory engine combines Likelihood of Failure (LOF) from condition scores with Consequence of Failure (COF) from GIS attributes — pipe material, diameter, depth, soil type, proximity to critical infrastructure, environmental sensitivity, traffic load, and hydraulic criticality. Risk weights are configurable per utility, so the prioritisation reflects local priorities, not a generic model.
03
Rehabilitation Method Recommendation
For each prioritised asset, the engine recommends the appropriate rehabilitation method based on defect type, severity, pipe material, access conditions, and cost-effectiveness. CIPP lining for structural cracks and joint failures in gravity mains. Manhole grouting for infiltration at pipe penetrations and chimneys. Point repairs for isolated defects in otherwise sound segments. Full replacement for pipe segments with extensive deterioration. Each recommendation includes a cost estimate based on regional unit rates, pipe diameter, and length, enabling budget scenario modelling within the same session.
04
Live Plan Updates and Funding Readiness
The capital plan is not a static report — it updates automatically as new CCTV inspections are uploaded, as pipe conditions change, and as budget decisions are made. A utility that inspects 200 additional segments next quarter sees those assets scored, risk-weighted, and ranked within the existing plan without manual recompilation. The output is formatted for State Revolving Fund applications, city council presentations, and ratepayer communications — maps, ranked worklists with cost estimates, risk-scored asset inventories, and budget scenario comparisons. The plan is always current and always ready to present.
3-6 Months
Compressed to hours with AI condition-based prioritisation — inspection data upload to capital-ready plan in a single working session
70%+
Precision in identifying bad-condition pipes using ML-based prediction models — documented in peer-reviewed infrastructure studies
50%
Reduction in targeted maintenance costs when AI-driven risk prioritisation replaces age-based or reactive approaches
100M+
Feet of sewer pipe inspection footage processed by AI coding platforms — the technology is production-proven, not theoretical
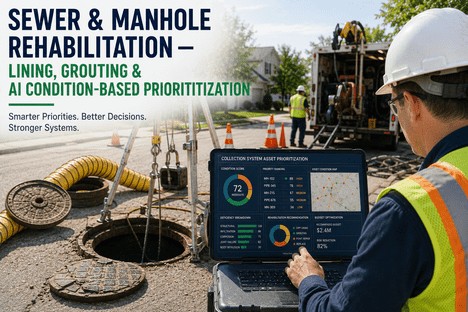
What the AI Prioritisation Dashboard Shows the Maintenance Manager
The maintenance manager view is not an engineering analysis interface — it is a decision support system designed around the question every utility leader faces: which assets do I rehabilitate first with the budget I have, and how do I defend that decision to the people who approve the funding?
View 01
System-Wide Risk Map with Colour-Coded Condition Tiers
The entire collection system displayed on a GIS-powered map with each pipe segment and manhole colour-coded by risk tier — critical, high, medium, low, and no defect. Zoom from the system-wide view to an individual pipe segment, and the risk score breaks down into its LOF and COF components with the specific defect codes driving the score. The map is the first thing budget authorities see, and it communicates the system condition narrative without requiring them to read a spreadsheet.
Decision: Which basins need funding this cycle? The map answers in one glance.
View 02
Priority-Ranked Rehab Worklist with Cost and Method
Every inspected asset appears in a ranked worklist ordered by composite risk score, with the recommended rehabilitation method, estimated cost, and ROI impact displayed alongside the ranking. The maintenance manager can apply budget filters — show me the highest-risk assets I can rehabilitate with this year's allocation — and the worklist re-ranks automatically. Scenario modelling allows comparison: what does the risk profile look like if I spend on the top 20 assets versus the top 50? The answer is calculated instantly.
Decision: Which assets go into this year's CIP? The worklist ranks them by defensible risk score.
View 03
Budget Scenario Comparison and Funding Gap Analysis
The budget scenario view compares funding levels side by side — what the risk profile looks like at current funding, at 50% above current, and at 50% below current. Each scenario shows the number of assets reaching rehabilitation priority status, the projected system-wide average condition score over the next five years, and the estimated emergency repair costs avoided. This is the evidence that city councils and state funding agencies require: not a request for more money, but a data-backed demonstration of what each funding level delivers in system reliability and avoided reactive costs.
Decision: How much funding do we need? The scenario model shows the consequence of each budget level.
View 04
Defect Pattern Analysis by Material, Age, and Zone
The AI aggregates defect patterns across the collection system and surfaces correlations that individual inspection reports never reveal. A utility may discover that 68% of structural grade-4 defects in its system occur in clay pipe installed between 1960 and 1975, concentrated in basins with high groundwater. Or that manhole chimney leaks account for 42% of total infiltration volume. These findings enable systematic rehabilitation strategies — replace an entire material class in a zone rather than treating defects one pipe at a time — which is the approach that stretches limited rehabilitation budgets furthest.
Decision: Do we have a systemic material failure or isolated defects? The pattern analysis answers with data.
How AI Prioritisation Transforms the Three Most Critical Rehabilitation Decisions
01
CIPP Lining Prioritisation — Lining the Pipes That Need It Most
Cured-in-place pipe lining is the most cost-effective trenchless rehabilitation method for structurally compromised gravity mains — but only when applied to the right pipes. Applying CIPP to pipes with minor cracking that will not reach grade-4 severity for another decade consumes budget that should be reserved for assets at immediate risk of failure. The iFactory engine ranks every pipe by structural condition severity, deterioration trajectory, and consequence of failure, so CIPP lining is deployed on the assets where it delivers the highest risk reduction per dollar. Pipes with isolated grade-4 defects in otherwise sound segments are routed to point repair. Pipes with extensive deterioration are flagged for replacement. The lining programme budget is spent where the structural risk is highest, not where the most recent CCTV inspection happened to occur.
02
Manhole Grouting and Structural Lining — Stopping Infiltration at the Source
Manhole rehabilitation is often deferred in sewer capital plans because individual manhole condition data is less structured than pipe PACP data. iFactory integrates MACP-coded manhole inspection data directly into the same risk-weighted prioritisation engine that ranks pipe assets, so manholes are scored alongside pipes in a single, unified priority list. A manhole with active infiltration at pipe penetrations, hydrogen sulfide corrosion above the waterline, and a grade-4 structural rating on the cone and chimney sections is prioritised for chemical grouting and structural lining at the same level as a pipe with equivalent risk. The result is a rehabilitation programme that treats the collection system as an integrated network rather than a set of disconnected pipe-and-structure workstreams. Utilities that have deployed integrated pipe-and-manhole prioritisation report infiltration reduction of 55% or more from the first programme cycle because the manhole rehabilitation is finally included in the risk-weighted ranking rather than deferred until a separate budget appears.
03
Point Repair vs. Full Segment Replacement — Matching the Intervention to the Extent of Damage
One of the most expensive decisions in sewer rehabilitation is the threshold at which a utility switches from point repair to full segment replacement. Replace too early, and the budget is consumed by excavated segments that had decades of remaining service life. Replace too late, and emergency repairs cost three to five times the planned intervention rate. The AI engine uses the defect density analysis built into the PACP Quick Rating system — which reports both the peak defect severity and the number of occurrences — to determine whether the damage is localised or distributed. A segment with one grade-4 crack is recommended for point repair. A segment with six grade-4 cracks across the full length is recommended for CIPP lining or replacement. The recommendation is automatically documented with the defect data that supports it, so the decision to repair rather than replace is defensible in audit.
"
Before AI prioritisation, our CIPP lining programme was essentially reactive — we lined the pipes that had the most recent inspection data or the ones that the field crews remembered as bad. We had no way to compare a grade-4 crack in a 15-inch residential collector against a grade-4 crack in a 36-inch interceptor beneath a state highway because the comparison required pulling data from three different systems and compiling it manually. The AI engine gave us a single ranked list with risk scores that accounted for both condition and consequence. Our first year of AI-guided CIPP lining treated 40% fewer linear feet but achieved a 60% higher risk reduction because every liner dollar was spent on the pipes that actually needed it most. The lining budget that used to disappear into marginal assets now goes where the structural risk is genuinely highest.
— Collection System Maintenance Manager, Mid-Sized Municipal Utility — 800 Miles of Gravity Sewer, 12,000 Manholes
Conclusion
The gap in sewer and manhole rehabilitation is not a data gap — it is a prioritisation gap. Utilities already possess the inspection data to make informed capital decisions. What they lack is the ability to convert that data into a risk-weighted, budget-optimised, presentation-ready rehabilitation plan within the timeframe that budget cycles require. AI condition-based prioritisation closes this gap by automating condition scoring, integrating consequence-of-failure analysis, recommending rehabilitation methods, and generating defensible capital plans that update continuously as new inspection data arrives.
The documented outcomes from utilities that have adopted AI-driven prioritisation are consistent: planning cycles compressed from months to hours, rehabilitation budgets allocated to the assets with the highest risk rather than the most recent inspection, manhole rehabilitation finally integrated into the capital plan alongside pipe lining, and budget requests supported by transparent, traceable risk scores that city councils and state funding agencies accept without additional justification. For maintenance managers who have spent years defending reactive emergency spending with incomplete data, the shift to AI condition-based prioritisation is not a technology upgrade — it is a professional relief. The data that was already in the system finally becomes the decision-support tool that it was always intended to be.
iFactory's AI prioritisation platform is purpose-built for wastewater maintenance managers who need to optimise every dollar of their collection system rehabilitation budget. Book a Demo to see the platform configured for your collection system data, or talk to an expert about a free risk assessment and prioritisation pilot for your highest-risk basin.
Frequently Asked Questions
The platform accepts all standard CCTV inspection data formats including PACP-compliant XML, proprietary vendor formats, and PDF inspection reports. If your inspection data is already NASSCO-coded, it is ingested directly with the existing defect codes preserved. If the data is uncoded or in a non-standard format, the AI applies automated defect recognition using vision-language models trained on sewer defect classification — the same technology that has processed over 100 million feet of pipe inspection footage in production deployments. You do not need to re-inspect any asset that already has CCTV data. The AI works with whatever inspection data you currently have and scores each asset based on the available condition information. For uninspected assets, the platform can apply ML-based condition prediction using pipe attributes — age, material, diameter, soil type, and surrounding asset condition — to estimate the likely condition grade and risk score until formal inspection data is available. Book a Demo to see the platform ingest your existing inspection data and generate the first prioritisation within the same session.
The risk engine uses a configurable Likelihood of Failure (LOF) and Consequence of Failure (COF) matrix. LOF is derived primarily from the NASSCO PACP structural condition score — a pipe with a grade-5 structural defect has a higher likelihood of failure than a pipe with grade-2 defects — but the platform also factors in pipe material deterioration curves (clay, concrete, PVC, HDPE, ductile iron each degrade differently), age relative to expected service life, and environmental factors such as soil corrosivity and groundwater level. COF factors include pipe diameter (larger diameter = higher consequence), depth of burial, proximity to critical infrastructure such as hospitals, schools, and major transport corridors, environmental sensitivity of the receiving water body, traffic load above the pipe, and the population served by the pipe. Every factor has a default weight based on industry-standard asset management practice, and every weight is adjustable by the utility. A system with heavy industrial discharges can weight chemical resistance more heavily. A coastal system can weight groundwater infiltration more heavily. The risk model reflects your system's specific failure modes, not a generic template. Talk to an expert about configuring the risk matrix for your collection system profile.
Yes. The platform is built with open API architecture designed for integration with existing utility systems. GIS integration imports pipe and manhole attribute data — material, diameter, installation date, depth, location, and criticality attributes — eliminating manual data entry. CMMS integration enables work order generation directly from the rehabilitation plan: when a pipe is prioritised for CIPP lining, the work order, asset history record, and inspection data package are created automatically in the utility's maintenance management system. Asset management system integration allows condition scores and risk ratings to flow back into the utility's asset register, maintaining a single source of truth for asset condition across all systems. The integration layer supports standard protocols including REST API, SQL database connections, and GIS web service integrations. Data synchronisation can be configured as real-time, daily, or on-demand depending on the utility's operational requirements. Talk to an expert about integration architecture for your existing technology stack.
Funding applications — whether for State Revolving Fund programmes, EPA grants, or state infrastructure bank financing — require evidence that the proposed rehabilitation projects are the highest-priority investments in the system. The platform generates funding application packages that include a system-wide risk map showing the current condition distribution across the collection network, a ranked project worklist with each asset's composite risk score broken down into LOF and COF components, the specific PACP defects driving the score for each asset, the recommended rehabilitation method with cost estimate and regional unit rate basis, a budget scenario analysis showing what each funding level achieves in terms of system condition improvement and emergency cost avoidance, and a comparison of the proposed project list against the full-system priority ranking — demonstrating that the funded projects are the highest-risk assets in the system. The output is formatted to meet the documentation requirements of Clean Water State Revolving Fund (CWSRF) applications and can be exported as a complete digital submittal package in PDF, GIS data layers, and spreadsheet formats. Book a Demo to see a sample funding application package generated from example collection system data.
The Inspection Data Is Already in Your System. The Risk Scores, Rehab Plan, and Funding Application Are Waiting. Get a Free AI Prioritisation Pilot for Your Highest-Risk Basin.
iFactory's AI condition-based prioritisation platform for wastewater maintenance managers — automated NASSCO condition scoring, configurable risk-weighted prioritisation, rehabilitation method recommendations with cost estimates, and funding-ready capital plans generated from the inspection data you already have.