When a float glass plant running three production lines faced rising energy costs that consumed 28% of total operating expenses and a shift supervisor team stretched across quality monitoring, process adjustments, and compliance documentation, the production leadership recognized that manual SPC supervision could not simultaneously optimize energy consumption and maintain quality performance. With each supervisor managing 40+ control charts across ribbon temperature, tin bath conditions, lehr zones, and pull rate variables, the energy efficiency opportunity hidden in process variation went undetected shift after shift. Autonomous SPC changed this entirely — deploying self-tuning control charts, predictive analytics, and machine vision integration that continuously monitors process capability, identifies energy optimization opportunities, and automatically alerts supervisors to deviations that affect both quality and energy performance. Float glass shift supervisors and production leaders evaluating next-generation quality systems regularly Book a Demo to see autonomous SPC operating on live float line data.
The Energy-Quality Challenge in Float Glass Supervision
Shift supervisors in float glass operations manage a complex tradeoff between energy consumption and product quality. Increasing furnace temperature improves glass quality metrics but raises energy costs by 2-3% for every 10°F of additional heating. Reducing pull rate lowers energy usage but risks schedule delays and customer fulfillment. Manual SPC supervision, with its static control limits and delayed reporting, cannot identify the process sweet spot where energy consumption is minimized without compromising quality. Supervisors instead operate with conservative margins, consuming 4-10% more energy than necessary to avoid quality excursions. Production leaders evaluating autonomous SPC for energy optimization regularly Book a Demo to see the energy-performance correlation dashboard in operation.
Energy-Quality Tradeoff Blindness
Static SPC charts show process deviation but provide no energy consumption context. Supervisors lack visibility into how control limit adjustments affect furnace gas usage, lehr power consumption, and overall specific energy per square meter of glass produced.
Manual SPC Chart Overload
Each supervisor monitors 40+ control charts across multiple production lines. The volume of alerts and the time required to interpret each chart against current process conditions leaves minimal bandwidth for proactive energy optimization analysis.
Delayed Optimization Response
When process conditions shift — batch composition change, furnace crown degradation, seasonal ambient temperature variation — the energy-optimal operating point shifts as well. Static SPC limits do not reflect these shifts, and supervisors detect the energy impact only during end-of-shift or end-of-day reporting cycles.
Compliance Documentation Overhead
Regulatory and customer audit requirements demand retained SPC records, capability reports, and process adjustment logs. Supervisors spend an estimated 90 minutes per shift compiling documentation — time that could otherwise be spent on process improvement and energy optimization.
How Autonomous SPC Works on the Float Line
Autonomous SPC replaces manual chart monitoring and static control limits with self-tuning control charts, predictive analytics engines, and machine vision integration that continuously analyze process data, identify optimization opportunities, and alert supervisors only when action is required. The platform operates 24/7 across all shifts, freeing supervisors to focus on strategic decisions rather than routine monitoring. Shift supervisors and line leaders evaluating autonomous SPC capabilities regularly Book a Demo to review the deployment methodology and shift-floor interface.
Automatic control limit adjustment and process centerline tracking — Self-tuning control charts automatically calculate appropriate UCL/LCL boundaries from rolling process data windows, adjusting limits as process conditions change due to batch composition shifts, furnace condition evolution, or seasonal ambient temperature variation. The supervisor sees only the alerts that represent genuine process deviations — not false alarms generated by static limits that no longer reflect current conditions. Cpk and Cp values are calculated continuously and displayed on the supervisor dashboard alongside the live control chart, providing immediate visibility into process capability without requiring manual calculations.
Real-time energy-performance correlation — The platform correlates process parameters with specific energy consumption in real time, identifying the energy impact of every process adjustment. When ribbon temperature drifts, the supervisor sees not just the statistical deviation but the estimated energy cost of that drift in dollars per hour. The predictive analytics engine identifies optimization opportunities — for example, suggesting a 5°F furnace temperature reduction when the control chart confirms the current quality margin can support it, with the estimated energy savings displayed alongside the recommendation.
Machine vision defect correlation with process variables — Inline machine vision inspection data feeds directly into the autonomous SPC model, creating a closed-loop quality verification system. When a process variable drifts toward its control limit, the vision system confirms whether actual defects are appearing on the ribbon. If no defects are detected, the model maintains the current operating point — preventing unnecessary process adjustments that would consume energy without improving quality. If vision detects developing defects, the model identifies the root cause variable and alerts the supervisor with the specific correction required.
Measurable Impact on Energy, Quality, and Supervisor Productivity
Within three months of deploying autonomous SPC across three float glass lines, the plant documented measurable improvements in energy consumption, quality yield, and supervisor effectiveness. The comparison below shows the difference between manual SPC supervision and autonomous SPC operation across the criteria most relevant to shift supervisors and production leadership. Float glass supervisory teams that Book a Demo during their evaluation consistently report that the documentation elimination alone justifies the platform investment.
| Criterion | Manual SPC Supervision | Autonomous SPC Operation |
|---|---|---|
| Control Limit Management | Static limits, manually recalculated quarterly | Self-tuning limits, adjusted continuously |
| Energy-Performance Visibility | Not available during shift | Real-time energy cost per process variable |
| Supervisor Chart Monitoring | 40+ charts, manual review | Automated monitoring, exception-based alerts |
| Documentation Time per Shift | 90 minutes manual compilation | Zero — generated automatically |
| Process Capability Tracking | Weekly manual Cpk calculation | Continuous Cpk/Cp monitoring on dashboard |
| Energy Optimization Response | End-of-shift or next-day analysis | Real-time opportunity identification |
| Audit Record Availability | 2-3 days to compile | Instant access, audit-ready format |
| Specific Energy Reduction | Baseline | 4-10% reduction achieved |
"Our shift supervisors were spending the first 90 minutes of every shift reviewing control charts and the last 30 minutes compiling documentation. That left maybe four hours for actual process management. The autonomous SPC platform eliminated the chart review burden entirely — the system surfaces only the alerts that need action, and it tells the supervisor what's happening and what adjustment to make. The energy optimization recommendations were a surprise benefit we did not expect. Within the first month, the system identified that we were running the furnace 8°F hotter than needed for the current product grade. Adjusting that single variable saved $28,000 in gas costs that month without any quality impact. Our supervisors now manage by exception rather than drowning in data." — Production Superintendent, Float Glass Manufacturing
Autonomous SPC Unlocks Energy Efficiency Without Sacrificing Quality
The transition from manual SPC supervision to autonomous SPC operation addresses a persistent challenge in float glass manufacturing: the energy-quality tradeoff that static control systems cannot optimize. By deploying self-tuning control charts that adjust to current process conditions, predictive analytics that correlate process variables with energy consumption, and machine vision integration that confirms quality outcomes in real time, autonomous SPC enables shift supervisors to reduce specific energy consumption by 4-10% while maintaining or improving quality performance. The platform eliminates 90 minutes of documentation per shift, provides continuous Cpk visibility, and delivers audit-ready records instantly.
iFactory's autonomous SPC platform integrates with existing float line process historians, machine vision inspection systems, and quality databases to deliver self-tuning control charts, predictive energy analytics, and automated compliance reporting. The platform investment is typically recovered within the first quarter from energy savings alone. Float glass production and quality leaders evaluating SPC modernization are encouraged to Book a Demo to see autonomous SPC operating on their float line data.
Frequently Asked Questions
Autonomous SPC identifies the minimum energy required to maintain quality specifications for each product grade by analyzing the correlation between process variables and energy consumption in real time. The platform continuously evaluates whether current energy input levels are necessary for the observed quality outcomes, using machine vision inspection data to confirm defect-free production at reduced energy levels. When quality margins allow, the system recommends specific energy reduction actions — furnace temperature reductions, pull rate adjustments, lehr profile modifications — with projected savings displayed alongside quality impact estimates.
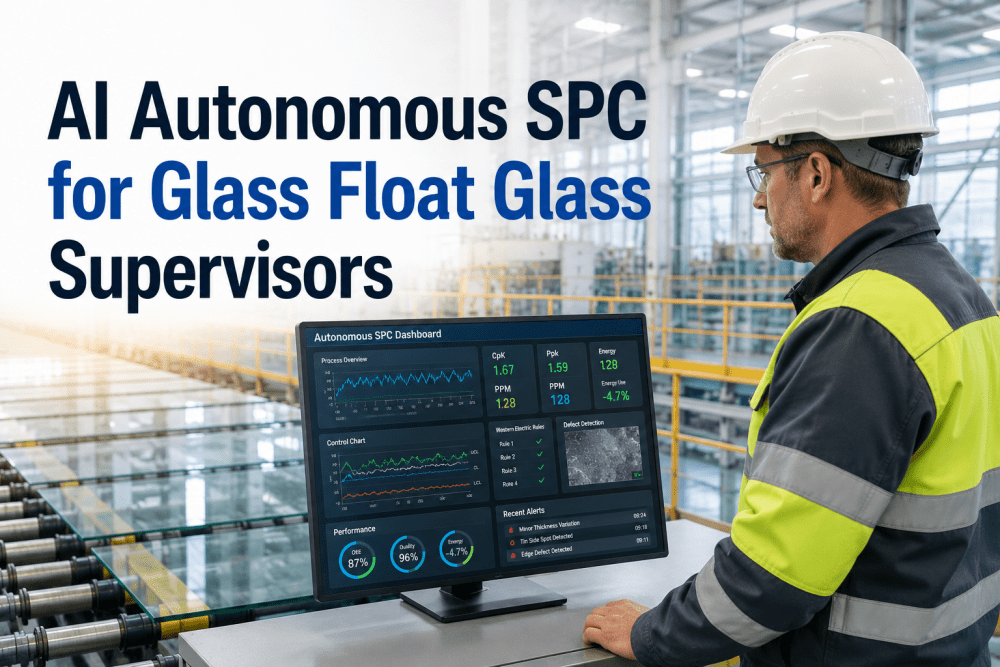
The supervisor dashboard presents a single-screen overview of all monitored process variables with exception-based alerting. Green indicators show variables operating within autonomous limits, yellow indicates a variable approaching a control boundary with a recommended action, and red signals a deviation requiring immediate attention. Each alert includes the root cause variable, the estimated energy impact, and a corrective action recommendation. Cpk and Cp values are displayed per variable and per product grade. Documentation is automatically compiled in the background with no supervisor action required.
Yes — autonomous SPC is designed for multi-grade float glass operations. Grade-specific control limit profiles and energy optimization targets switch automatically when the line transitions to a new product grade. During transition periods where the process has not yet stabilized, the platform temporarily widens alert thresholds and provides the supervisor with a transition dashboard showing the stabilization status of each process variable. Once stabilized, the system resumes autonomous operation with the new grade's performance targets.
iFactory connects to existing process historians (OSIsoft PI, Aspen InfoPlus.21), DCS and SCADA systems, and machine vision inspection platforms via standard APIs and OPC-UA. The autonomous SPC engine operates alongside existing control systems without requiring modifications to the DCS or PLC logic. The supervisor dashboard is web-based and accessible from any shift-floor terminal or mobile device. Typical integration timeline is 2-3 weeks per float line, with the first autonomous alerts typically available within the first week of data connection.
Customers typically achieve 2-4% specific energy reduction within the first month of autonomous SPC operation, with full 4-10% reduction realized within 3-4 months as the platform accumulates process data and refines optimization models. Early reductions come from correcting obvious energy inefficiencies that static charts could not reveal — excessive furnace temperatures for current grades, unnecessary lehr zone heating, and suboptimal pull rate settings. Deeper optimization requires the platform to learn seasonal patterns, batch composition effects, and furnace condition trends over multiple operating cycles.
.png)