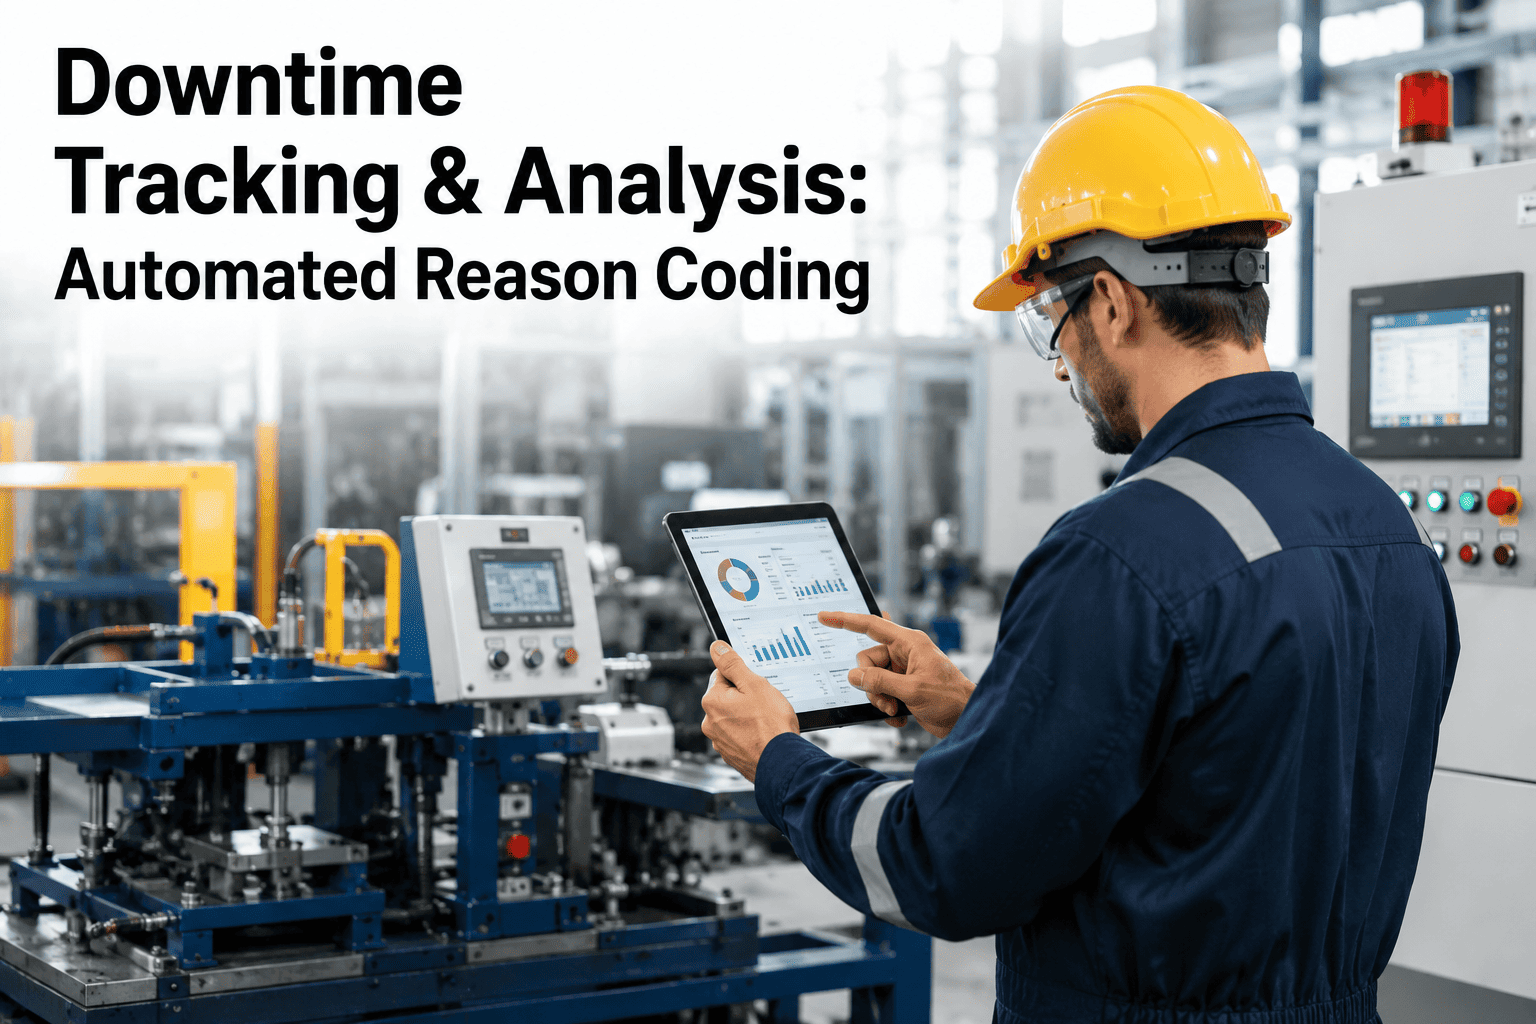
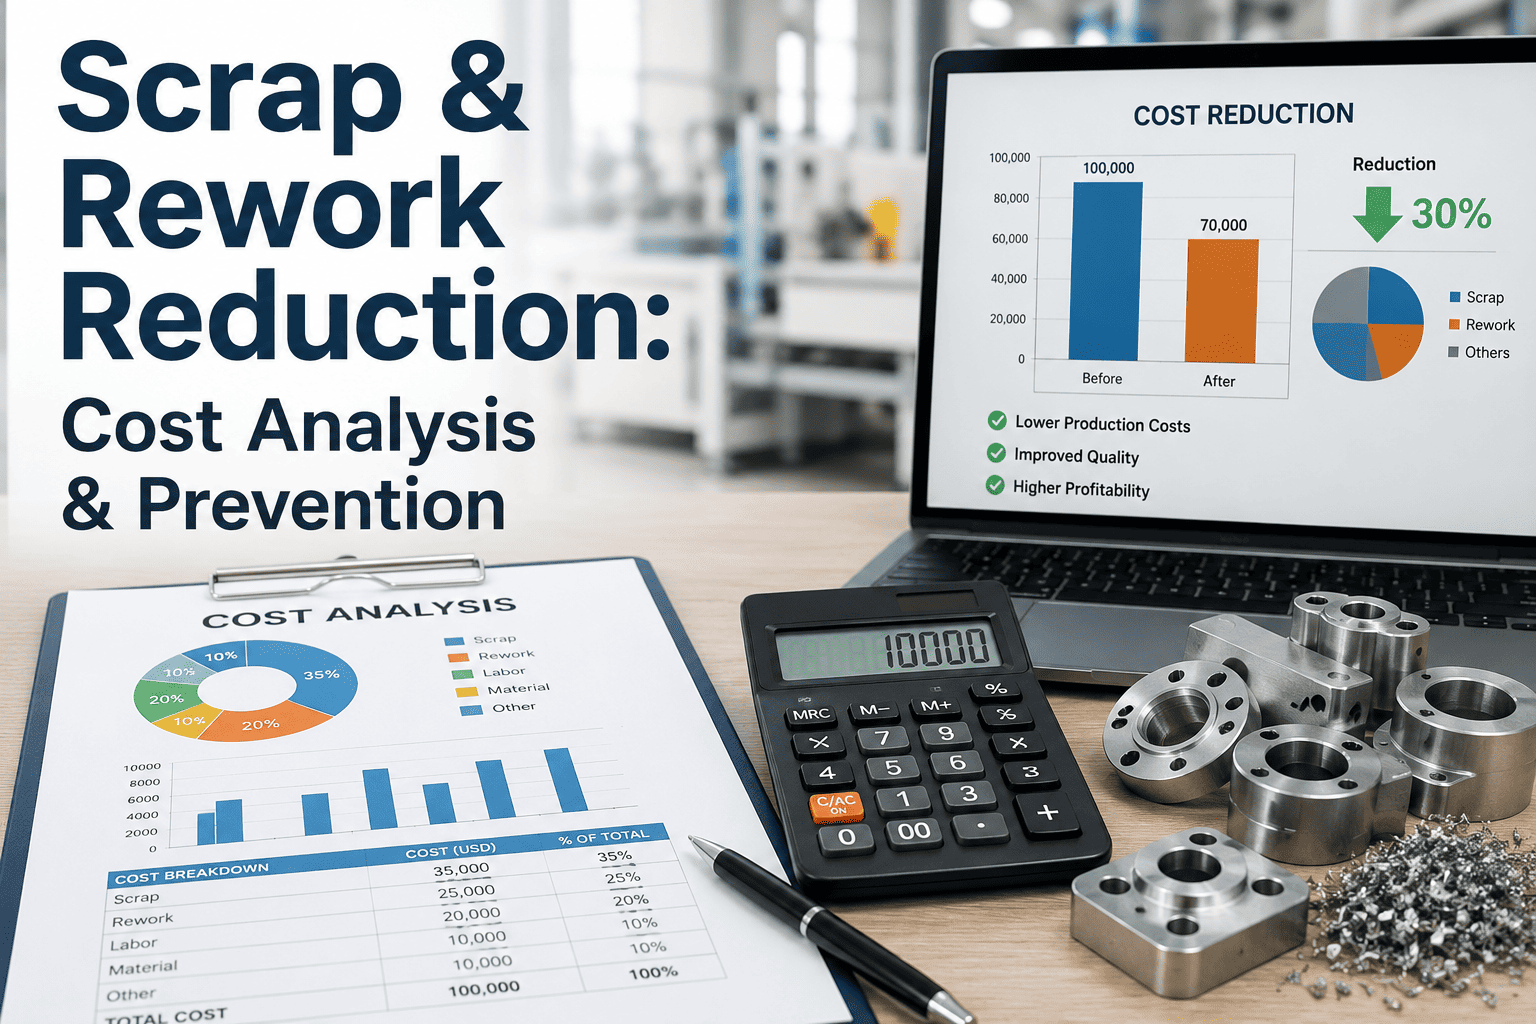
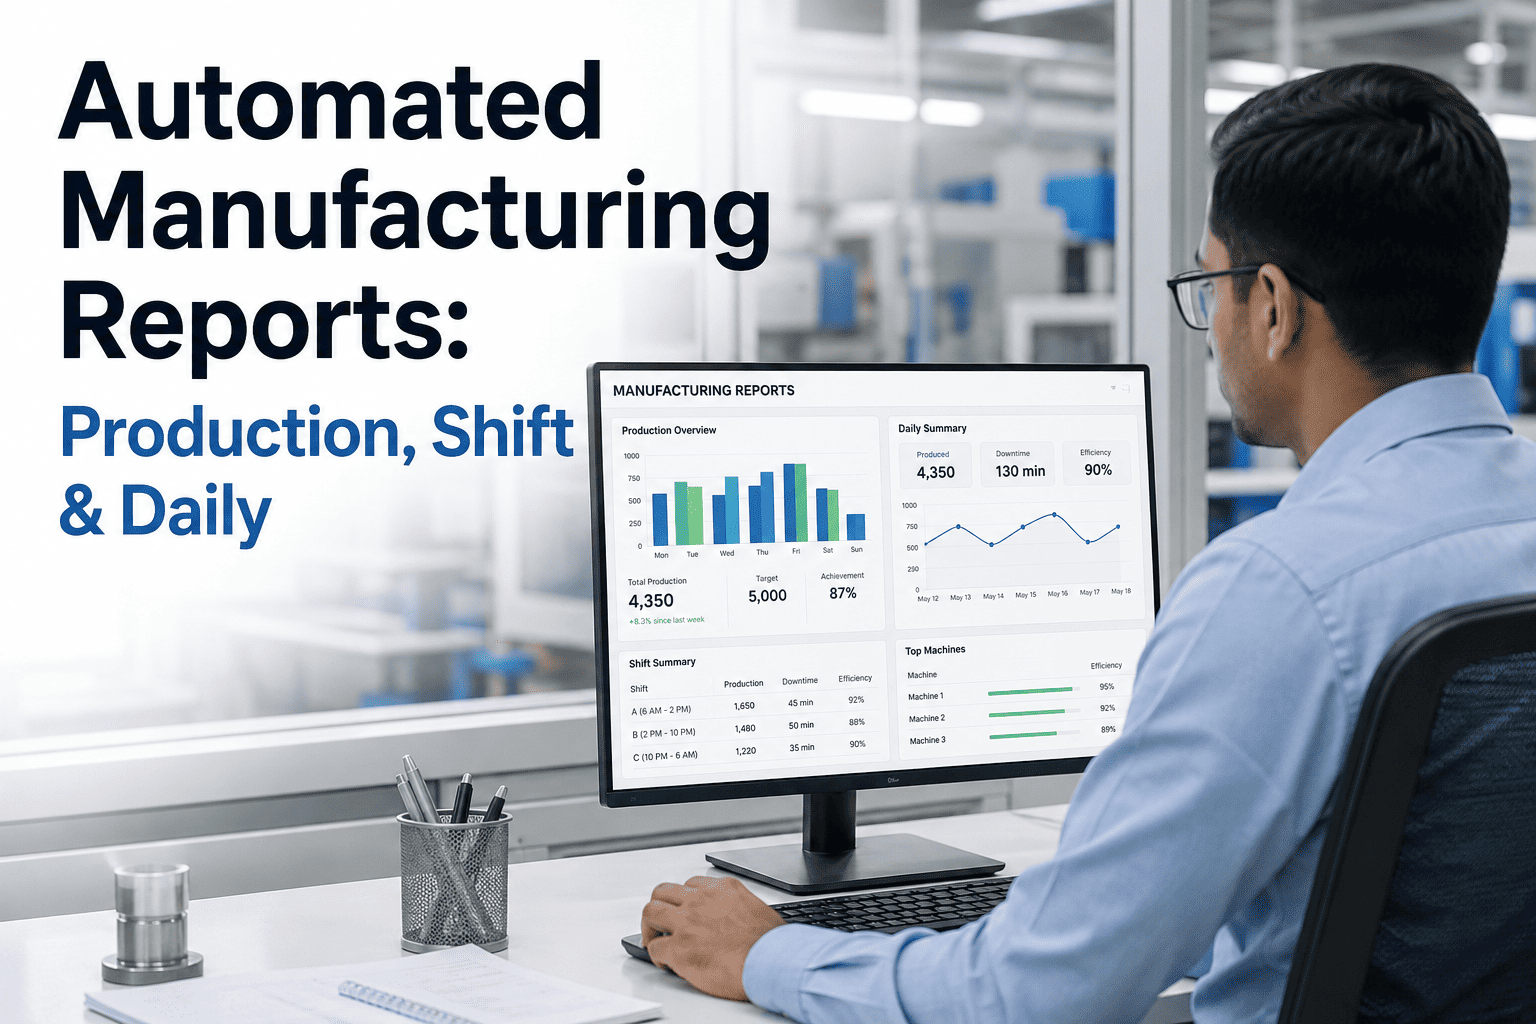
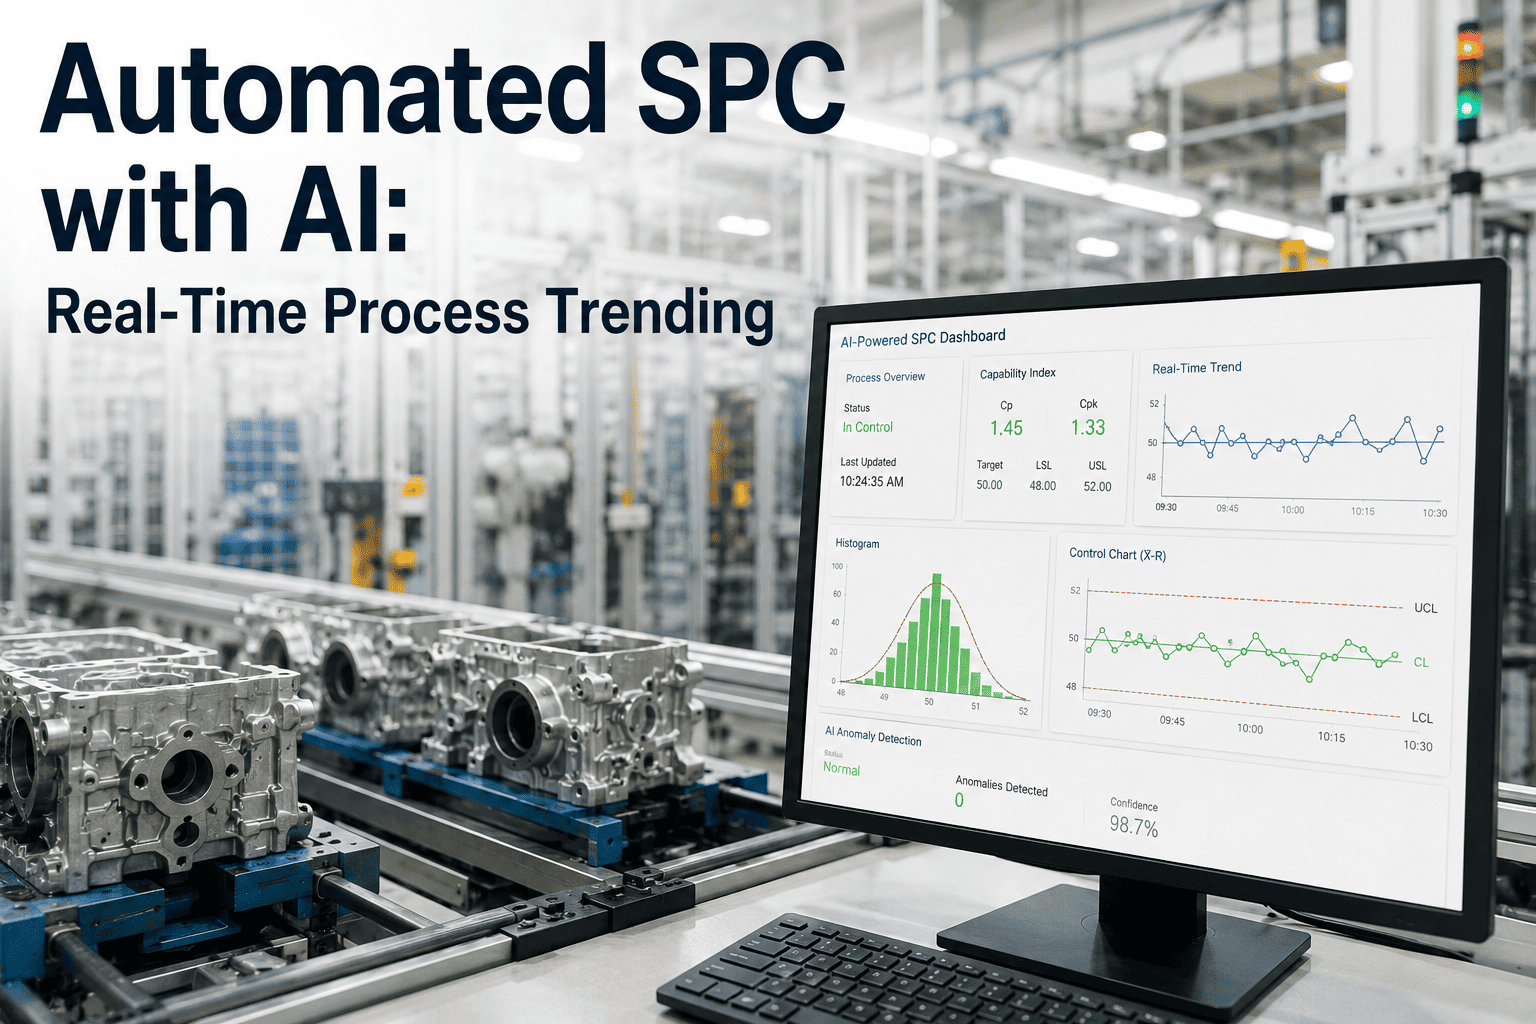
A line stops at 2:14 AM. By the time the operator logs it, the shift has moved on to three other problems, and the downtime reason gets typed in as "other" or "jam" because nobody has time to be precise at 2 AM. Multiply that by every micro-stop, every changeover overrun, every sensor fault across a month of production, and the Pareto chart your reliability team builds at month-end is not a picture of your real losses — it is a picture of what operators had time to type. Automated reason coding replaces that guesswork with PLC-level detection and AI-assisted classification, so every stop is captured, categorized, and ranked by actual cost the moment it happens. Book a downtime tracking demo with iFactory to see how automated detection turns scattered stop events into a prioritized improvement backlog.
Downtime Tracking & Reason Coding
Automated Downtime Tracking and Reason Coding: Stop Guessing Where Your Hours Go
PLC-based stop detection, AI-assisted reason classification, Pareto-ranked loss analysis, and a scored improvement backlog — built from what the equipment actually did, not what an operator remembered to type in.
Average cost per hour of unplanned downtime across manufacturing in 2026
800 hrs
Unplanned downtime the average mid-size plant absorbs every year
50-70%
How much manual downtime logs typically understate the real cost
Why Manual Downtime Logs Mislead You
The Pareto Chart Is Only As Good As the Data Feeding It
Most plants still capture downtime the same way they did twenty years ago: an operator notices a stop, opens a form or a whiteboard, and types or writes a reason from memory. This works fine for a single four-hour breakdown with an obvious cause. It fails completely for the dozens of two-minute and five-minute micro-stops that happen every shift, because nobody has the time or the incentive to precisely categorize a stop that resolves before the coffee gets cold.
The result is a reason-code distribution dominated by vague catch-all categories — "other," "adjustment," "unknown" — that between them can account for a third or more of total logged downtime. A Pareto chart built on that data doesn't point you toward your biggest opportunity. It points you toward whichever specific failure happened to be easy to describe, while the real recurring loss hides inside the "other" bucket, invisible to every improvement meeting held against that data.
Manual Logging
Captured only when operator has time
Reason chosen from memory, minutes later
Micro-stops routinely go unlogged entirely
"Other" often 25-35% of total logged time
Automated Detection
Captured at the PLC the instant it occurs
Reason assigned from fault codes and pattern match
Every stop above a defined threshold is recorded
Unclassified typically under 5% of total time
How Automated Detection Works
From PLC Signal to Classified Reason Code — The Detection Pipeline
Automated downtime tracking does not require ripping out your control system. It reads signals your PLC or SCADA layer is already generating, applies threshold logic to distinguish real stops from normal cycle variation, and routes the event through a classification layer that assigns a reason code without waiting on an operator to type anything.
1
Signal Capture
Cycle-complete, fault, and run/stop signals are read directly from the PLC via OPC-UA or a similar protocol, with no changes to existing ladder logic required.
2
Threshold Logic
A configurable minimum stop duration filters normal cycle-to-cycle variation from genuine stoppages, so short-cycle equipment doesn't generate false downtime events.
3
Fault Code Mapping
Where the PLC raises a specific fault code, it maps directly to a reason category. Ambiguous or generic faults are passed to the classification layer instead of defaulting to "other."
4
AI Pattern Classification
For stops without a clean fault code, the system compares stop duration, time of day, upstream/downstream state, and historical pattern against prior classified events to assign the most probable reason.
5
Operator Confirmation Queue
Low-confidence classifications are flagged in a short queue for operator confirmation rather than left uncoded, keeping the reason-code taxonomy clean without requiring real-time manual entry.
Reason Code Structure
Building a Reason Code Taxonomy That Actually Supports Analysis
A downtime reason code taxonomy that is too broad hides the real cause inside vague buckets. One that is too granular fragments a single recurring problem across a dozen near-duplicate codes, none of which shows up large enough on the Pareto chart to get attention. The structure below uses a three-tier hierarchy that keeps top-level reporting clean while preserving enough detail underneath for root cause work.
Rule of thumb: if a Tier 1 category is regularly exceeding 30% of total downtime with no clear Tier 2 driver, the taxonomy is too coarse. If a Tier 3 code appears fewer than five times a quarter, it is probably a duplicate of an existing code and should be merged.
See Automated Coding on Your Own Line Data
iFactory Maps Your Existing PLC Signals Into a Working Reason Code Taxonomy
No control system replacement, no new sensors in most cases. iFactory connects to the signals your equipment is already generating and builds a classified downtime feed within weeks, not quarters.
Ranking Losses By Cost, Not By How Often They Get Talked About
Once downtime is reliably classified, the Pareto step ranks reason codes by cumulative cost impact rather than raw frequency — because the loss category that happens fifty times a month for ninety seconds each can easily outweigh the breakdown that happens once and gets all the meeting attention.
Cumulative percentage line shows the top three reason codes typically account for 55-65% of total classified downtime hours — the correct place to start an improvement backlog.
Improvement Project Scoring
Turning the Ranked List Into a Scored Improvement Backlog
A Pareto ranking tells you what costs the most. It does not tell you what to fix first, because the highest-cost loss category is sometimes also the hardest and slowest to address. A simple scoring model — cost impact against implementation effort — turns the ranked list into an actual sequenced backlog.
Reason Code
Monthly Hours Lost
Est. Cost Impact
Fix Effort
Priority Score
Conveyor Jam (Infeed)
18.4
High
Low
92
Changeover Overrun
14.1
High
Medium
78
Vision Sensor Fault
9.7
Medium
Low
71
Material Supply Wait
7.2
Medium
High
48
Fixture Wear Reset
4.6
Low
Medium
35
Calibration Drift
3.1
Low
Low
40
Priority Score weights cost impact roughly two-to-one against fix effort, so a high-cost, low-effort problem like a recurring infeed jam consistently surfaces to the top of the backlog ahead of a high-cost but high-effort supply chain fix.
Rollout Path
Getting From Manual Logs to a Fully Automated Feed
Weeks 1-2
Signal Audit
Identify which run/stop and fault signals already exist on each line's PLC and where gaps require a low-cost sensor addition.
Weeks 3-5
Taxonomy Build
Design the three-tier reason code structure against your actual equipment and failure history, not a generic template.
Weeks 6-8
Classification Tuning
Run the AI classification layer in parallel with manual logs, comparing outputs and correcting misclassifications to raise confidence.
Week 9+
Live Pareto Reporting
Switch reporting to the automated feed, publish the scored backlog, and begin tracking hours recovered against each closed item.
The single biggest shift I've seen when a plant moves from manual to automated downtime coding isn't the accuracy of any one number — it's that the improvement team stops arguing about whether the data is real. When downtime logs come from an operator's memory, every review meeting starts with someone questioning whether the "other" category is hiding the real problem, and that argument alone can burn twenty minutes before any actual root cause work happens. Once the reason codes come from the PLC and a classification model instead of a form filled out under time pressure, the meeting moves straight to what to fix. That single change in trust is worth more than any dashboard.
Marcus Whitfield-Osei
Reliability Systems Consultant · 22 years in discrete and process manufacturing downtime analytics · Former plant reliability manager across automotive and packaging operations
Reliability Team Questions
Automated Downtime Tracking — Frequently Asked
Do we need to replace our PLCs or SCADA system to get automated downtime tracking?
In most cases, no replacement is required. Automated downtime tracking reads existing run/stop, fault, and cycle-complete signals from the PLC through a standard protocol such as OPC-UA, which nearly all modern control systems already support. Where a line has genuinely limited signal availability — often older equipment with minimal instrumentation — a small number of additional sensors, typically photo-eyes or current sensors on key motors, close the gap without a control system overhaul. The signal audit stage of implementation identifies exactly which lines fall into each category before any commitment is made. Contact our support team to scope a signal audit for your specific equipment mix.
How accurate is AI-based reason classification compared to a trained operator's judgment?
For stops with a clear PLC fault code, automated classification is generally more consistent than manual entry, since it applies the same mapping logic every time rather than depending on which operator is on shift. For ambiguous stops without a specific fault code, the AI classification layer typically reaches high-confidence accuracy after a tuning period of several weeks running in parallel with manual logs, during which misclassifications are corrected and fed back into the model. Low-confidence classifications are routed to a short operator confirmation queue rather than guessed at silently, which keeps accuracy high without requiring full manual re-entry of every event.
How many reason codes should our taxonomy actually have?
There is no universal number, but a useful guideline is six to ten Tier 1 loss categories, each with three to six Tier 2 equipment or system subcategories, and Tier 3 specific-cause codes added only where a distinct cause recurs often enough to warrant its own line — typically at least five occurrences per quarter. Taxonomies with dozens of Tier 1 categories fragment the Pareto analysis and hide true priorities; taxonomies with only two or three categories bury root causes inside broad buckets that don't point to an actionable fix. The taxonomy build stage should be based on your actual failure history, not a generic industry template.
Should short micro-stops under one minute really be tracked individually, or just summarized?
Individual tracking matters more for micro-stops than most plants assume, because a stop that resolves in forty seconds and repeats sixty times a shift can represent more lost hours over a month than a single four-hour breakdown, while remaining almost invisible in a summarized total. Automated detection makes tracking every micro-stop practical in a way manual logging never could, since it requires no operator time per event. The threshold logic step should be tuned per line to distinguish genuine micro-stops from normal cycle-time variation, rather than applying a single fixed threshold across dissimilar equipment.
How do we prioritize which downtime category to fix first once we have a ranked Pareto list?
Ranking by raw cost or hours lost alone can send a team toward a high-cost but high-effort fix that stalls for months, while a smaller but genuinely easy win sits untouched. A combined score weighting cost impact against implementation effort — as outlined in the priority scoring section above — surfaces the highest-leverage items first, typically recurring mechanical issues with a known, low-cost fix. Book a demo to see how iFactory generates this scored backlog automatically from your classified downtime feed.
Stop Reporting Guesses As Data
Get a Downtime Feed You Can Actually Trust in Every Review Meeting
iFactory connects to your existing PLC signals, builds a reason code taxonomy around your real failure history, and delivers a scored, Pareto-ranked improvement backlog — so the next review meeting starts with what to fix, not an argument about whether the data is real.