Most net-zero-by-2030 pledges were written by a communications team working from a target date, not by an engineering team working from an asset register, which is why so many of them stall the moment someone asks which specific boiler, compressor, or furnace gets replaced and in which year. The International Energy Agency estimates that more than 80 percent of the emissions reductions the world needs by 2030 can be delivered using technology that already exists today — the gap is not invention, it is sequencing, financing, and execution at the plant level. iFactory helps sustainability leaders turn a pledge into a costed, asset-level plan, and you can book a demo to see how AI-driven energy and emissions data anchors that plan in your own facilities.
Your Net-Zero Pledge Meets the Plant Floor Here — A Realistic, Costed Roadmap to 2030
A practical six-year sequence that blends AI-driven energy optimization, electrification of process heat, renewable procurement, and supply chain engagement into a plan your finance team can actually fund and your operations team can actually execute.
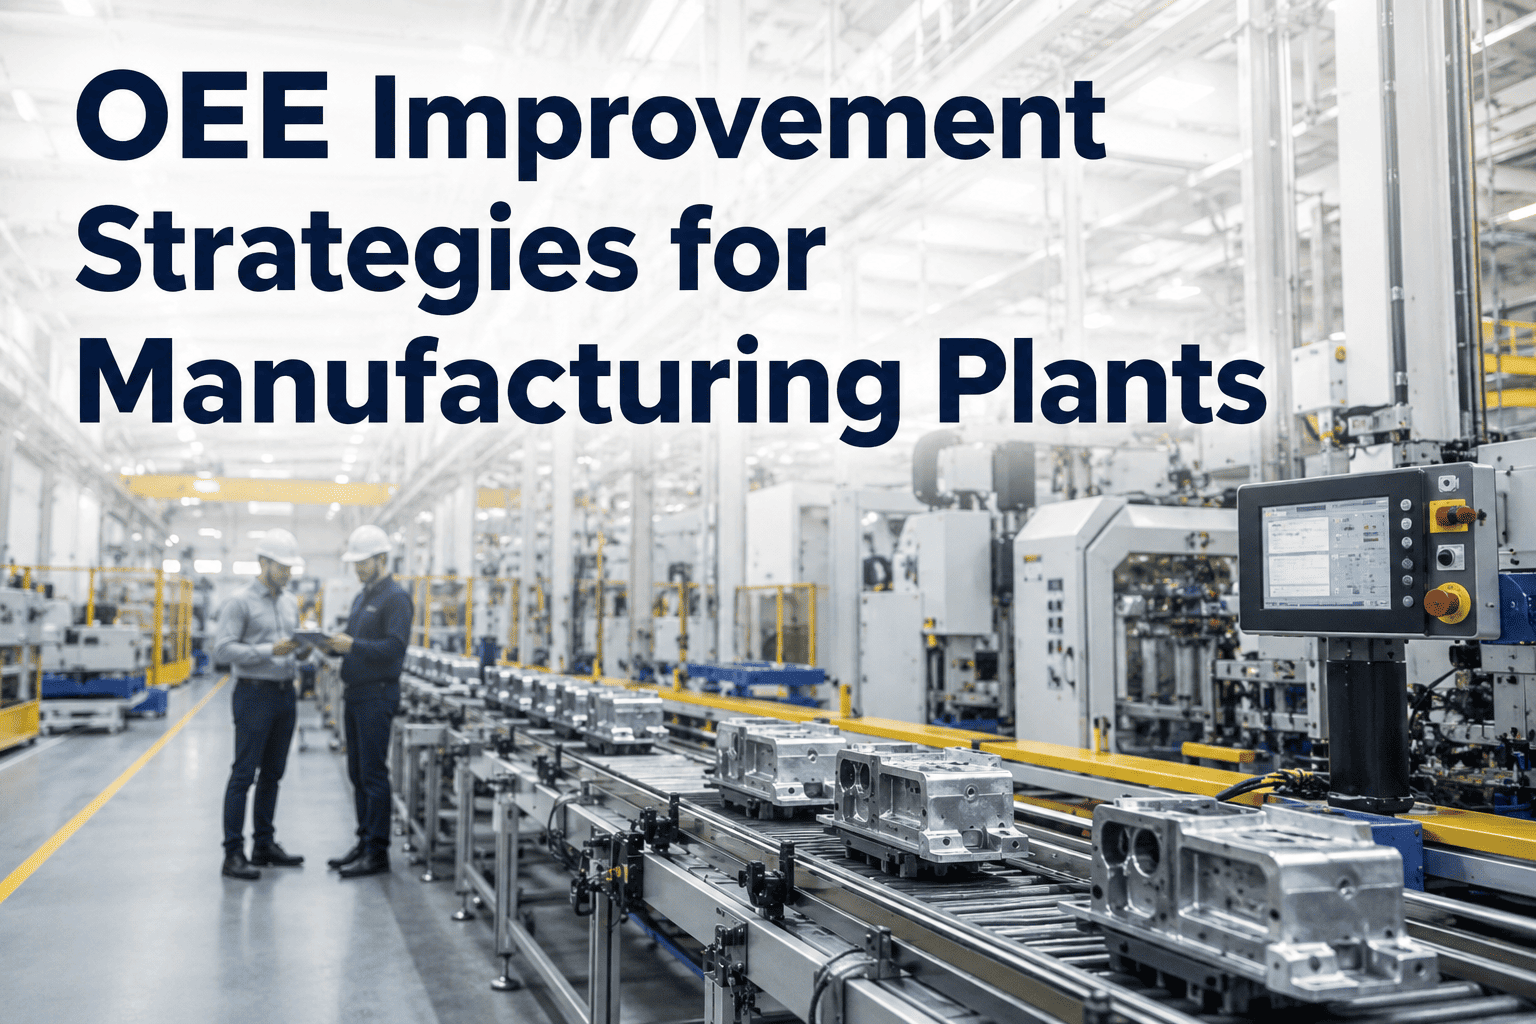
Why So Many Net-Zero Pledges Stall Before They Reach the Plant Floor
A public net-zero commitment is a statement of intent, but an asset-level roadmap is what actually reduces emissions, and the two are built by different teams working from different data. The figures below frame the scale of what is achievable today versus what most organizations have actually costed and scheduled.
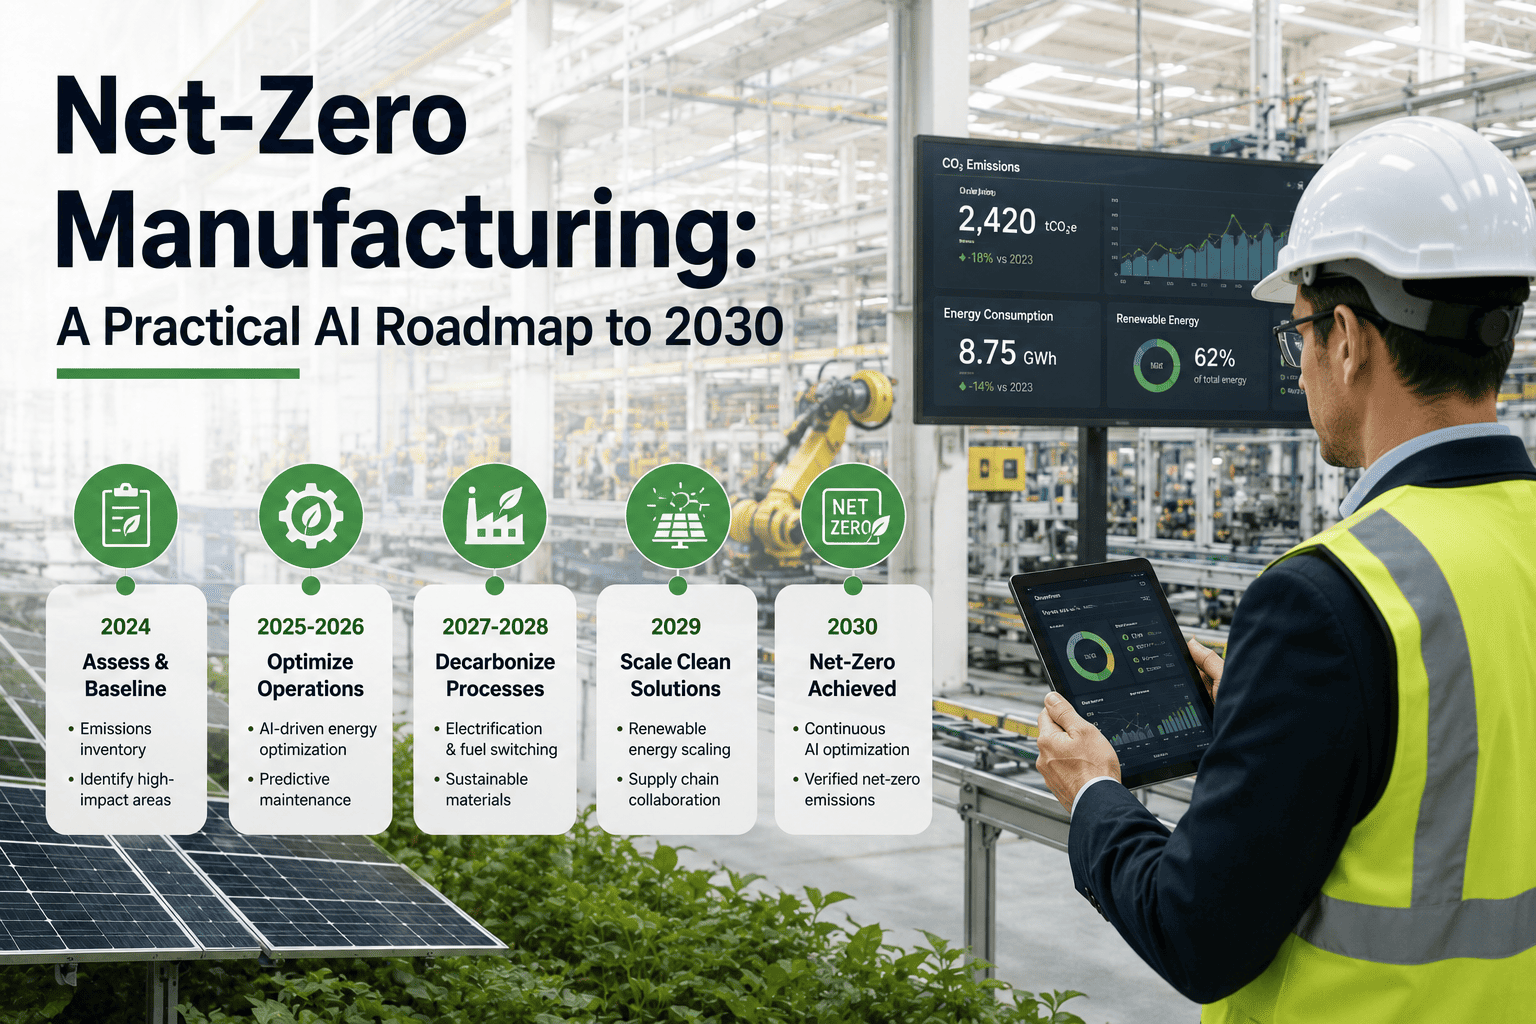
A Practical Six-Year Sequence From Baseline Data to Verified Net Zero
Decarbonization works best as a sequence rather than a single initiative, because each stage generates the data, cash savings, or infrastructure the next stage depends on. The roadmap below reflects the order most manufacturers find both technically sound and financially fundable.
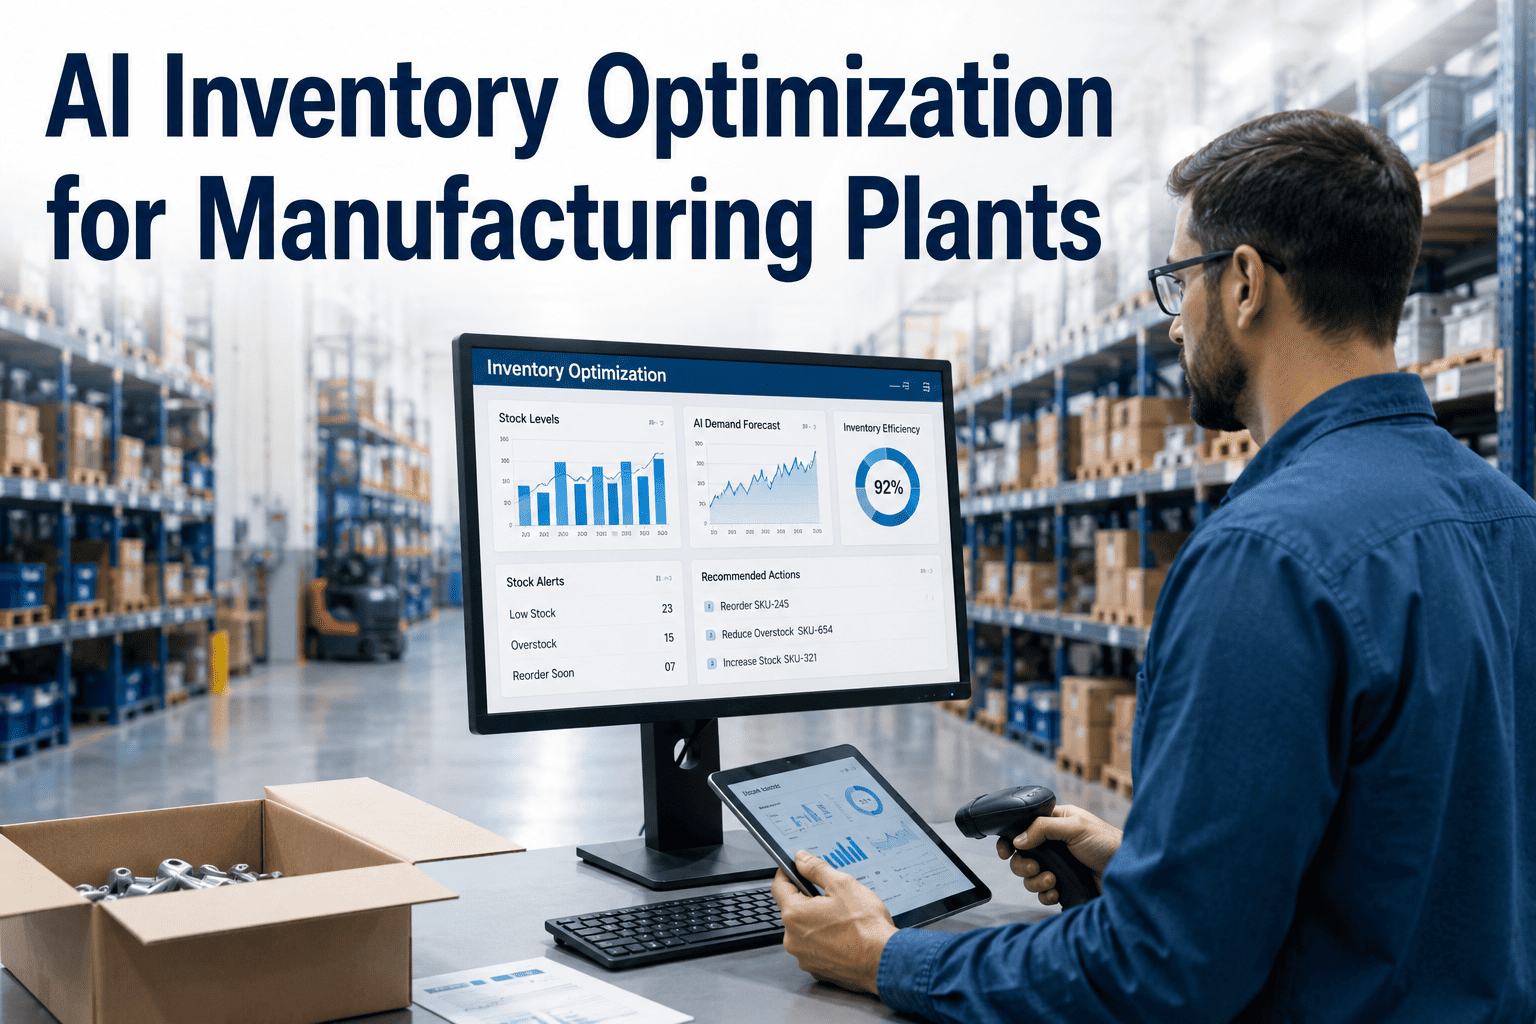
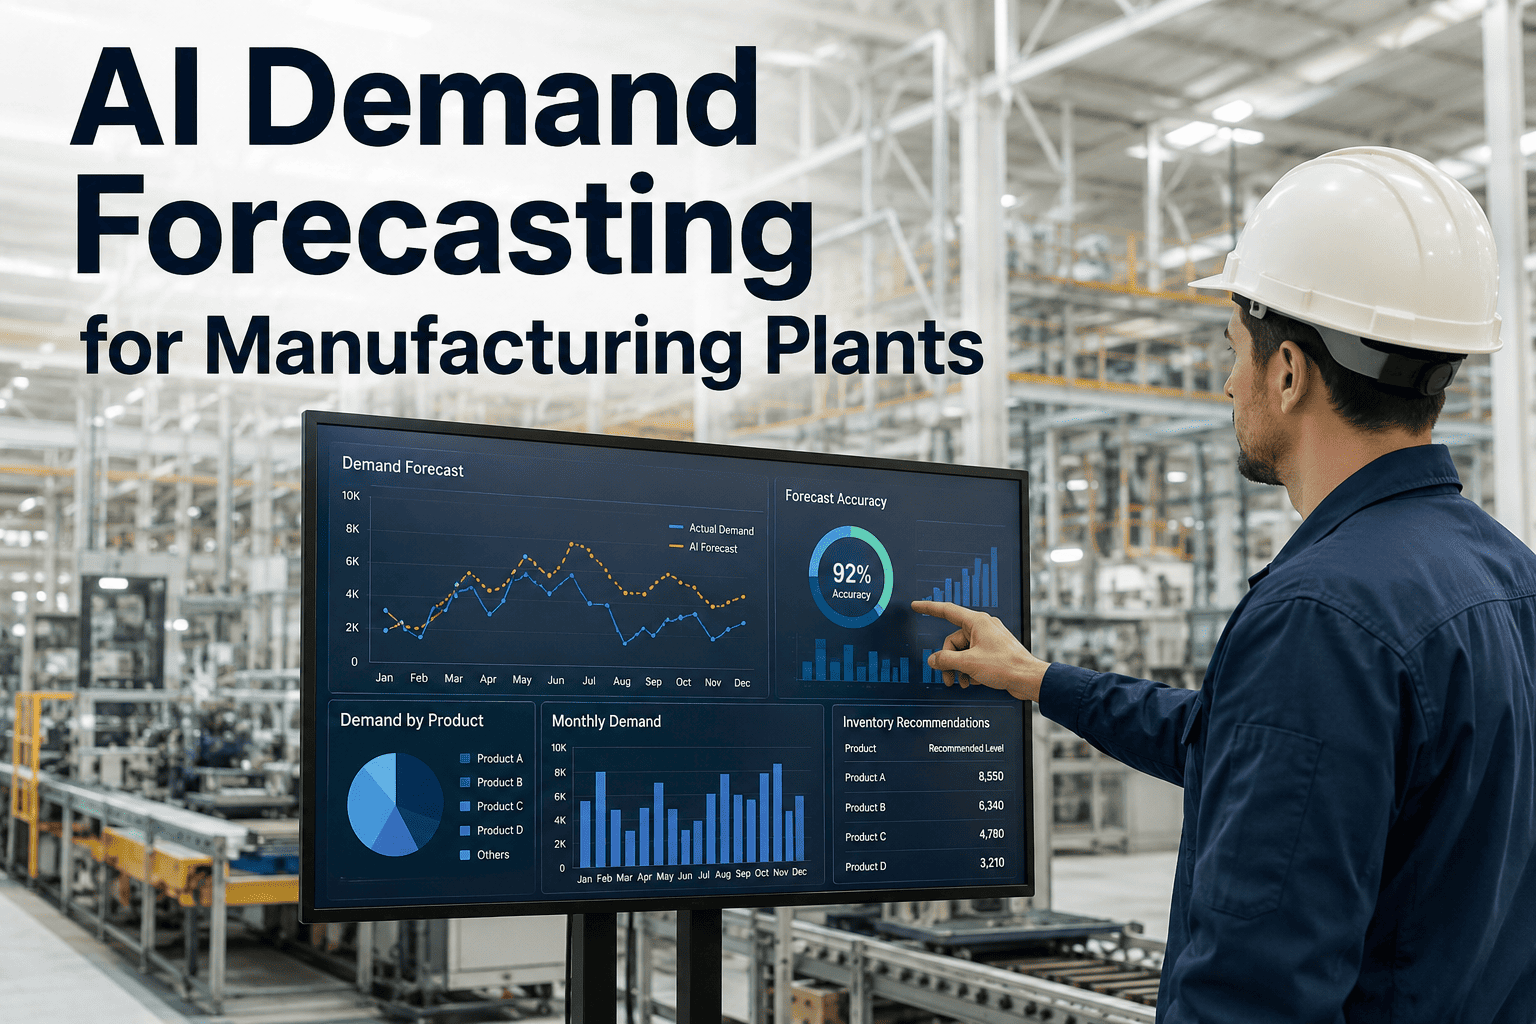
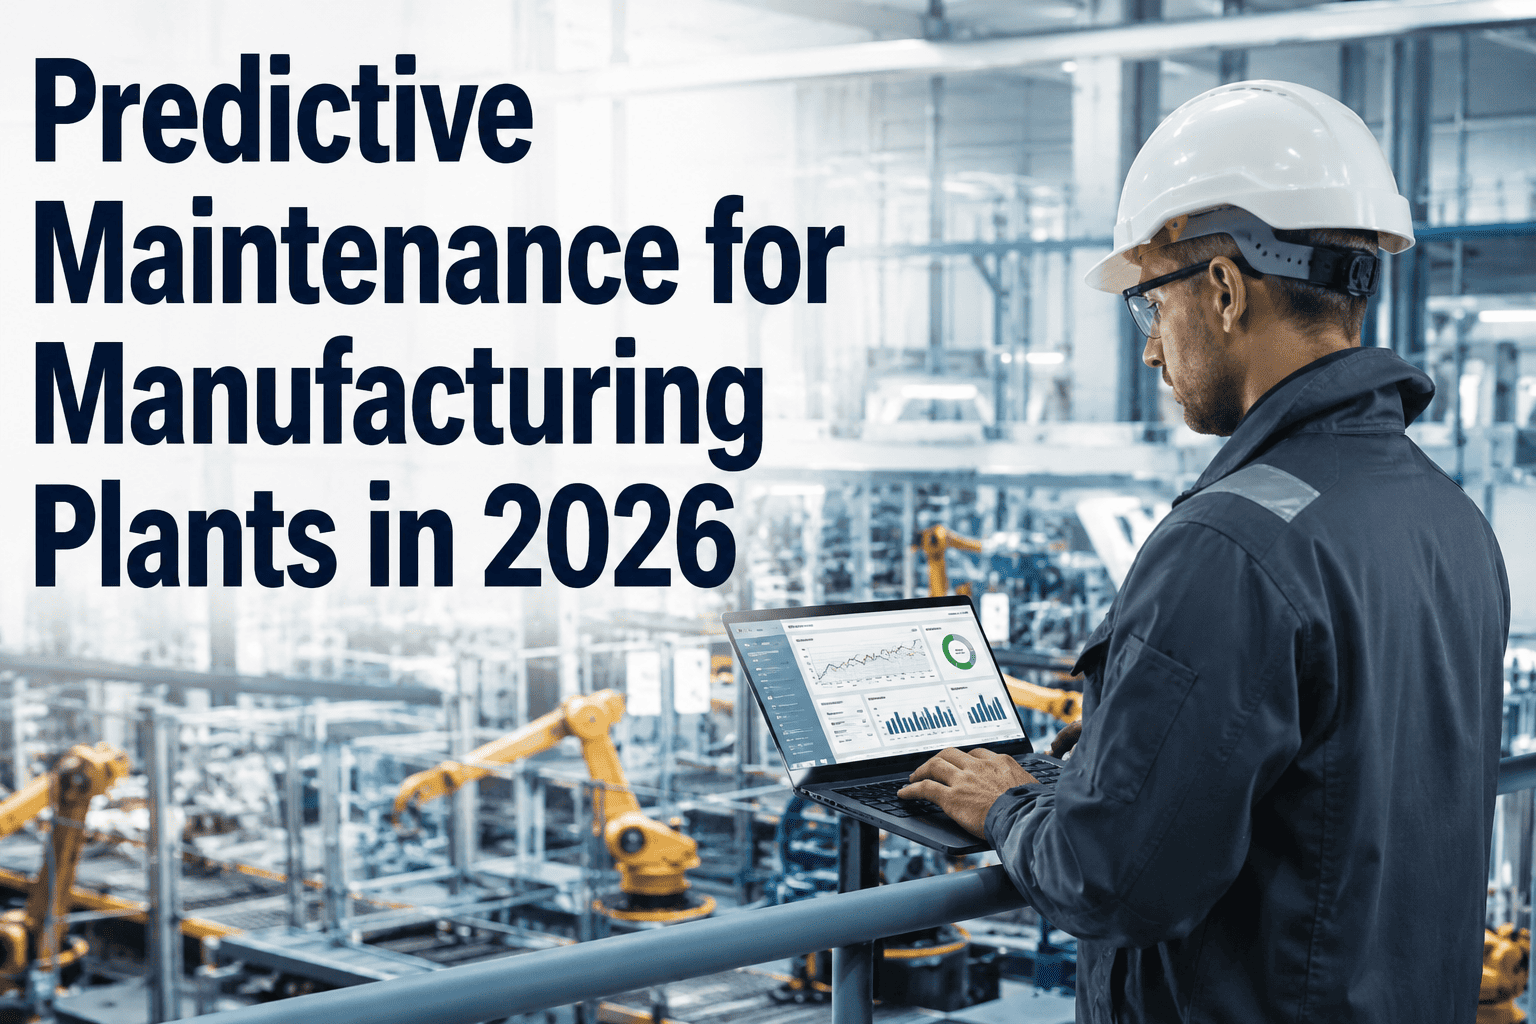
Baseline and Data Foundation
Deploy AI-driven energy and emissions monitoring across every facility to establish a validated, meter-based Scope 1 and 2 baseline — the foundation every later stage measures progress against.
Quick-Win Efficiency Gains
Capture the fastest-payback savings first — compressed air, HVAC, and motor optimization typically deliver 10 to 15 percent energy reduction within the first year using AI already available today.
Electrify Process Heat
Replace gas-fired boilers, ovens, and dryers with electric or heat-pump alternatives at facilities where the business case and grid capacity support it, prioritized by payback and emissions impact.
Renewable Power Procurement
Layer on-site solar, power purchase agreements, and green tariffs to reduce Scope 2 emissions from the electrified load created in the previous stage.
Engage the Supply Chain
Extend data collection and reduction targets to key suppliers, since Scope 3 typically represents the largest share of a manufacturer's total footprint and cannot be solved from inside the fence line alone.
Address Residual Emissions and Verify
Apply high-quality removals or offsets only to genuinely hard-to-abate residual emissions, and publish a third-party assured disclosure that reflects measured, not estimated, performance.
Three Levers That Actually Move a Manufacturing Footprint — In the Order They Pay For Themselves
Every credible manufacturing decarbonization plan draws on the same three levers, but the sequence matters because efficiency funds electrification, and electrification only pays off once the electricity behind it is clean.
AI-Driven Energy Efficiency
Continuous monitoring and optimization of compressed air, HVAC, motors, and process heat typically delivers the fastest, self-funding reductions and generates the cash flow that finances later-stage capital projects.
Electrification of Process Heat
Shifting combustion-based heating to electric and heat-pump technology removes Scope 1 emissions at the source, but only reduces net emissions meaningfully once paired with cleaner grid power.
Renewable Procurement and Fuel Switching
On-site generation, power purchase agreements, and lower-carbon fuel switching reduce the emissions intensity of the energy supplying the first two levers, compounding their impact over time.
A Roadmap Without a Meter Behind It Is Just a Press Release
iFactory's AI platform gives your net-zero plan the plant-level data foundation it needs — validated energy baselines, automated emissions tracking, and continuous optimization. Book a demo and see how the roadmap connects to your own facilities.
Pledge-Only vs Asset-Level Roadmap — A Net-Zero Readiness Scorecard
Sustainability directors can gauge how far a net-zero commitment actually is from execution by checking whether each of the following building blocks exists at the individual facility level, not just in a corporate sustainability report.
| Building Block | Pledge-Only Commitment | Asset-Level Roadmap |
|---|---|---|
| Emissions Baseline | Estimated from utility bills and averages | Metered, facility-by-facility, continuously updated |
| Efficiency Program | General target with no owner | AI-monitored, ranked by dollar and emissions impact |
| Electrification Plan | Aspirational, no capital schedule | Site-prioritized with payback and grid capacity checks |
| Renewable Procurement | Referenced generally | Contracted PPAs or on-site generation with delivery dates |
| Supply Chain Engagement | Not addressed or spend-based estimate only | Supplier data collection tied to procurement decisions |
| Residual Emissions Plan | Generic offset purchase | Verified removals limited to genuinely residual emissions |
What Manufacturers Following This Sequence Have Achieved by Stage
The figures below reflect outcomes reported by manufacturers that have progressed through the early stages of an asset-level decarbonization roadmap similar to the sequence outlined above.
Common Questions From Sustainability Directors About Net-Zero Manufacturing Roadmaps
Net Zero by 2030 Is Achievable — But Only as a Sequence, Not a Slogan
The technology needed to deliver the large majority of the emissions reductions required by 2030 already exists and is already deployed somewhere in your industry. What separates the manufacturers making real progress from those still writing pledges is not access to better technology; it is a costed, sequenced, asset-level plan that ties efficiency, electrification, renewable procurement, and supply chain engagement together against a real data baseline.
iFactory gives sustainability directors that data foundation, turning scattered plant data into the validated baseline, ranked efficiency opportunities, and continuous verification that every later stage of a net-zero roadmap depends on. Book a demo to see how iFactory's AI can anchor your own 2030 roadmap in real, measured performance.
Turn Your Net-Zero Pledge Into a Plan Your Board Can Actually Track
iFactory's AI platform gives sustainability directors the plant-level baseline, efficiency roadmap, and continuous emissions verification a real 2030 plan requires. Book a demo and see it built around your own facilities.