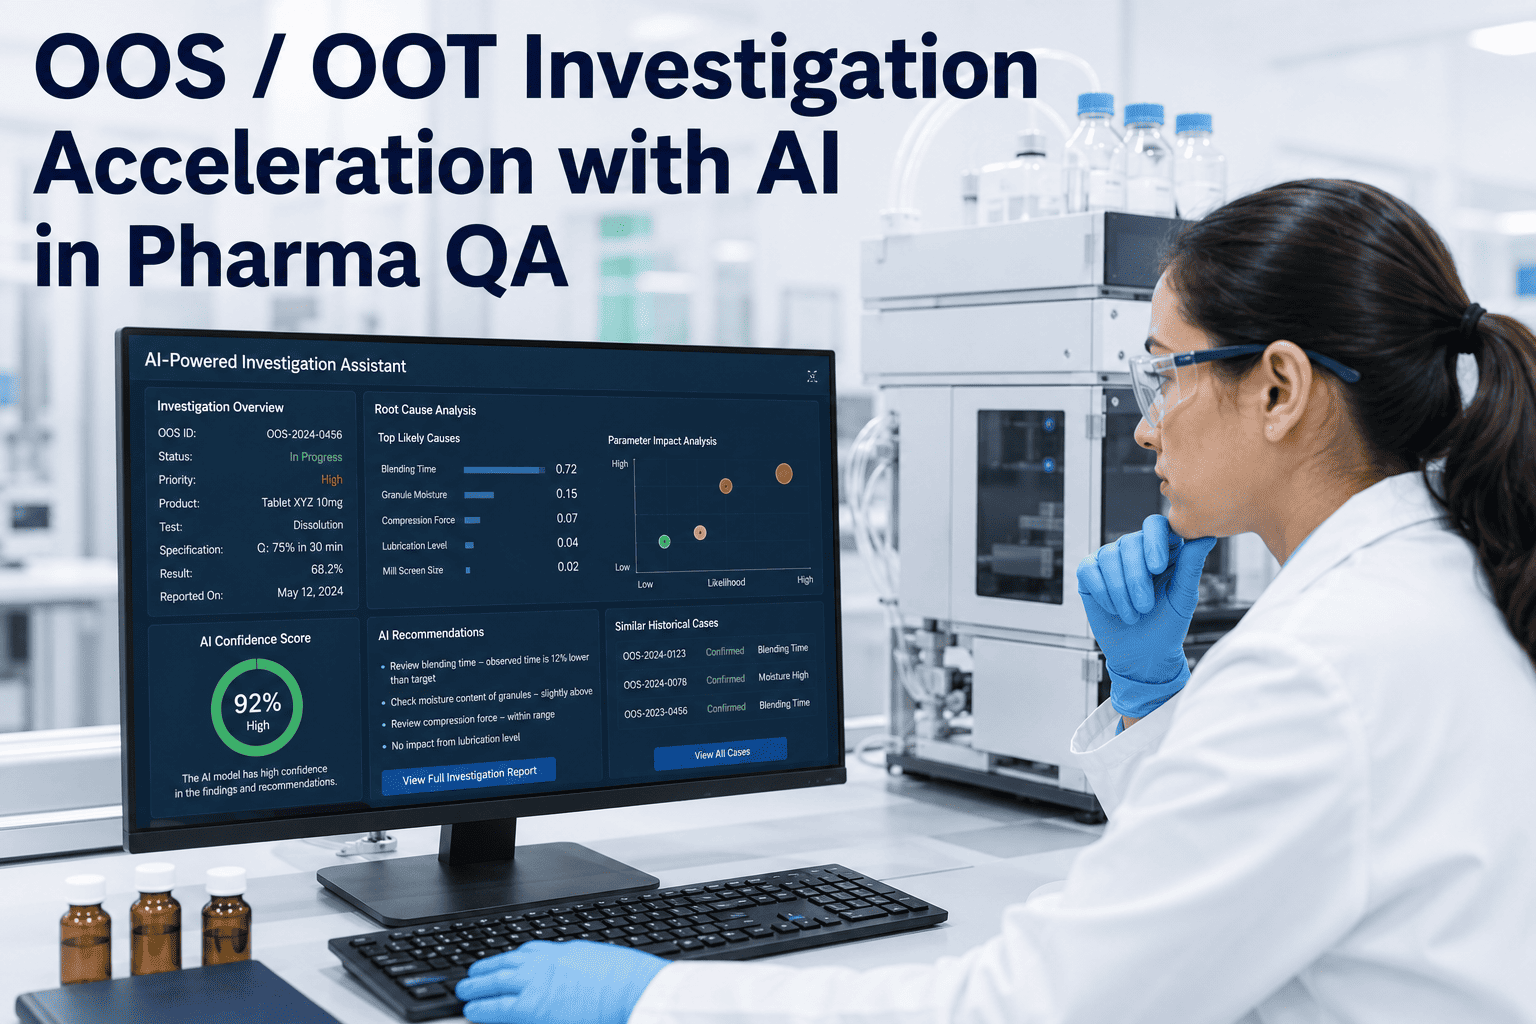
An out-of-specification result does not just fail a single test, it stops a batch in its tracks. The moment a lab result falls outside its acceptance criteria, that batch sits in quarantine while a formal investigation runs its course, and under the FDA's 2006 guidance and the regulations behind 21 CFR 211.192, that investigation has to be thorough, documented, and scientifically sound before anyone can decide whether the product ships, gets reworked, or gets rejected. Most facilities still complete that process manually, and it commonly takes thirty to forty-five days from the initial flag to a final, quality-unit-approved conclusion. Every one of those days is a day of tied-up inventory, quarantine cost, and schedule risk, which is why quality leaders are increasingly looking at how AI can compress that timeline without cutting a single corner on rigor, and teams ready to explore that path can Book a Demo to see it applied to their own investigation backlog.
Your Investigation Backlog Is Not a Staffing Problem. It's a Data-Retrieval Problem.
iFactory connects your LIMS, MES, and QMS so AI can surface the root cause pattern behind an OOS or OOT result in hours instead of weeks, while keeping every conclusion fully auditable.
Why OOS and OOT Results Trigger the Most Scrutinized Process in Pharma QA
The modern OOS investigation framework traces back to a 1993 federal court decision that first established the legal expectation that manufacturers investigate unexplained laboratory results rather than simply retesting until a passing number appears. That expectation was formalized when the FDA issued its guidance titled Investigating Out-of-Specification Test Results for Pharmaceutical Production in October 2006, thirteen years and a lengthy draft-guidance period after the original court decision. The guidance, read alongside 21 CFR 211.192 and 211.160, requires manufacturers to investigate every unexplained discrepancy or failure, whether or not the batch has already been distributed, and to extend that investigation to any other batch that may share the same root cause.
The investigation is structured in two phases. Phase I is a laboratory-level review, typically completed within three to ten business days, that looks for an assignable laboratory error such as a calibration issue, a sample preparation mistake, or a documented instrument malfunction. If no clear laboratory error is found, the investigation escalates to a Phase II full-scale investigation involving manufacturing, process, and materials review, and the combined total is expected to close within roughly thirty to forty-five days. The quality unit, per 211.22, must review and formally approve the conclusion before the batch can be dispositioned, and FDA's own inspection history shows this exact process is one of the most frequently cited weak points during a facility audit.
What makes this process so demanding in practice is that the burden of proof runs in only one direction. A manufacturer cannot simply retest a failing sample until a passing result appears and call that resolution, the guidance is explicit that averaging, retesting, or outlier statistics cannot be used to explain away a result without a documented, scientifically justified reason. That means every OOS or OOT event has to be treated as a real signal until an investigator proves otherwise, which is exactly why the process takes as long as it does when it is done manually: proving a negative, that the manufacturing process itself was not at fault, requires pulling together far more supporting evidence than confirming a positive would.
Manual Investigation Timeline vs AI-Accelerated Investigation Timeline
The regulatory expectation for rigor does not change with AI in the loop, what changes is how quickly the evidence needed to satisfy that rigor gets assembled. The two timelines below compare a typical manual investigation against one supported by AI-driven data retrieval and pattern analysis, covering the same investigation depth in a fraction of the elapsed time. It is worth being precise about what is and is not being compressed here: the analytical thinking an experienced quality investigator brings to a hypothesis is not something AI replaces, what AI removes is the hours or days spent physically locating the records that thinking depends on.
The compression happens almost entirely in Phase II, the stage where an investigator historically has to manually pull batch records, environmental monitoring logs, equipment maintenance history, and prior deviation reports from four or five disconnected systems just to test a single hypothesis. AI-assisted investigation tools search all of that history in parallel and surface the correlations an experienced investigator would eventually find manually, just far faster and without the risk of an overlooked data source.
The Investigation Decision Path: Laboratory Error or Manufacturing Root Cause
Every OOS investigation follows the same branching logic regardless of how fast it moves. The diagram below shows the decision path from an initial flagged result through to final disposition, and where AI tools typically plug into each decision point.
What a Slow Investigation Actually Costs Beyond the Calendar
A batch sitting in quarantine for thirty to forty-five days is not a neutral holding pattern, it is tied-up working capital, warehouse space, and in many cases an approaching expiration clock for temperature-sensitive or short-shelf-life products. For a facility running near capacity, an extended quarantine on one batch can also delay the next campaign scheduled to use the same equipment, since the line often cannot be requalified for a new product until the investigation on the prior batch has closed and a disposition decision has been recorded.
There is a second, quieter cost that rarely shows up on a spreadsheet: investigator fatigue. Quality teams juggling a backlog of fifty, one hundred, or more open investigations at any given time are under constant pressure to close cases quickly, and that pressure is precisely what pushes some investigations toward a shallow, deadline-driven conclusion rather than a fully substantiated one. A faster path to the same evidence base relieves that pressure without asking anyone to cut a corner, which is a meaningfully different proposition than simply asking the team to work faster with the tools they already have.
Where Investigations Stall Without AI
Regulatory guidance does not slow investigations down, the manual work required to satisfy that guidance does. Most of the elapsed time in a Phase II investigation is spent locating and cross-referencing evidence that already exists somewhere in the facility's systems, not in the scientific reasoning applied to that evidence once it is in hand. The bottlenecks below appear in nearly every investigation backlog, regardless of facility size or product type, and they compound with each other: a siloed data environment makes inconsistent categorization more likely, and inconsistent categorization makes it harder to ever notice a recurring systemic pattern in the first place.
Manual Historical Record Search
Investigators manually pull batch records, environmental data, and maintenance logs from separate systems, often re-keying data by hand between platforms that were never designed to share information.
Inconsistent Root Cause Categorization
Different investigators label similar failures differently, which makes it nearly impossible to spot a recurring systemic issue across sites, shifts, or product lines using historical reports alone.
The "Human Error" Catch-All
Under time pressure, ambiguous findings sometimes get logged as operator error even when a deeper equipment or process factor is the more likely true cause, weakening the resulting CAPA.
Siloed LIMS, MES, and QMS Data
Lab results, manufacturing execution data, and the quality management system rarely share a common timeline, so correlating a lab failure with an upstream process event takes manual detective work.
Delayed Trend Analysis
Recurring OOT patterns across batches often go unnoticed until a periodic quality review, well after several batches have already been affected by the same underlying drift.
Inconsistent Investigation Depth
Investigators under deadline pressure sometimes close an investigation at the first plausible explanation rather than fully ruling out competing hypotheses, creating audit risk down the line.
Every Deviation Deserves a Real Root Cause, Not a Deadline-Driven Guess.
See how iFactory pulls your LIMS, MES, and QMS data together into one investigation workspace.
How AI Turns Every Deviation Into a Structured Learning Opportunity
Rather than replacing the investigator, AI functions as a force multiplier across four complementary pathways that together speed up the investigation while making the underlying analysis more consistent than a purely manual process typically achieves.
Report Quality Scoring
Every investigation narrative is automatically checked for completeness and internal consistency before it moves forward, catching gaps that would otherwise surface during a regulatory audit.
Statistical Root Cause Analysis
Historical batch, process, and lab data is mined for statistical correlations, guiding the investigator toward the most probable explanation rather than starting from a blank hypothesis list.
Precedent-Based CAPA Retrieval
Past deviations and their corrective actions are retrieved and synthesized as reference material, so a new investigation benefits from the facility's own institutional memory instead of starting cold.
Anomaly Detection and Categorization
Deviations are classified consistently across investigators and sites, while unusual or exceptional cases are automatically surfaced for closer senior review rather than routine sign-off.
Traditional OOS Workflow vs AI-Accelerated Workflow
| Dimension | Traditional Manual Workflow | AI-Accelerated Workflow |
|---|---|---|
| Total Investigation Time | 30-45 days | 3-7 days |
| Historical Data Searched | Whatever the investigator manually recalls or pulls | Full LIMS, MES, and QMS history searched automatically |
| Root Cause Consistency | Varies by investigator and site | Standardized categorization across the organization |
| CAPA Quality | Built from one investigator's experience | Informed by precedent across all prior similar cases |
| Audit Readiness | Depends on how thoroughly notes were kept | Continuously scored and structured for review |
Compressing the timeline is valuable on its own, since every day a batch sits in quarantine is a day of tied-up inventory and schedule risk, but the more durable benefit is consistency. A quality system where every investigator reaches similar conclusions from similar evidence, and where every CAPA is built on a genuine root cause rather than a plausible guess made under deadline pressure, is the kind of quality system that holds up during an FDA inspection rather than generating a fresh set of 483 observations.
AI and OOS / OOT Investigations — Common Questions
How long should a pharmaceutical OOS investigation take?
Regulations do not specify an exact deadline, but industry practice, guided by the 1994 Barr Laboratories decision, treats thirty business days as a common benchmark, with most facilities completing the full process within thirty to forty-five days. Phase I laboratory review is typically expected within three to ten business days. Facilities looking to compress this timeline without sacrificing rigor can Book a Demo to see how AI-assisted evidence gathering shortens Phase II specifically.
Can an OOS result be attributed to laboratory error without a full investigation?
No. FDA guidance is explicit that an OOS result should never be attributed to laboratory error without a documented investigation that clearly establishes an assignable cause, such as a confirmed calibration issue or a specific sample preparation mistake. A vague explanation of analyst error, without objective supporting evidence, is not sufficient grounds to invalidate a result.
Does using AI in an OOS investigation weaken the audit trail or the scientific rigor?
No, when implemented correctly it strengthens it. AI tools used for OOS investigations are designed to assist evidence gathering and pattern recognition, not to make the final root cause determination. The quality unit retains full authority over the investigation conclusion and batch disposition decision, consistent with 21 CFR 211.22, and every AI-surfaced correlation is documented alongside the human review that confirmed or ruled it out. The iFactory Support team can walk through how this documentation is structured for inspection readiness.
What is the difference between an OOS result and an OOT result?
An out-of-specification, or OOS, result falls outside the formally established acceptance criteria for a product and requires immediate investigation before any batch disposition decision. An out-of-trend, or OOT, result remains technically within specification but deviates meaningfully from the historical pattern for that product or process, often signaling an early process shift worth investigating before it produces an actual OOS failure down the line.
How many investigations does a typical facility have open at once?
This varies widely by facility size and product complexity, but organizations managing fifty to two hundred open corrective and preventive action records at any given time are common in mid-size to large manufacturing operations. At that scale, even modest reductions in average investigation time translate into a meaningfully smaller quarantine footprint and faster batch release across the full production schedule.
Stop Letting Data Retrieval Set Your Investigation Timeline.
Talk to iFactory about connecting your LIMS, MES, and QMS into a single AI-supported investigation workspace built for regulated environments.