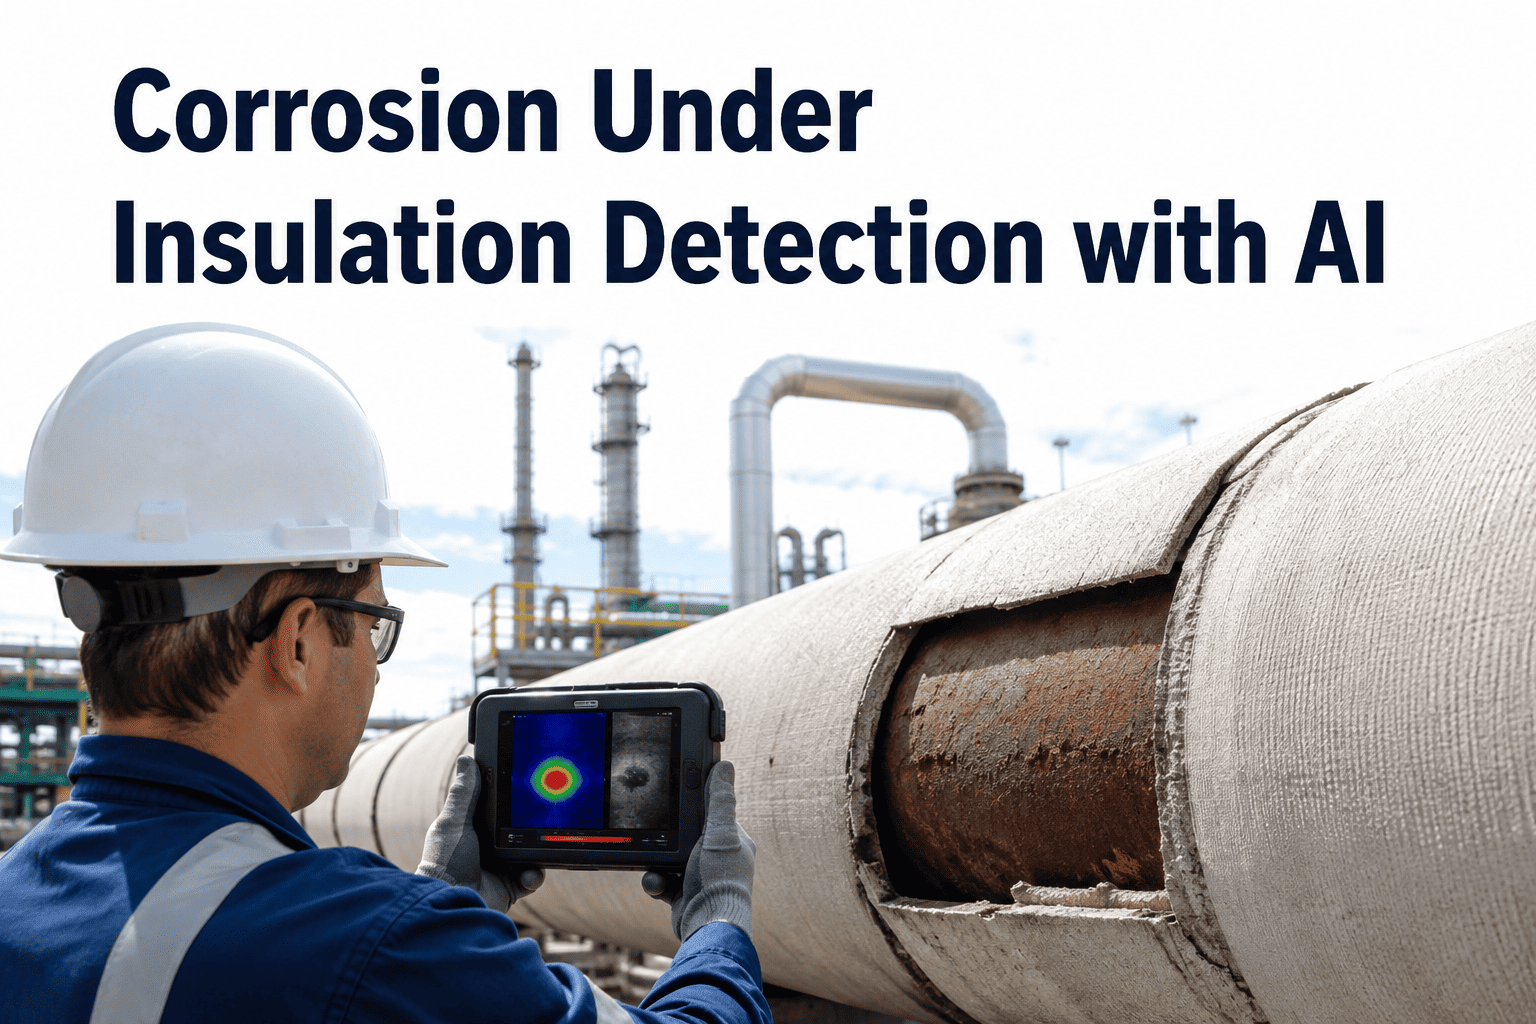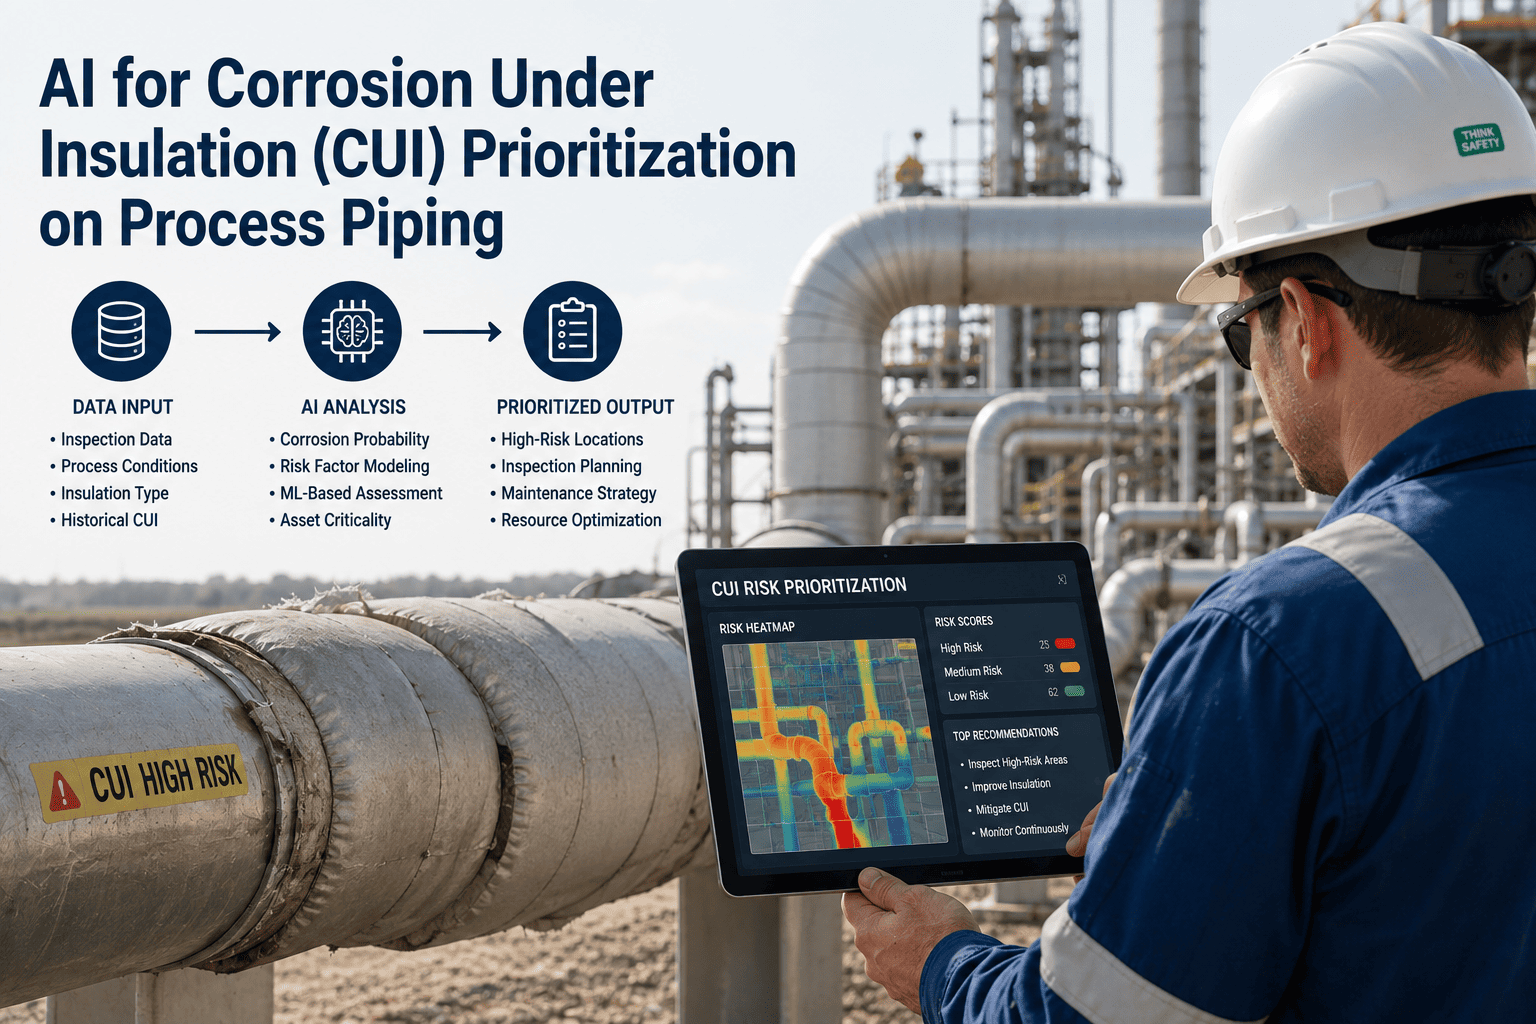
A carbon steel line running at 180°F under mineral wool insulation looks identical from the outside to the line next to it running at 400°F — insulation hides operating temperature, wall condition, and moisture exposure equally well, whether the pipe underneath is sound or already down to half its design thickness. Corrosion under insulation develops in the dark, inside the 25°F to 250°F band where trapped moisture cycles between wet and dry against bare metal, and by the time a bulge in the jacketing or a rust stain gives it away, wall loss is often already active. Most plants cannot afford to strip insulation from every susceptible segment on a piping system that runs into the thousands of joints, so the entire inspection program depends on ranking risk correctly before a single wrap comes off. AI-based CUI prioritization pulls thermal profiles, operating temperature cycling history, insulation age, and coating condition into a single risk score per segment, built on the same factors API RP 583 uses to rank CUI potential — so inspection dollars go to piping that is actually losing wall, not piping that merely looks old. Teams evaluating how this fits an existing RBI program can Book a Demo to see the scoring model run against a sample piping isometric.
Why Corrosion Under Insulation Slips Past Standard Inspection Programs
CUI is not a rare damage mechanism — it is one of the most persistent and expensive causes of unplanned piping failure in process plants, precisely because the insulation built to protect the pipe is also what conceals the corrosion happening underneath it. Programs that rely on visual walk-downs or a fixed inspection calendar tend to treat every insulated segment as roughly equal risk, which means the segment of piping actually losing wall gets the same attention as insulation that has sat dry and undisturbed for a decade. That mismatch is exactly what a risk-ranked, data-driven scoring approach is designed to correct, and it is why API RP 583 exists in the first place — not as a detection manual, but as a ranking methodology that acknowledges no plant can inspect everything at the same depth.
The problem compounds over time in a specific way. Every year a segment goes uninspected, the gap between its recorded condition and its actual condition widens, and because insulation conceals rather than reveals, that gap grows silently. A plant running purely on inspection-interval logic accumulates a backlog of segments whose last recorded data point is increasingly disconnected from reality, and there is no visual cue on the outside of the jacketing to signal which ones have drifted furthest. Risk scoring exists to close that gap before it turns into a leak, a fire, or an unplanned outage.
Insulation Hides Damage Until It Is Structural
Jacketing and cladding are built to keep water out, which means they are equally effective at keeping visual evidence of corrosion in. A pipe can lose most of its remaining wall thickness under a perfectly intact-looking aluminum jacket, with no external sign until a leak, a bulge, or a failed hydrotest forces the issue.
Every Segment Looks the Same From Outside
A walk-down inspector looking at a rack of insulated lines cannot see operating temperature, insulation age, or coating history from the ground. Without that data attached to each segment, prioritization defaults to whatever is easiest to reach or whatever failed last time, rather than whatever is statistically most likely to be failing now.
Thermal Cycling Multiplies Risk Silently
Intermittent-service and standby lines that swing in and out of the susceptibility window repeat the wet-dry cycle that drives CUI far more often than lines held at a steady temperature. That cycling history rarely lives anywhere technicians can see it, so the highest-risk lines on a unit are often the least visible ones on paper.
The Scale of the CUI Problem, in Numbers
CUI programs fail for a structural reason, not a technical one — there is simply too much insulated piping and too little time and NDE budget to inspect all of it at the same depth. Seeing the scale laid out is usually what convinces a reliability team that scoring, not scheduling, has to be the starting point.
The Data AI Combines Into a Single CUI Risk Score
A defensible risk score cannot be built from temperature alone. API RP 583 ranks CUI potential on a combination of factors, and an AI model does the same thing continuously instead of at the last inspection interval — pulling live and historical data together per segment rather than relying on whatever was recorded at the last turnaround. The nine inputs below fall into three groups, and a segment only earns a high risk tier when factors from more than one group line up, which is what keeps the model from over-flagging every line that simply happens to run hot.
Operating Temperature History
Continuous or logged process temperature trended against the known CUI susceptibility band, not a single design-basis number pulled once and never revisited.
Cyclic and Intermittent Service Flags
Segments that start up, shut down, or swing temperature regularly are flagged separately, since repeated wet-dry cycling accelerates corrosion far more than steady-state operation.
Turndown and Standby Periods
Time spent at reduced rate or on standby, when a line can sit inside the susceptibility window without the heat that normally keeps insulation dry during full-rate operation.
Insulation Type and Installed Age
Material type, thickness, and years in service, since different insulation systems retain moisture differently and age changes how well a jacket still sheds water.
Jacketing and Seam Integrity
Recorded condition of cladding seams, overlap direction, caulking, and penetration flashing, pulled from the last inspection or walk-down rather than assumed intact.
Coating System and Application Date
Protective coating type and how long it has been in service under insulation, since coating breakdown timelines vary widely by product and application quality.
Climate and Rainfall Exposure
Local precipitation, humidity, and seasonal wetting patterns that determine how much moisture challenge a jacketing system actually faces over a year.
Chloride Exposure
Proximity to marine air, cooling tower drift, or wash-down water, which raises chloride stress-corrosion cracking risk on stainless steel segments specifically.
Piping Configuration
Low points, dead legs, supports, and penetrations, which trap and hold water differently than a straight run and consistently drive localized rather than general wall loss.
Traditional Risk-Based Inspection vs AI-Prioritized CUI Screening
Most plants already run some form of risk-based inspection under API 580 and API 581. AI prioritization does not replace that framework — it feeds it continuously updated, segment-level CUI likelihood data instead of the static, interval-driven inputs an RBI program typically works from. The differences below show up most clearly in the weeks before a turnaround, when a planner is deciding exactly which segments justify the labor cost of stripping insulation and which can safely wait another cycle.
| Factor | Traditional RBI Approach | AI-Prioritized Approach |
|---|---|---|
| Segment coverage | Ranked in batches at turnaround planning, based on the last recorded inspection | Every insulated segment scored continuously from live and historical operating data |
| Data refresh | Updated only when a new inspection or walk-down is logged | Refreshes automatically as temperature, cycling, and condition data comes in |
| Screening method selection | Chosen by inspector judgment or standard practice for the asset type | Suggested from risk tier and material, matched against the applicable NDE method set |
| Response to a process change | Re-ranking waits for the next scheduled RBI review cycle | Segments whose temperature shifts into or out of the susceptibility band re-score immediately |
| Documentation trail | Spread across inspection reports, spreadsheets, and turnaround work packages | Every score change is timestamped and traceable to the data that drove it |
CUI Risk Tiers and What Each One Means for Inspection Cadence
A risk score only becomes useful once it maps to an action. iFactory groups scored segments into four tiers, each tied to a recommended inspection cadence and a starting point for method selection, so a planner can move straight from a ranked list to a work scope.
Peak susceptibility temperature, cyclic service, aging insulation, and degraded jacketing together. Scheduled for insulation removal and direct inspection at the next available window, not deferred to the next turnaround.
Inside the susceptibility band with one or two aggravating factors, such as coastal chloride exposure or an aging coating system. Prioritized for non-intrusive screening ahead of the next turnaround.
Within or near the susceptibility band but with intact jacketing and a recent coating history. Rechecked on a standard interval and re-scored automatically if operating conditions change.
Consistently outside the susceptibility range or insulated with a low-moisture-retention system in good condition. Held on a long interval unless a data change moves it into a higher tier.
How the Risk Score Changes an Inspection Plan
The clearest way to see the value of scoring is to compare how the same turnaround gets planned with and without it.
A planner works from a spreadsheet of segments last inspected three to five years ago, ranked mostly by how long it has been since anyone looked. Insulation comes off in the order it was scheduled, not the order risk actually runs. Some critical dead legs and standby lines never make the list at all, because nobody flagged their cycling history as a factor worth tracking.
The same turnaround scope starts from a ranked list where every segment already carries a tier, a driving factor, and a suggested NDE method. Critical and high-tier segments get the insulation removal and direct inspection budget; medium and low-tier segments get non-intrusive screening or are deferred with documented justification. The scope reflects where wall loss is actually likely, not just where it has been convenient to look before.
Adding AI-Based CUI Scoring Without Disrupting Your Current RBI Program
Plants do not need to replace an existing RBI framework to adopt this. A phased rollout lets the scoring model run alongside current practice until the reliability team trusts the output enough to plan a turnaround scope directly from it.
Score the Existing Piping Register
Run the model against current isometrics, operating history, and the last known insulation and coating condition to produce a first-pass risk score for every segment, without changing any current inspection schedule yet.
Validate Against Known Findings
Compare the model's highest-tier segments against wall loss actually found at recent turnarounds, refining inputs like chloride exposure and jacketing condition where the score and the field findings disagree.
Plan the Next Turnaround From the Score
Build the next CUI inspection scope directly from the ranked list, with critical and high-tier segments driving insulation removal budget and method selection instead of last cycle's checklist.
Common Mistakes Plants Make When Prioritizing CUI
Teams that have tried to risk-rank CUI manually tend to repeat a small set of avoidable mistakes. Recognizing them early keeps a scoring rollout from producing a list nobody trusts.
Scoring by Temperature Band Alone
Temperature is necessary but not sufficient — two segments in the same susceptibility band can carry very different risk once insulation age, jacketing condition, and coating history are added in. A score built on temperature alone will consistently misrank segments that look similar from the outside.
Treating Dead Legs and Low Points as Standard Risk
Configuration features that trap water behave nothing like a straight run at the same operating temperature. Scoring models that ignore piping geometry consistently underrate the segments most likely to show localized pitting rather than general wall loss.
No Re-Scoring After a Process Change
A line that moves into a new operating range after a debottlenecking project or a feedstock change can enter the CUI susceptibility band without anyone updating its risk tier, leaving it under-inspected exactly when its risk profile has shifted the most.
Disconnecting Risk Tier From Method Selection
A risk score that does not feed directly into NDE method selection just becomes another report next to the inspection plan instead of driving it, which is exactly the gap a connected scoring workflow is meant to close.
Matching NDE Method to Risk Tier and Material
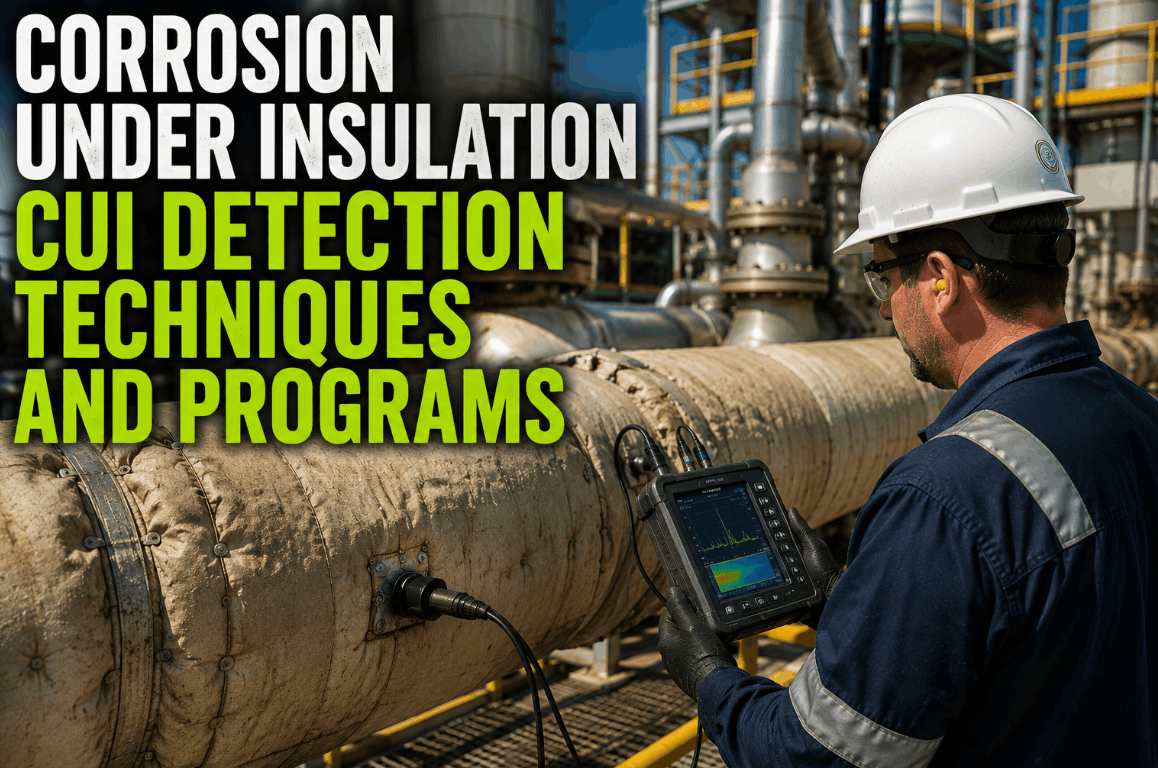
Risk scoring is only half the workflow — the other half is choosing an inspection method that fits the tier, the material, and how accessible the segment actually is. API RP 583 references a wide range of NDE techniques for CUI, from broad-area screening tools to methods that confirm and size damage once a suspect area is found, and matching the right one to the right segment is where a lot of inspection budget is won or lost.
Direct Visual After Removal
For carbon steel segments where accessibility allows it, removing a section of insulation for direct inspection remains the most conclusive method and is typically justified once a segment ranks Critical.
Profile or Real-Time Radiography
Where removal is impractical, radiographic profiling reads wall thickness through the insulation and jacketing without disturbing the system, making it a strong fit for elevated or hard-to-reach High-tier lines.
Pulsed Eddy Current Screening
A broad-area screening tool that scans through insulation to flag wall loss trends across a run of piping, well suited to Medium-tier segments where the goal is confirming a segment still belongs in its current tier.
Insulation Moisture Detection
Non-intrusive moisture scanning identifies wet insulation zones before they translate into measurable wall loss, giving Medium-tier segments an early warning that can trigger a tier upgrade ahead of schedule.
Surface Eddy Current Testing
On austenitic stainless segments flagged for chloride stress-corrosion cracking risk, surface eddy current after insulation removal detects near-surface cracking that thickness measurement alone would miss.
Guided Wave Ultrasonics
For long, insulated stainless or carbon steel runs, guided wave testing screens extended lengths from a single access point, useful for prioritizing which shorter sections warrant closer follow-up.
Frequently Asked Questions: AI CUI Prioritization on Process Piping
Does this replace our existing API 580/581 risk-based inspection program?
No — it feeds it. Most plants already run RBI under API 580 and API 581, and the CUI scoring model plugs into that framework as a continuously updated likelihood input specific to corrosion under insulation, rather than a separate program running in parallel. The turnaround planning process, approval structure, and documentation requirements stay the same; what changes is how current and granular the CUI likelihood data feeding those decisions actually is. Teams wanting to see how the two fit together can contact iFactory Support for a walkthrough against their current RBI setup.
What data do we need before the model can produce a useful risk score?
At minimum, the model needs a piping register with operating temperature history, insulation type and installed age, and the last recorded jacketing or coating condition per segment. Chloride exposure and configuration data such as dead legs and low points improve accuracy further but are not required to produce a meaningful first-pass ranking. Plants with incomplete records typically start with a coarse score on available data and refine it as inspection findings come in.
How does the model decide which NDE method to suggest for a given segment?
Method suggestions are matched against the segment's risk tier, material, and accessibility, drawing on the same range of detection techniques referenced for CUI screening and confirmation. High-tier carbon steel segments in accessible locations typically point toward direct insulation removal or profile radiography, while high-tier stainless segments flag for methods suited to surface cracking rather than general wall loss. The suggestion is a starting point for the inspection planner, not a final decision.
How often does a segment's risk tier get recalculated?
Scores refresh automatically whenever new operating data, an updated inspection finding, or a process change affecting temperature is recorded, rather than waiting for the next scheduled RBI review. This is one of the main advantages over a manual ranking exercise, since a segment that shifts into the susceptibility band after a debottlenecking project or a feedstock change gets re-tiered as soon as that shift is reflected in the data instead of sitting at its old rank until the next turnaround cycle.
Can this be piloted on a single unit before a facility-wide rollout?
Yes — most plants start with a single process unit or a defined piping circuit, score it against available records, and validate the output against recent turnaround findings before expanding further. This keeps the initial investment small while giving the reliability team a concrete basis for trusting the ranking on a larger scope. Teams ready to scope a pilot can Book a Demo to walk through unit selection and data requirements.