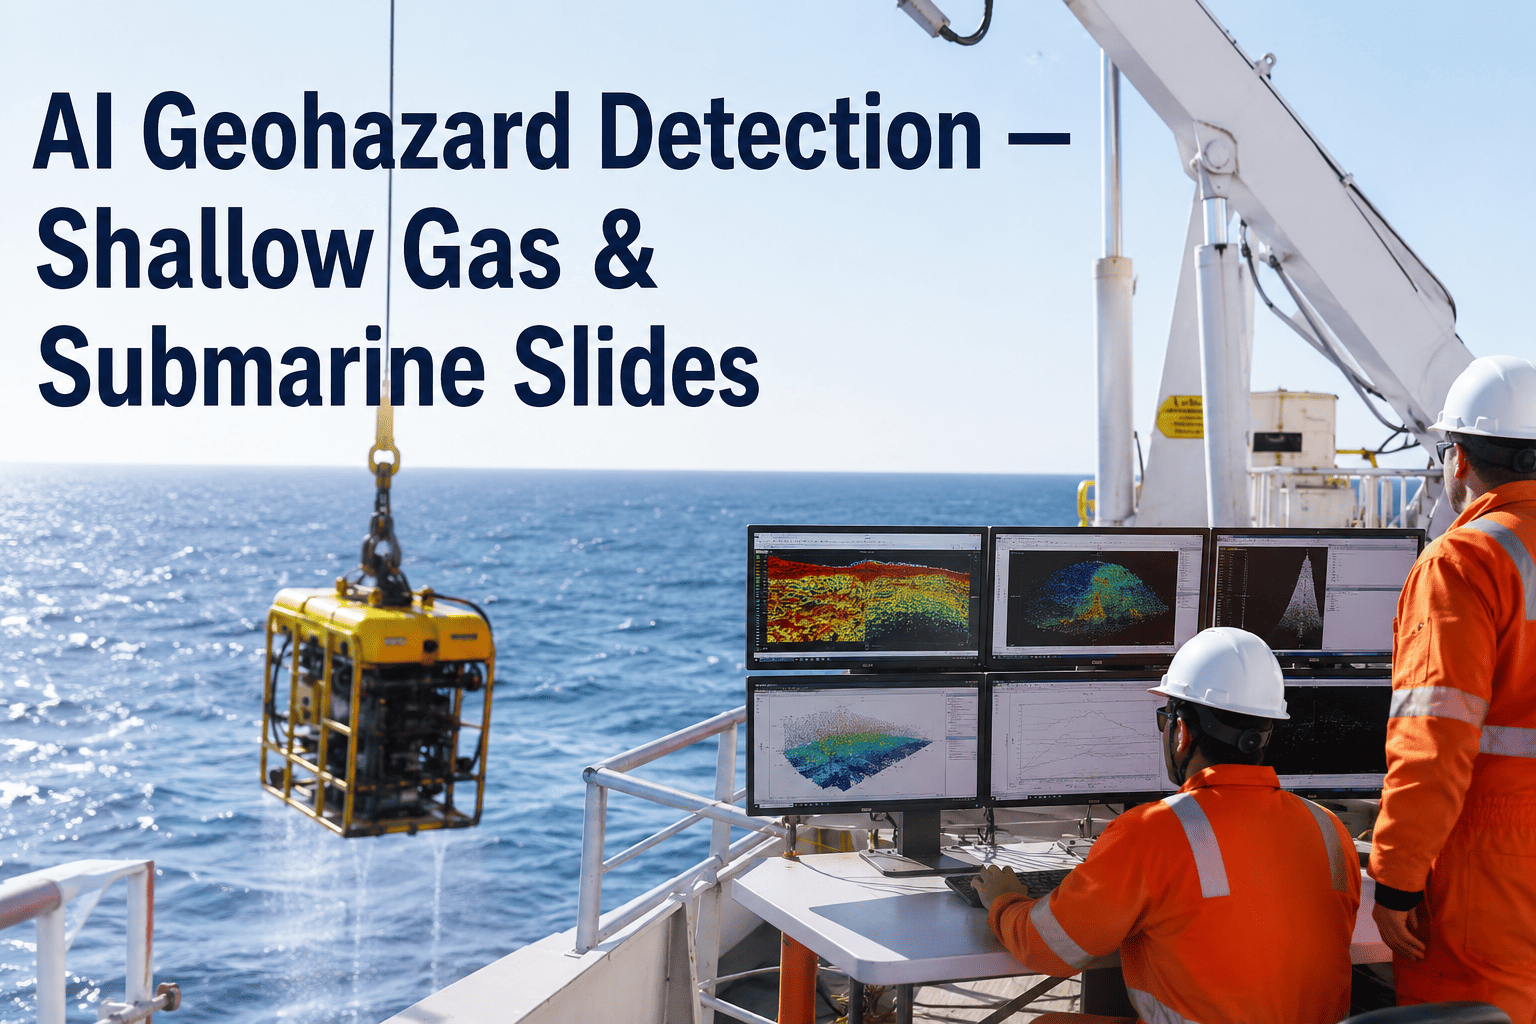
Offshore drilling decisions worth hundreds of millions of dollars often rest on geohazard assessments that still rely heavily on manual seismic interpretation. Shallow gas pockets, submarine slides, gas hydrate zones, and shallow water flow hazards hide within 3D seismic volumes, and missing even one of them can turn a routine development well into a blowout, a seabed failure, or a costly sidetrack. AI geohazard detection is changing that equation by scanning entire survey blocks in hours instead of weeks, flagging the amplitude anomalies, pockmarks, and fault geometries that human interpreters take months to map. See how this works in practice when you book a demo with our team.
SEISMIC DATA ANALYTICS · OIL & GAS · GEOHAZARD DETECTION AI
AI Geohazard Detection — Catching Shallow Gas and Submarine Slides Before They Catch You
iFactory's AI scans 3D seismic volumes for shallow gas pockets, mass transport deposits, hydrate zones, and fault seal risks in hours rather than weeks, giving your geohazard team the lead time to reroute wellbores or adjust development layouts before spud.
Shallow Gas · Critical
Submarine Slide · High
Gas Hydrate Zone · High
Shallow Water Flow · Mod-High
Fault Seal Failure · Moderate
THE COST OF A MISSED HAZARD
Why Geohazard Detection Determines Whether a Well Gets Drilled or Abandoned
Every offshore development block carries geological risks buried beneath the seabed that no surface survey can reveal. Regulatory frameworks like NORSOK G-01 and API RP 17A require documented geohazard assessments before operators can commit drilling capital, yet the manual interpretation workflows most teams depend on were built for an era when surveys covered smaller areas and timelines were more forgiving. When a shallow gas pocket or a mass transport deposit goes undetected, the consequences range from expensive well control events to complete abandonment of a prospect that might have been viable with a slightly different well path.
$5-50M
Average cost of a single geohazard-related drilling incident, including rig downtime, well intervention, and potential sidetrack operations.
4-8 Wks
Typical turnaround for a manual geohazard interpretation report on a single survey block, often stretching longer for complex shelf margins.
60-80%
Reduction in interpretation cycle time reported by teams that layered AI feature extraction onto their existing seismic workflows.
30%+
Share of continental margin seabed affected by submarine mass transport deposits, making slide risk a near-universal planning concern.
FOUR HAZARDS AI CATCHES FIRST
The Shallow Geohazards That Derail Drilling Programs Most Often
These four hazard categories account for the vast majority of shallow drilling risks encountered on continental shelves worldwide. Each one leaves a distinct seismic signature that AI models can learn to recognize with higher consistency than manual scanning, especially when features are subtle, partially buried, or spread across large survey areas where interpreter fatigue is a real factor.
Shallow Gas Pockets
Gas accumulated in shallow sediments generates amplitude anomalies, bright spots, and gas chimneys that disrupt the seismic signal. When a drill bit penetrates a pressurized gas pocket, the result can range from minor kicks to full blowouts. AI detects these anomalies by analyzing amplitude variation with offset, instantaneous frequency, and coherence volumes simultaneously, catching dim bright spots and low-amplitude gas chimneys that interpreters often miss during long manual review sessions.
Submarine Slides and Mass Transport Deposits
Ancient and active submarine landslides leave behind headwall scarps, chaotic internal reflectors, debris flows, and compressive ridges that indicate zones of past or potential seabed instability. Placing a wellhead, subsea manifold, or pipeline route on or near a mass transport deposit creates structural risk that can invalidate a development concept entirely. AI maps the extent and internal geometry of these deposits across entire survey blocks in a single pass, identifying slide boundaries that manual mapping might leave inconsistent.
Gas Hydrate Zones
Methane hydrates form within the gas hydrate stability zone and appear on seismic as bottom-simulating reflectors paired with velocity pull-ups and amplitude blanking above the BSR. Drilling through a hydrate zone can trigger dissociation, releasing gas into the wellbore and destabilizing the surrounding formation. AI identifies BSR geometry, maps the vertical extent of the stability zone, and flags velocity anomalies that suggest hydrate concentration variations across the survey area, giving drillers the thermal and pressure boundaries they need to plan safe mud programs.
Shallow Water Flow and Overpressured Sands
Overpressured shallow sand bodies charged with gas or water can flow uncontrollably into a wellbore during riserless drilling, washing out the hole and potentially compromising the structural integrity of the conductor casing. These sands often appear as low-amplitude, dim-spot anomalies with lateral velocity variations that are easy to overlook on conventional amplitude displays. AI correlates dim spots with interval velocity maps and stratigraphic position to distinguish overpressured sands from benign low-impedance layers, reducing false positives that waste investigation time.
THE AI DETECTION PIPELINE
How AI Reads a Seismic Volume for Geohazards From Ingestion to Report
The detection workflow runs as a sequential pipeline that transforms raw seismic data into a prioritized geohazard register. Each stage is designed to add analytical value without removing the geoscientist from the decision loop, so the final assessment carries both computational scale and expert judgment.
1
Seismic Volume Ingestion
3D and 4D seismic surveys, high-resolution site surveys, and bathymetric datasets are loaded into the platform through standard SEG-Y and format integrations, with automatic header validation and coordinate registration.
2
Automated Feature Extraction
The AI computes amplitude, coherence, curvature, dip, and spectral decomposition attributes across the full volume simultaneously, isolating anomalies that deviate from the regional geological background.
3
Hazard Classification
Machine learning models trained on labeled geohazard examples classify each extracted anomaly by type, assigning confidence scores based on how closely the seismic signature matches known hazard patterns.
4
Risk Scoring and Prioritization
Each classified hazard is scored for severity based on depth, proximity to planned well trajectories, areal extent, and confidence level, producing a ranked register that tells the team where to focus first.
5
Interpreter Review and Reporting
Geoscientists validate the AI output, adjust classifications where local knowledge adds context, and generate the final geohazard assessment report with mapped hazard polygons and risk narratives.
TRADITIONAL VS AI-ENABLED WORKFLOW
What Changes When Seismic Geohazard Interpretation Moves From Manual to AI-Assisted
The comparison below reflects the operational differences reported by geohazard teams after layering AI feature extraction and classification onto their existing interpretation process rather than replacing the interpretive workflow itself.
| Interpretation Dimension |
Traditional Manual Workflow |
AI-Enabled Workflow |
| Survey Coverage Speed |
Days to weeks of systematic inline and crossline scanning per survey block |
Full volume processed in hours with consistent attribute coverage |
| Subtle Feature Detection |
Depends on interpreter experience and fatigue level during long review sessions |
Consistent sensitivity to dim anomalies, low-relief scarps, and weak BSRs across entire volume |
| Hazard Boundary Mapping |
Manually picked polygons that vary in detail between interpreters |
Auto-generated boundaries with interpreter adjustment, improving inter-interpreter consistency |
| Scenario Testing |
Limited to one or two manual what-if analyses per assessment cycle |
Multiple well path and layout scenarios tested against the hazard register in the same session |
| Report Turnaround |
Four to eight weeks from data receipt to final deliverable |
Compressed to one to two weeks, with data ingestion and feature extraction completing in days |
| Regulatory Documentation |
Manual compilation of figures, maps, and risk matrices for submission |
Auto-generated map suites and risk registers formatted to NORSOK, API, and regional standards |
Your Seismic Data Already Contains the Hazard Signals — AI Just Finds Them Faster
iFactory connects to your existing seismic interpretation environment, running geohazard detection as an automated layer on top of the workflows your team already uses. No migration, no new software to learn, just faster hazard identification and a shorter path from survey to drill decision.
DECISION POINTS WHERE SPEED MATTERS
Four Drilling Decisions That Change When Geohazard Detection Happens in Hours
A compressed geohazard cycle does not just save calendar time. It changes which decisions are even possible to make, because the information arrives early enough to act on rather than arriving after the well path is already committed.
Wellbore Rerouting Before Spud
When AI flags a shallow gas chimney directly below the proposed surface casing point within days of receiving the site survey, the drilling team can shift the surface location or adjust the conductor angle before any rig mobilization cost is incurred. In a manual workflow, the same finding might not surface until the interpreter reaches that portion of the volume weeks later, by which point the rig contract timeline may not allow for a location change.
Development Layout Adjustment
Subsea manifold and pipeline route planning requires a stable seabed. When AI maps the full extent of a mass transport deposit across the development area in a single pass, the facilities team can shift the manifold location or reroute flowlines before front-end engineering design locks in the layout. Manual mapping often produces incomplete deposit boundaries that get refined too late in the design cycle to avoid costly engineering change orders.
Riserless Drilling Window Selection
The shallow section between seabed and conductor casing depth is the most vulnerable interval for shallow water flow. AI that delivers a shallow hazard map within days of survey receipt lets the drilling engineer select a casing depth that clears all overpressured sand zones before the riserless drilling program is finalized, rather than discovering a problem zone mid-drill and having to adjust mud weight or set an extra casing string on the fly.
Pipeline Route Corridor Comparison
Export pipeline routes often cross multiple geohazard zones including slide deposits, pockmark fields, and shallow fault networks. AI can run hazard density maps for multiple route corridors side by side in the same session, letting the subsea team compare total risk exposure across options rather than relying on a single manually interpreted corridor that may have missed hazards outside the primary interpretation focus area.
FREQUENTLY ASKED QUESTIONS
What Geohazard Teams Ask Before Bringing AI Into Their Seismic Workflow
How accurately can AI detect shallow gas compared to experienced seismic interpreters?
AI models trained on verified geohazard examples consistently match or exceed manual detection rates for amplitude anomalies and gas chimneys, particularly for subtle features that fall below the visual threshold interpreters typically screen for during long review sessions. The models maintain this sensitivity across the entire volume without the fatigue-related drop-off that affects manual interpretation of large survey blocks, though final validation by an experienced geoscientist remains essential for regulatory acceptance.
Book a demo to see detection results compared head to head on a sample volume from your survey area.
Does AI geohazard detection replace the geoscientist's judgment on drilling risk?
No. The platform automates the computationally intensive work of attribute generation, anomaly extraction, and initial hazard classification, but the risk assessment itself, determining whether a detected anomaly warrants a well path change, a casing adjustment, or simply a note in the register, still requires geoscientific judgment grounded in local geological knowledge and operational context. AI gives that judgment better data faster, which is the point.
Contact our support team to discuss how the platform fits around your existing interpretation review process.
What seismic data formats does the platform accept for geohazard analysis?
The platform ingests standard SEG-Y formats for 3D and 4D seismic volumes along with common high-resolution site survey formats, bathymetric grids, and well log data used for calibration. No data reformatting or preprocessing is required beyond standard header validation, which the platform handles automatically during ingestion. Your team continues working with the same data stores and file conventions they already use.
Book a demo to verify compatibility with your current seismic data pipeline.
How quickly can we get a geohazard assessment for a new survey block?
Data ingestion and automated feature extraction typically complete within hours for a standard shelf survey block, with the initial AI-generated hazard register available for interpreter review within one to two days. Full assessment turnaround, including geoscientist validation, map finalization, and report generation, generally falls in the one to two week range depending on survey complexity and the level of additional analysis required.
Book a demo to see a turnaround estimate modeled on your typical survey size and complexity.
Can the AI differentiate between a gas chimney and a fault with a similar seismic expression?
Yes. The classification models use multiple seismic attributes simultaneously, including coherence, curvature, dip azimuth, and spectral characteristics, to distinguish between vertical gas disturbance features and structural faults that may appear similar on a single amplitude slice. Multi-attribute analysis captures the difference between the chaotic, low-coherence signature of gas disruption and the more planar, high-coherence signature of a fault plane, even when both features share a similar vertical extent on a seismic section.
Book a demo to see the classification output on examples from your region.
The Next Seismic Survey Should Not Arrive With Unknown Hazards Buried in the Volume
iFactory's AI geohazard detection connects to your existing seismic interpretation workflows, scanning for shallow gas, submarine slides, hydrate zones, and overpressured sands before your well planning team commits to a location. Book a demo and see the detection capability mapped to your survey area.