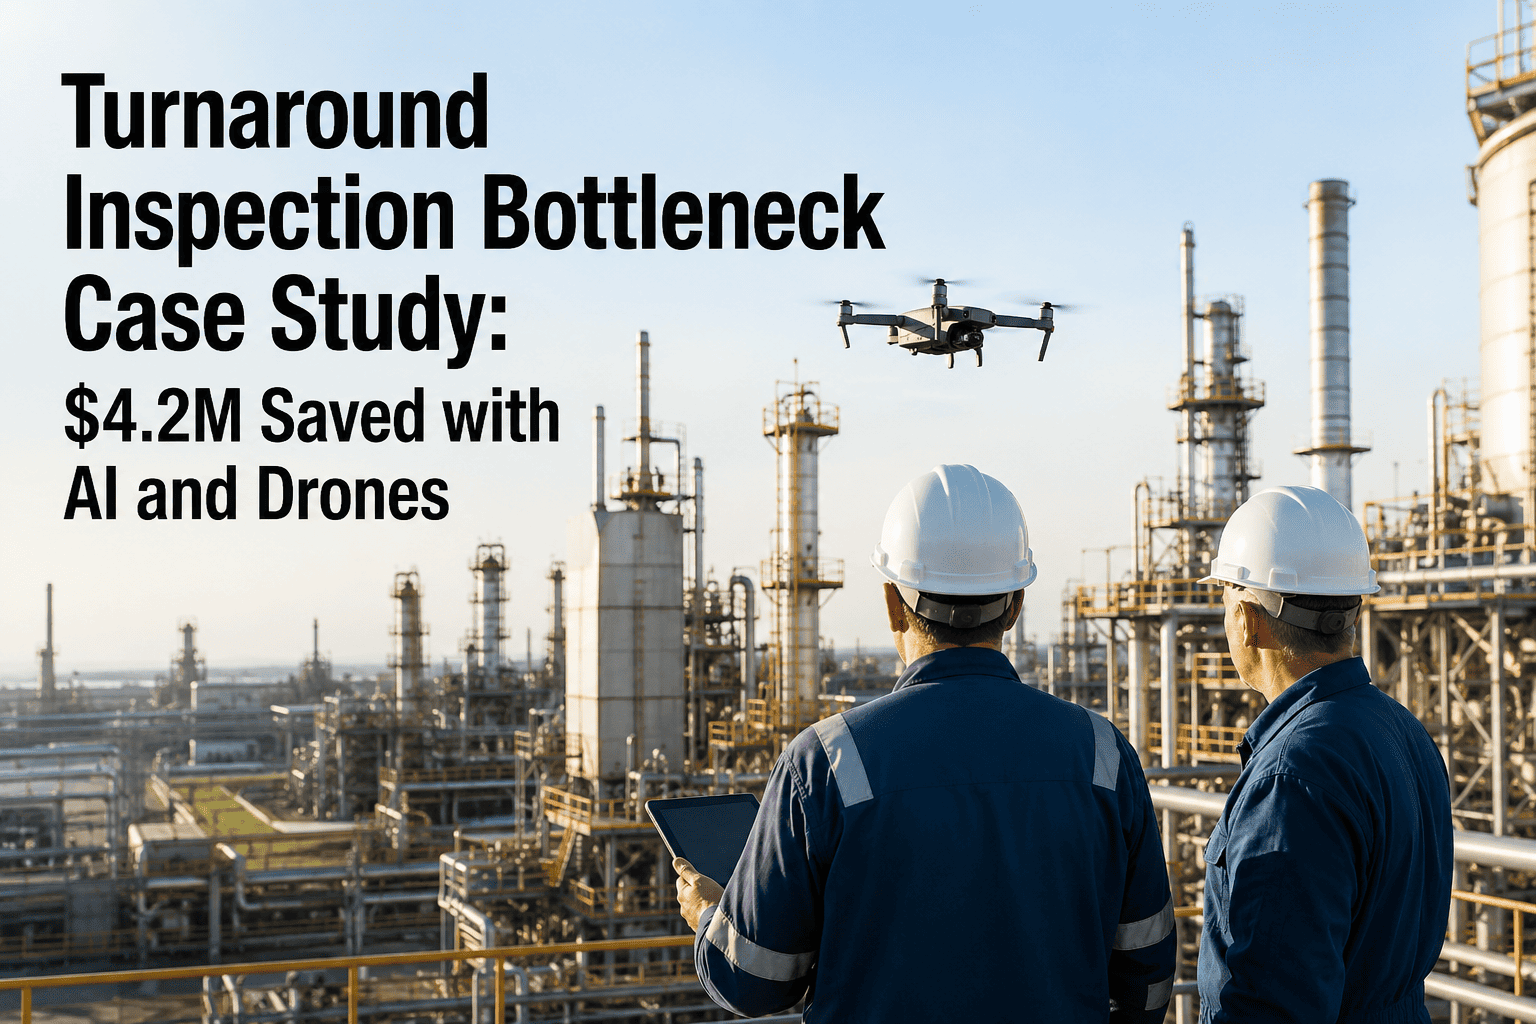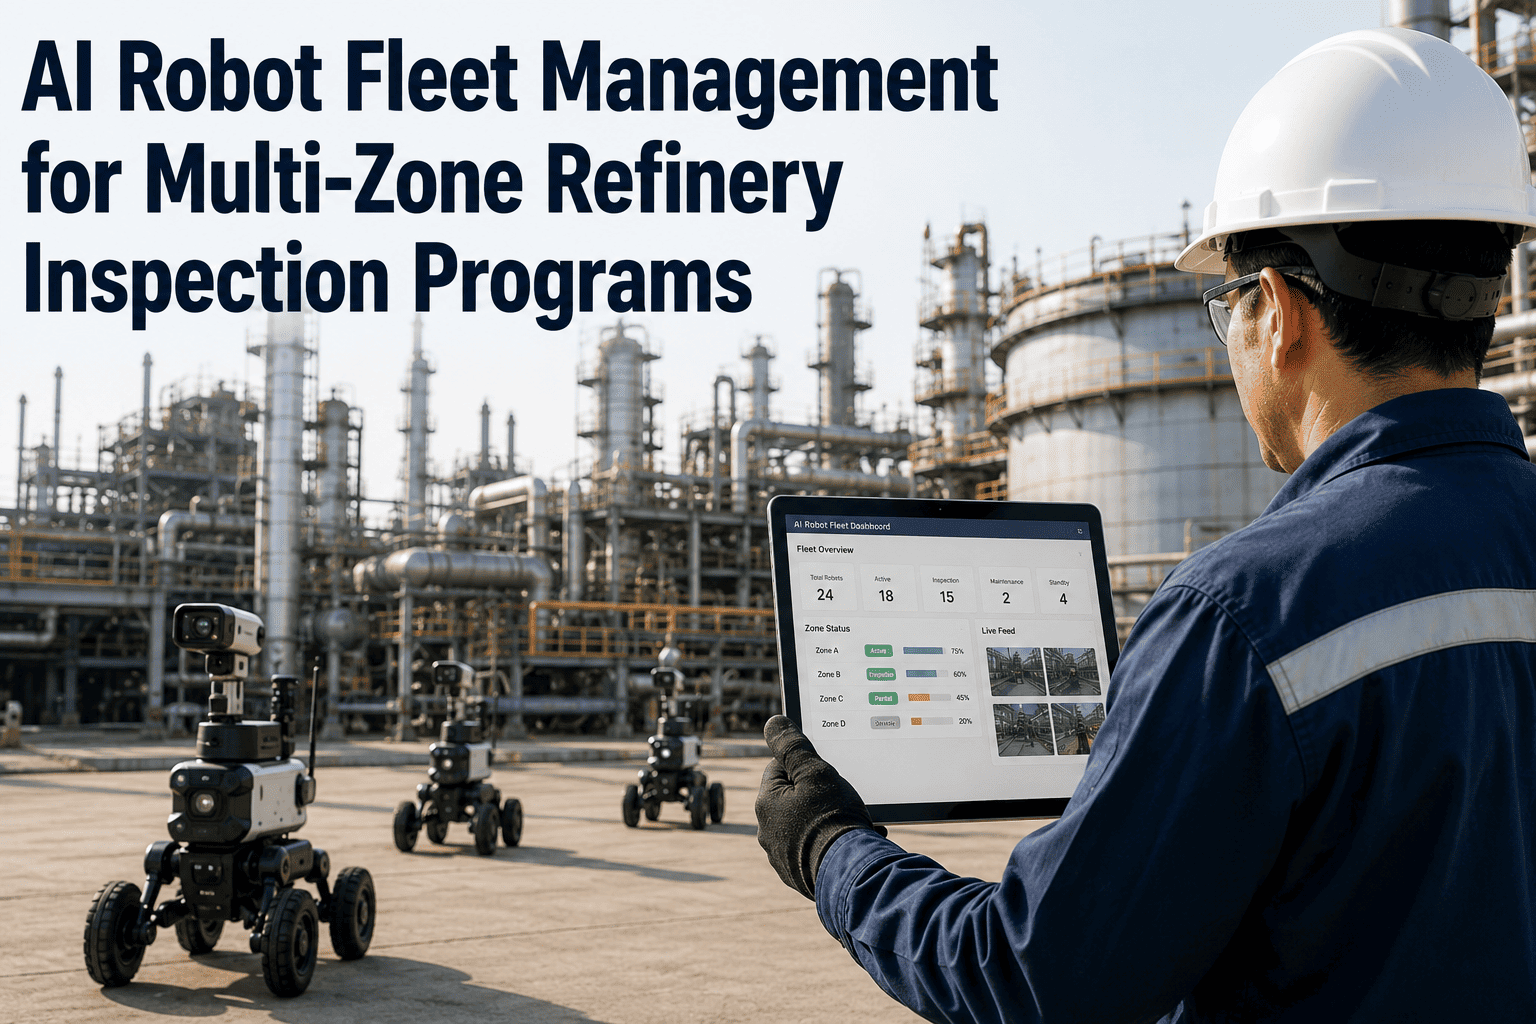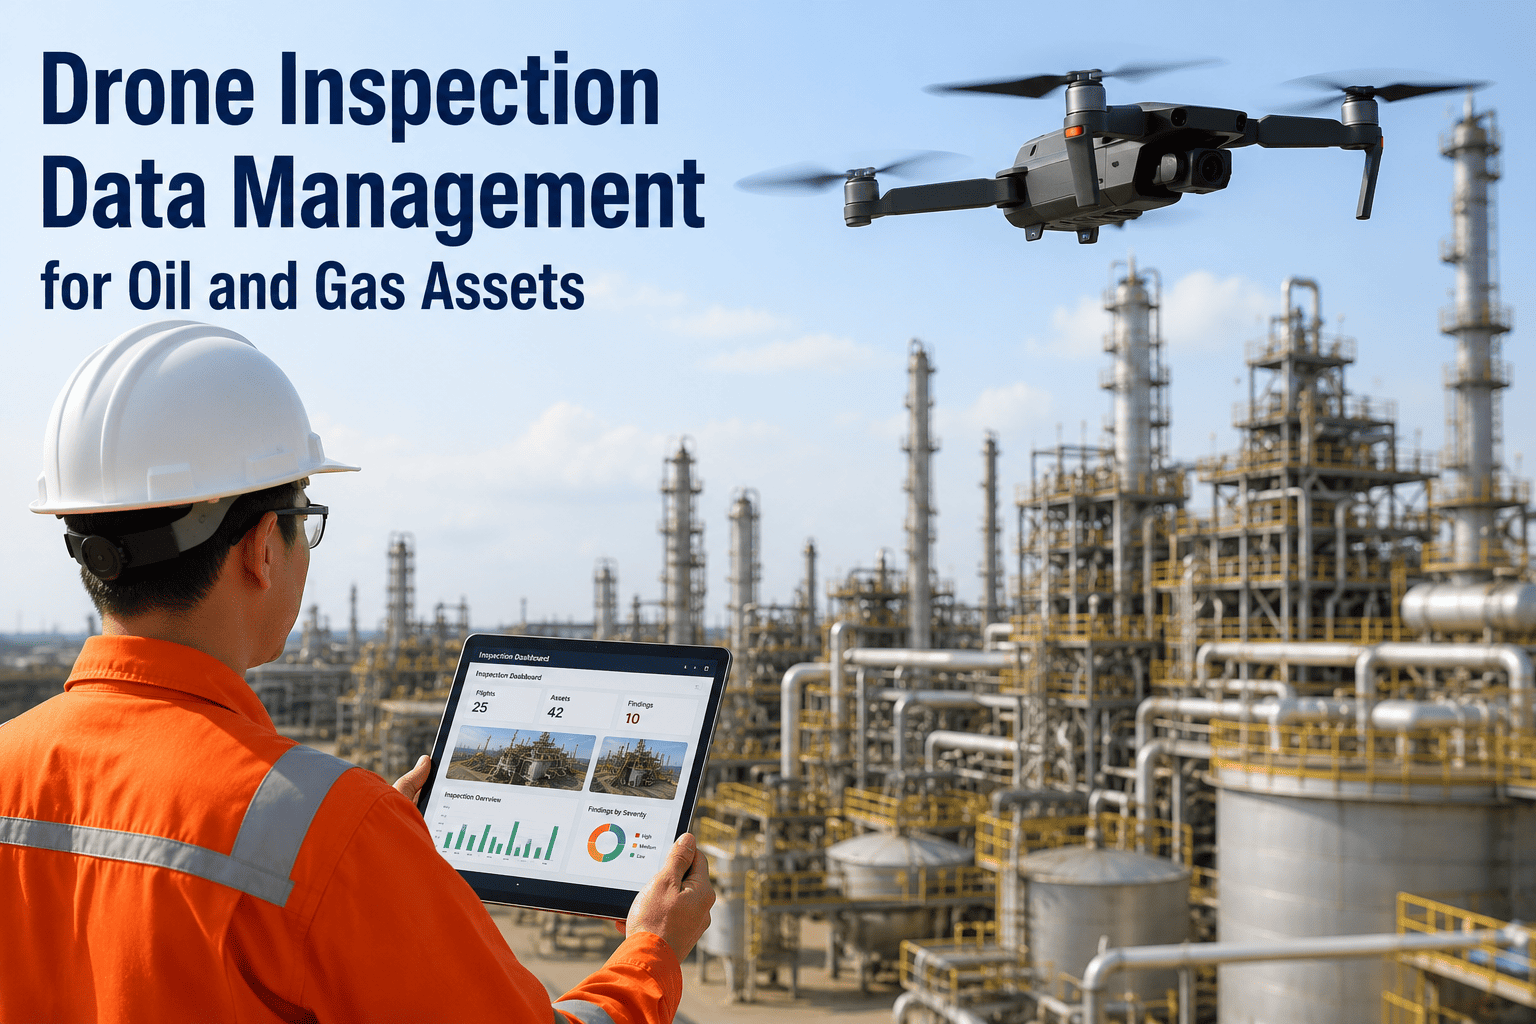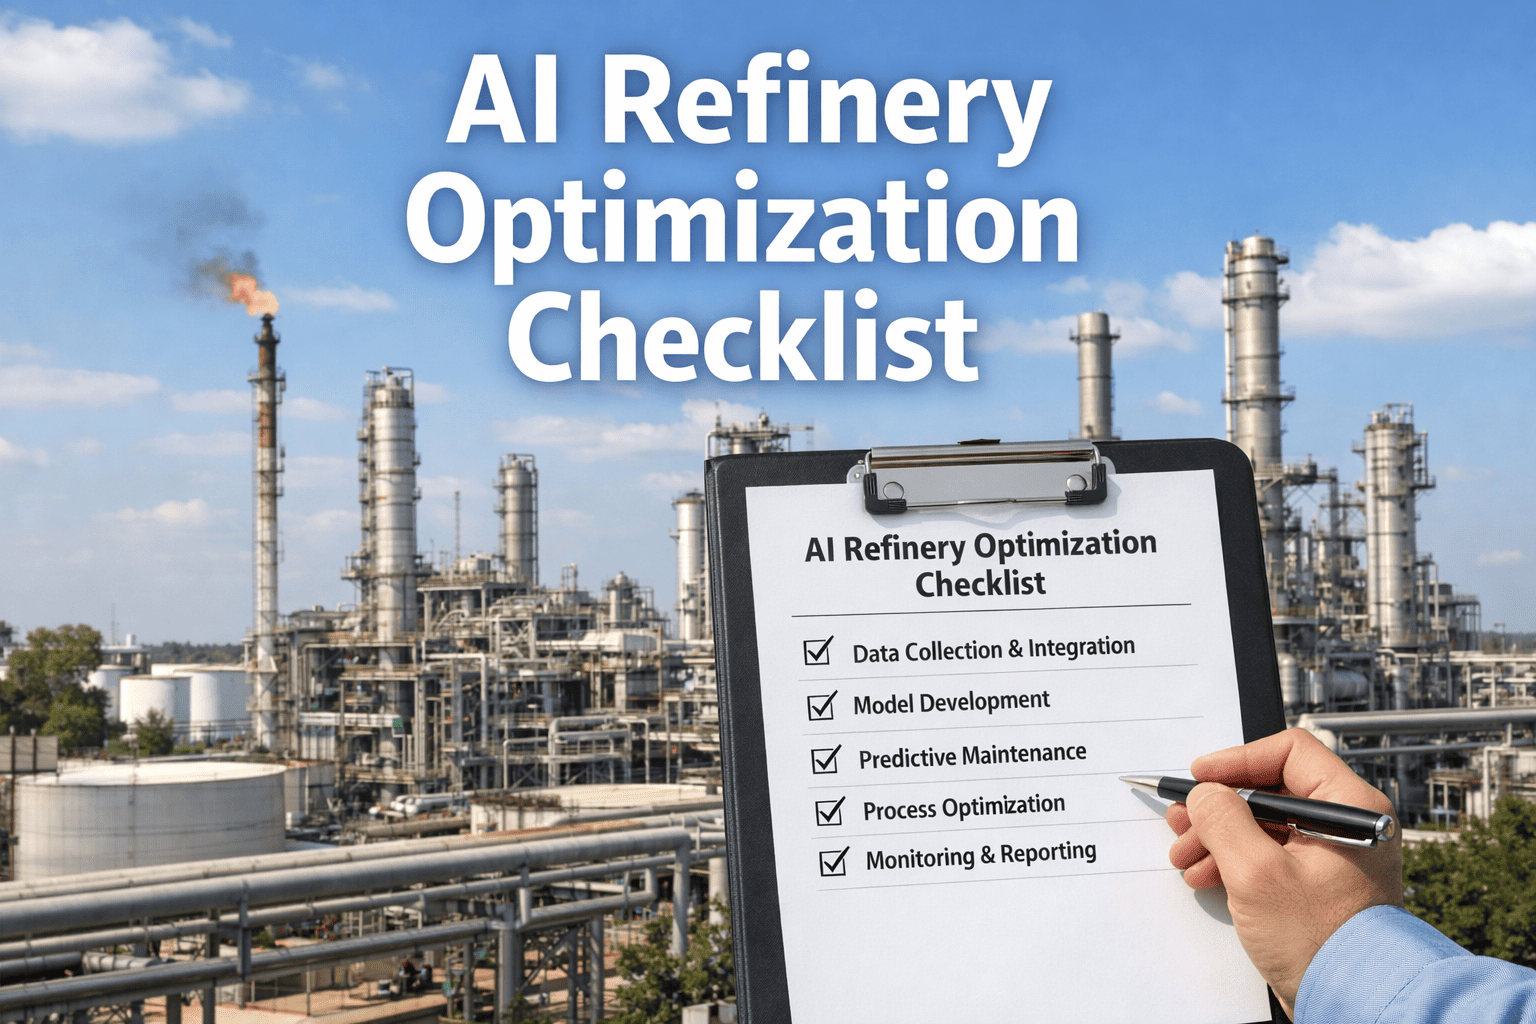
A multi-site refining group running eight facilities across three regions was budgeting close to five million dollars a year on scaffolding alone, before counting the rope access crews, the shutdown days, and the fall-exposure incidents that come standard with inspecting flare stacks, columns, and tank roofs the traditional way. Over twelve months they replaced that entire access model with an AI-guided drone inspection fleet, standardized across all eight sites, and the finance team ended the year having eliminated 4.2 million dollars in annual scaffolding spend while cutting turnaround inspection duration by 40 percent. This case study walks through exactly how that rollout was sequenced, site by site, and what changed operationally once standardized drone inspection replaced scaffolding as the default access method across the fleet.
Drone Inspection Fleet Deployment: 8 Refineries in 12 Months
How a multi-site refining group eliminated 4.2 million dollars in annual scaffolding costs and cut turnaround inspection duration 40 percent by standardizing AI drone inspection across its entire fleet.
The Starting Position: Eight Sites, Eight Different Access Playbooks
Before the rollout, each refinery in the group ran its own inspection program independently, contracting scaffolding crews and rope access teams on a site-by-site basis with no shared standard for how elevated assets, flare stacks, distillation columns, tank roofs, and pipe racks were accessed or documented. This was not unusual, it is close to the industry default, but it meant scaffolding spend, inspection duration, and safety exposure all varied significantly from one facility to the next depending on local contractor relationships and each site's own historical practice rather than any deliberate fleet-wide strategy.
Industry benchmarks put typical refinery scaffolding spend between 250,000 and 500,000 dollars per year per process unit, with complex Gulf Coast-style facilities often running higher, and that figure covers only the direct rental and erection cost, before adding the labor hours, the shutdown days each scaffolding cycle consumes, and the fall-from-height exposure that comes with every rope access mission. Across eight sites running multiple units each, that spend compounds into a very large number that most refining groups have never actually added up in one place, because it lives in eight separate site budgets rather than one line item anyone reviews together.
Inconsistent Access Methods
Scaffolding, rope access, and occasional third-party drone contractors used inconsistently across sites, with no shared standard for when each method applied or how results were documented.
Turnaround Schedule Risk
Scaffolding erection and dismantling routinely consumed three to five days per unit before any actual inspection work began, extending planned turnaround windows and the associated production downtime cost.
Fragmented Defect Records
Inspection findings lived in site-specific paper reports and local spreadsheets, making it difficult to compare corrosion progression or defect trends across sister units at different facilities.
Elevated Fall Exposure
Every rope access mission and every scaffolding climb represented a fall-from-height exposure event, a category that accounts for a substantial share of refinery inspection-related injuries industry-wide.
The Rollout Timeline: From First Pilot to Full Fleet
Rather than attempting a simultaneous rollout across all eight sites, the program followed a deliberately staged sequence, proving the model at one facility before committing the capital and change-management effort required to standardize the remaining seven. This sequencing is what kept the twelve month timeline realistic, since each new site benefited from lessons the previous site had already worked through.
Pilot Site Selected and Scoped
The group's largest and most scaffolding-intensive refinery was chosen as the pilot site specifically because it had the most to gain and the clearest baseline data to measure against. Scope was limited to flare stacks and one distillation column train.
Pilot Flights Run Alongside Scaffolding
Drone inspection ran in parallel with the site's existing scaffolding-based inspection for two full cycles, allowing direct comparison of defect detection, documentation quality, and time to complete between both methods before any commitment to replace scaffolding entirely.
Pilot Results Reviewed, Site Two Approved
With turnaround duration and defect detection results validated against the scaffolding baseline, the program was approved for expansion to a second site, and the pilot site's flight standards became the group's first standardized mission library.
Sites Two Through Five Onboarded
Four additional sites came online in sequence, each following the same standardized mission plans, defect taxonomy, and reporting format established during the pilot, with onboarding time shrinking noticeably at each successive site as the team's process matured.
Remaining Three Sites Deployed
The final three sites, including two smaller facilities with lower elevated-asset counts, were brought onto the platform, completing fleet-wide coverage and giving the group its first-ever unified view of inspection activity across all eight refineries.
Fleet-Wide Reporting Goes Live
A consolidated defect registry and analytics dashboard covering all eight sites went live, giving corporate reliability and maintenance planning teams a cross-site view of asset condition that had never existed before this program.
See How a Staged Multi-Site Rollout Would Work for Your Fleet
Every multi-site program has a different starting point. Book a session and iFactory will walk through a rollout sequence scoped to your facility count, asset mix, and current inspection spend.
Access Method, Before and After
The clearest way to see what changed is to compare the two access models directly on the same inspection task. The table below reflects the group's own tracked figures for a representative flare stack inspection, the asset type that consumed the largest share of the fleet's original scaffolding budget.
| Metric | Scaffolding and Rope Access | AI Drone Inspection |
|---|---|---|
| Time from mobilization to first inspection data | 3 to 5 days for scaffolding erection alone | Same-day, typically within hours of arrival |
| Personnel required on site | 6 to 8 person rope access or scaffolding crew | 2 to 3 person drone and data team |
| Fall-from-height exposure events | One per climb, repeated across the inspection | None, all data captured from ground control |
| Unit downtime during inspection | Full duration of scaffolding presence | Minimal, many inspections completed in-service |
| Documentation format | Manual notes and photographs, site-specific | Standardized 8K imagery with defect coordinates |
| Cross-site comparability | Limited, formats vary by site and contractor | Direct, same taxonomy and format at every site |
Where the 4.2 Million Dollars Actually Came From
The scaffolding elimination figure is not a single line item, it is the sum of several distinct savings categories that compound across eight sites. Breaking it down this way matters because it shows finance teams exactly which categories are hard, contractually locked-in savings and which are more variable, useful context for anyone building a similar business case internally.
Direct Scaffolding Rental and Erection
The largest single category, eliminated almost entirely on assets now inspected by drone, since erection and dismantling no longer happens at all for those inspection cycles.
Rope Access Labor and Crew Time
Reduced crew size from six to eight person rope access teams down to two to three person drone teams across the majority of routine inspection cycles fleet-wide.
Avoided Downtime During Turnaround
Shorter inspection windows meant units returned to service faster during planned turnarounds, recovering production time that scaffolding-based inspection had previously consumed by default.
Permits, Standby, and Support Costs
Confined space entry permits, standby rescue teams, and the administrative overhead tied to rope access missions, largely unnecessary once ground-controlled drone flights became the default method.
The 40 Percent Turnaround Reduction, Explained
Turnaround duration reduction is the metric that resonates most with plant managers, because every day a unit stays down during a planned turnaround has a direct, quantifiable production cost attached to it. The 40 percent figure reflects the elimination of the scaffolding erection and dismantling window from the inspection critical path, not a claim that inspection itself became instantaneous. Removing three to five days of pure access-building time from a turnaround schedule that previously treated scaffolding as a mandatory prerequisite step is where nearly all of that reduction comes from.
The blocks are proportional to relative time consumed within each inspection cycle. The erection and dismantling phases that dominate the scaffolding sequence simply do not exist in the drone-based sequence, which is the structural reason the reduction is as large as it is.
Standardizing Eight Sites on One Platform
Cost savings alone would not have justified the coordination effort of a twelve month, eight-site rollout if the program had stopped there. The larger operational shift was replacing eight independent, site-specific inspection practices with one standardized platform, a change that paid off in ways the original business case had not fully anticipated at the outset.
Shared Mission Libraries
Every site flies from the same validated mission plans for equivalent asset types, so a flare stack inspection at one refinery follows the same flight path, altitude, and overlap settings as the equivalent asset at any other site in the fleet.
One Defect Taxonomy
Corrosion, coating breakdown, and structural findings are classified using the same defect categories and severity scale at every site, which is what makes cross-site comparison meaningful rather than an exercise in reconciling eight different reporting formats.
Consolidated Defect Registry
Every finding across all eight sites lives in one queryable registry with a unique ID, asset location, timestamp, and repair history, replacing the scattered site-level spreadsheets that made fleet-wide trend analysis effectively impossible before.
CMMS and Maintenance Integration
Defect findings feed directly into each site's maintenance planning system, so a corrosion finding on a flare stack generates a work order automatically rather than waiting for a manual report to be read, interpreted, and re-entered by a planner.
What Changed for the People Doing the Work
A rollout of this scale is not purely a technology story, it changed daily operations for inspection contractors, site safety teams, and maintenance planners across the group. The reliability team that led the program was explicit that headcount reduction was never the goal, redeploying inspection expertise toward defect analysis and repair planning was.
Inspection Contractors
Rope access and scaffolding contractors were retained for the specialized tasks drones cannot perform, contact-based non-destructive testing and physical repair work, while routine visual inspection shifted to the drone program entirely.
Site Safety Teams
Fall-from-height exposure events dropped sharply across the fleet as routine visual inspection moved to ground-controlled flights, a change safety leadership described as the single most significant risk reduction the program delivered.
Maintenance Planners
Planners gained access to standardized, timestamped defect data with precise asset location, replacing the manual interpretation of handwritten inspection notes that previously introduced delay and occasional ambiguity into work order generation.
The Airspace and Compliance Layer Nobody Budgets For
A detail that rarely appears in the headline savings figures but consumed real planning time during the rollout was airspace and regulatory coordination, since eight refineries across three regions meant eight different local airspace considerations, proximity to controlled airspace at some sites, and varying site-specific permit requirements for flying near live process units. The team built a standardized pre-flight risk assessment template during the pilot phase that identified hazards such as overhead wires, RF interference from process equipment, and prevailing wind patterns, then rated likelihood and impact for each before defining go or no-go thresholds specific to that site's conditions.
This compliance groundwork, unglamorous as it is, turned out to be one of the more transferable pieces of the pilot. Every subsequent site reused the same risk assessment structure, adjusting only the site-specific hazards, which meant the safety case for flying at each new refinery took days to document rather than weeks. Facilities considering a similar rollout should treat this template work as part of the pilot deliverable from day one, not an afterthought handled once flights are already underway, since retrofitting a consistent compliance framework onto a program already running at multiple sites is considerably harder than building it once and reusing it.
Data Volume and Storage Planning Across the Fleet
Eight sites generating standardized 8K imagery on a recurring inspection cadence produces a genuinely large volume of data, and the reliability team underestimated this early on, initially treating storage as a detail to solve later rather than a design decision that affects how usable the fleet-wide defect registry actually becomes. Each flare stack or column inspection can generate hundreds of high-resolution images, and multiplied across eight sites and multiple inspection cycles per year, the raw imagery volume quickly outgrows an ad hoc storage approach built for a single pilot site.
The solution that held up at scale was structuring storage around the same defect registry and 3D asset model architecture used for reporting, so that imagery is retained in a way that stays queryable and tied to a specific asset location rather than sitting in an undifferentiated archive nobody can search efficiently later. This also turned out to matter for a use case the original business case had not fully anticipated: because every inspection produces standardized imagery at a consistent standoff distance, the platform can compare current condition against prior inspections automatically, quantifying corrosion propagation and coating breakdown over time rather than relying on an inspector's written comparison to the last report. That capability depends entirely on the underlying data being organized consistently from the first inspection onward, which is exactly why the storage and taxonomy decisions made early in the pilot mattered more than they initially appeared to.
Lessons From the Rollout Worth Carrying Into the Next Program
Not every part of the twelve month timeline went exactly as planned, and the reliability team was candid about what they would do differently starting a similar program today. These lessons are the kind of detail that rarely makes it into a summary metric but consistently shapes whether a multi-site rollout finishes on schedule.
Running the pilot in direct parallel with the existing scaffolding-based inspection, rather than replacing it immediately, was what made the internal business case credible to sites three through eight. Nobody had to take the results on faith, they could compare defect-for-defect against a method everyone already trusted.
Standardizing the defect taxonomy before the second site came online, rather than after several sites were already running independently, avoided a costly reconciliation exercise later. Retrofitting a shared taxonomy onto data already collected under inconsistent categories is considerably harder than establishing it from the outset.
Onboarding time shrank meaningfully at each successive site, not because the work got easier, but because the team stopped re-deciding settled questions, mission planning conventions, reporting formats, training structure, at every new location.
Involving site safety leadership early, rather than treating the program as purely an operations or maintenance initiative, accelerated internal buy-in considerably once the fall-exposure reduction numbers became part of the pitch at each new site.
Frequently Asked Questions
Does drone inspection completely eliminate the need for scaffolding at a refinery?
Not entirely, and this refining group retained scaffolding and rope access specifically for tasks that still require physical contact, such as certain non-destructive testing methods, coating repairs, and confined space work that a drone genuinely cannot perform. What changed is that routine visual inspection, historically the majority use case that drove most annual scaffolding spend, moved to drone-based methods almost completely. The realistic framing for most facilities is substantial reduction in scaffolding dependency for visual and thickness-mapping inspection work, not full elimination of scaffolding as an access method across every use case.
How long does it take to bring a new refinery onto a standardized drone inspection program?
In this rollout, the pilot site took roughly four months from initial scoping through validated results, since it included building the mission library and defect taxonomy from scratch alongside running the parallel comparison against scaffolding. Each subsequent site moved faster because those foundational standards already existed, with the later sites onboarding in a matter of weeks rather than months. A facility considering this today can generally expect a first-site pilot to take longer than any site that follows it, since most of the pilot's time goes toward establishing standards the rest of the fleet then simply adopts.
What happens to the inspection contractors and crews previously doing this work manually?
Most facilities running a program like this retain their inspection contractors for the specialized tasks that remain outside drone capability, contact-based testing, physical repairs, and confined space entry, while routine visual and thickness-mapping inspection shifts to the drone platform. This group specifically avoided framing the program as a contractor replacement initiative, instead redirecting contracted expertise toward defect analysis, repair prioritization, and the specialized work that still requires hands-on access, which is generally the more sustainable path for maintaining the institutional inspection knowledge a facility depends on.
How is defect data captured by drones integrated into existing maintenance systems?
Defect findings, including asset location, severity classification, and timestamped imagery, are logged into a structured registry that connects directly to the facility's maintenance management system, generating work orders automatically for findings above a defined severity threshold rather than requiring a planner to manually re-enter data from a written report. This integration is a core part of the platform setup rather than a separate project, and it is one of the details worth confirming early with any inspection platform vendor, since the value of standardized drone data depends heavily on how directly it flows into the systems your maintenance team already uses daily.
Can a smaller refining operation with only one or two sites see similar results?
Yes, and in some respects a single-site deployment is a simpler undertaking than the eight-site rollout described here, since it skips the fleet-wide standardization coordination that consumed a meaningful share of this program's twelve month timeline. A single facility with significant scaffolding spend on elevated assets, flare stacks, columns, and tank roofs, can typically expect proportionally similar savings on the assets converted to drone inspection, scaled to that site's specific scaffolding budget and asset count. Walking your facility's current inspection spend through a specific projection with an iFactory engineer is the fastest way to see what the numbers look like for your situation.
Build Your Own Fleet-Wide Rollout Plan
This program eliminated 4.2 million dollars in annual scaffolding costs by replacing eight inconsistent site playbooks with one standardized inspection platform. Book a session and iFactory will map a rollout sequence against your facility count, asset mix, and current inspection spend.