Oil and gas operators managing multiple refineries, production platforms, or midstream facilities face a fundamental visibility gap that worsens with every site added to the portfolio. Each facility generates thousands of data points per minute from SCADA, DCS, CMMS, emissions monitors, and safety systems, yet leadership teams typically access this information through fragmented reports assembled manually over days or weeks. The result is that executives make capital allocation, turnaround scheduling, and compliance decisions based on stale summaries rather than real-time operational truth across their entire asset base. An AI command center consolidates these disparate streams into a single intelligent layer that surfaces anomalies, predicts risks, and prioritizes actions across all sites simultaneously. Book a demo to see how multi-site intelligence works in practice.
One Intelligent Layer Across Every Facility You Operate
iFactory Operations Command Center ingests production, safety, emissions, maintenance, and asset risk data from all your sites and presents unified AI-driven insights to every level of your organization.
Fragmented Operations vs Unified Command Intelligence
The difference between how most multi-site operators work today and what an AI command center delivers is not incremental. It is a structural shift in how operational decisions reach the people who must act on them.
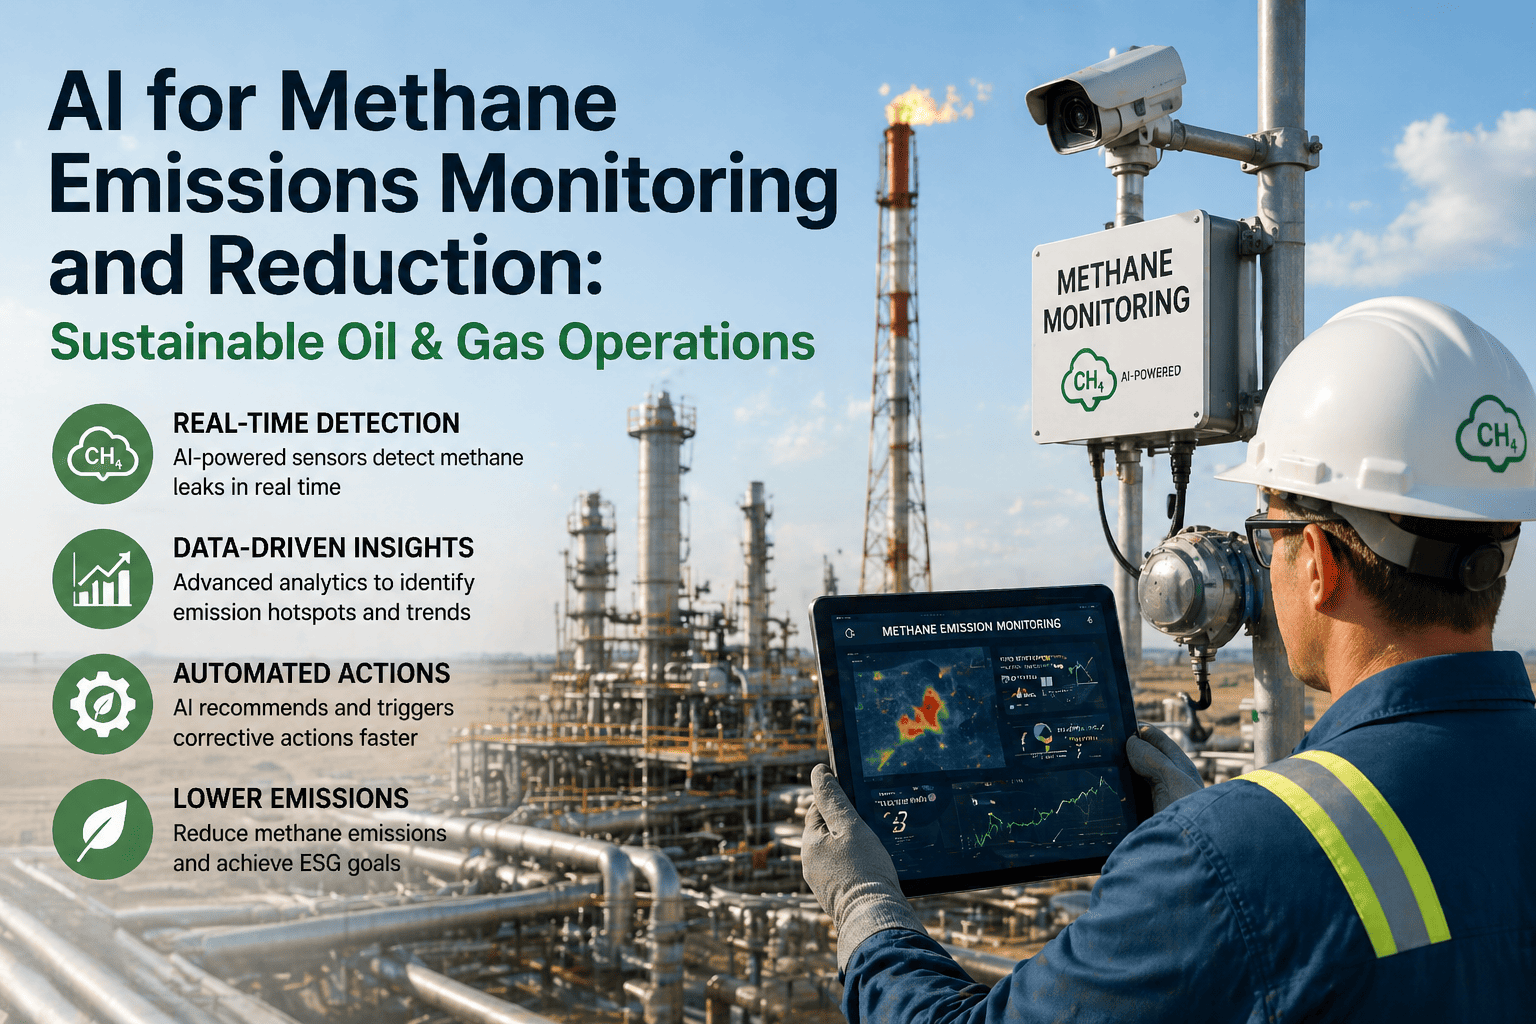
Six Operational Pillars the Command Center Monitors Continuously
Each pillar represents a critical operational domain with its own KPI hierarchy, alert logic, and AI models. Together they form a complete picture of multi-site operational health.
Multi-Site Data Flow Architecture
The command center sits above your existing site-level systems, ingesting data through secure connectors without replacing any operational infrastructure at the facility level.
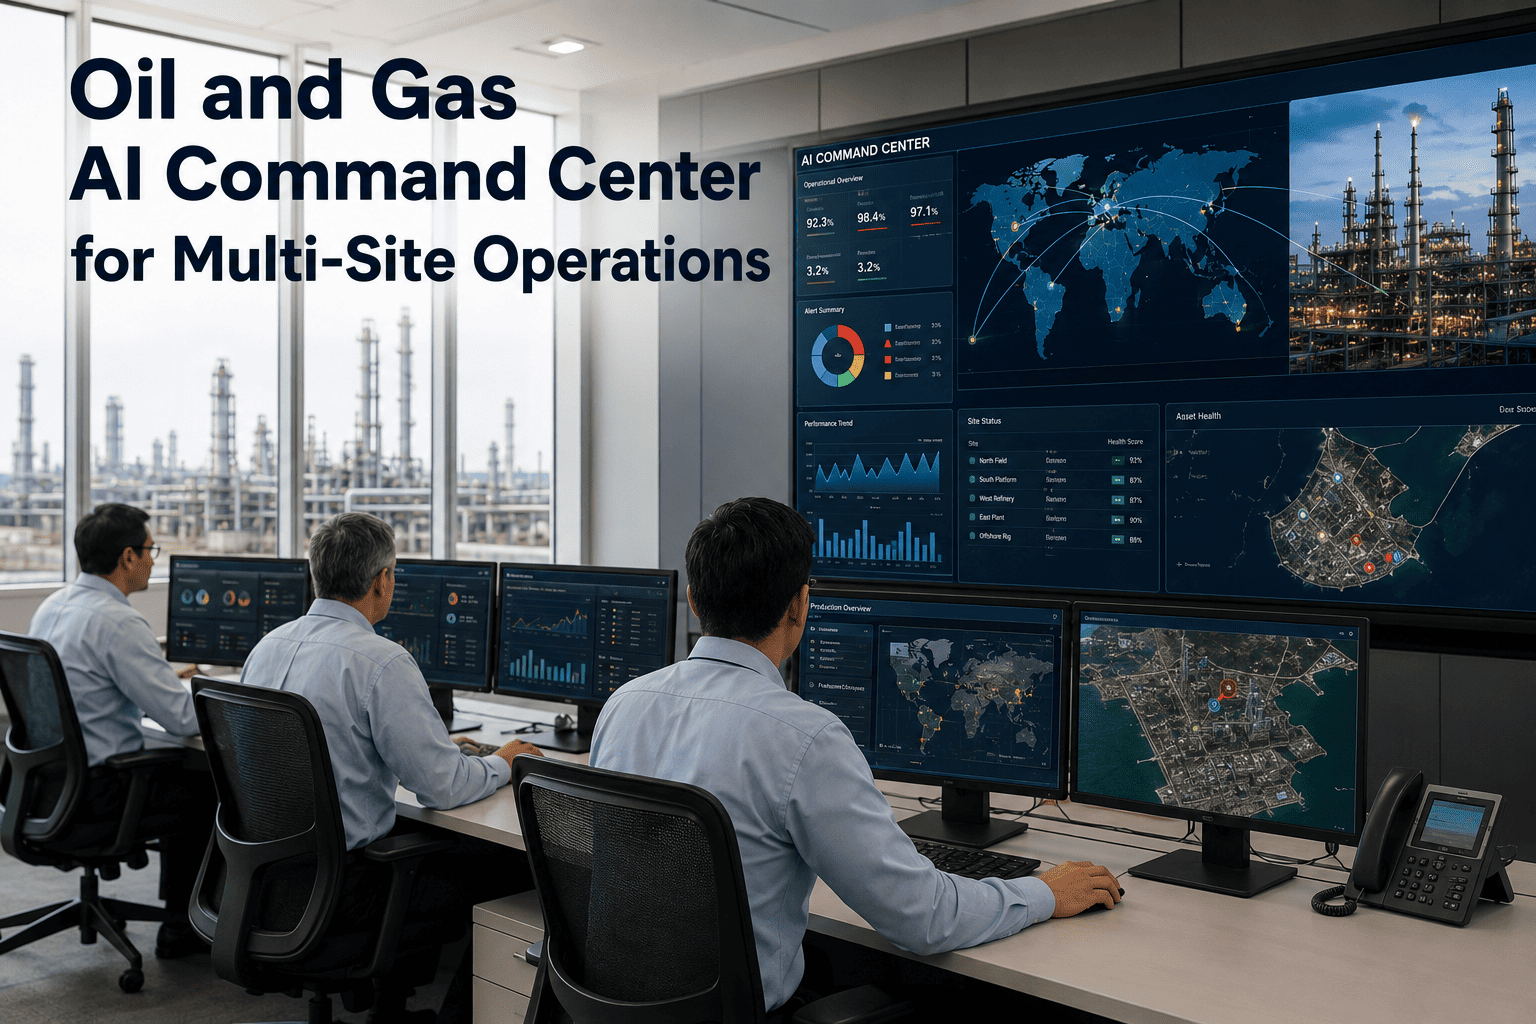
Command Center Dashboard Panel Layout
The command center interface is organized into contextual panels that change based on the user role, from high-level executive overviews to drill-down operational details for site managers.
Decision Speed: Before and After Command Center Deployment
The most measurable impact of an AI command center is the compression of time between an operational event occurring and a corrective decision being made at the appropriate management level.
| Operational Decision | Without Command Center | With AI Command Center | Speed Improvement |
|---|---|---|---|
| Production Deviation Response | 4-8 hours after shift handover report | Real-time alert within 2 minutes of threshold breach | 120x faster |
| Cross-Site Performance Gap Identification | Monthly performance review cycle | Automated daily benchmark with AI-flagged gaps | 30x faster |
| Emissions Excursion Response | 24-72 hours after regulatory report reconciliation | Instant alert with source attribution and trend projection | 500x faster |
| Capital Priority Reassessment | Quarterly capital review meetings | Continuous reprioritization as degradation data updates | 90x faster |
| Safety Pattern Recognition | Annual safety culture assessment | Continuous cross-site pattern detection with weekly summaries | 52x faster |
| Turnaround Scope Adjustment | 6-8 weeks before turnaround execution | Dynamic scope updates as AI detects new failure risks | 4x faster |
Operational Impact Across Command Center Intelligence Pillars
Oil and gas operators who have deployed centralized AI command centers report quantifiable improvements that extend beyond any single functional area.
Frequently Asked Questions
What data sources does the AI command center integrate with at each refinery or production site?
The command center connects to all major operational data systems typically present at oil and gas facilities through pre-built connectors and standard industrial protocols. On the process side, it ingests real-time data from SCADA and DCS systems via OPC-UA, MQTT, or direct database connections to historians like OSIsoft PI or Honeywell PHD. For maintenance, it connects to CMMS platforms including SAP PM, Maximo, and Infor EAM to pull work orders, failure records, and PM schedules. Emissions data comes from continuous emissions monitoring systems, LDAR database platforms, and flare metering systems. Safety data integrates with permit-to-work systems, incident management platforms, and AI vision safety monitoring feeds. Inspection data connects to RBI software like API 581 tools and inspection management platforms. All connectors use secure, read-only integration patterns that do not modify or disrupt source systems. Book a demo to review connector compatibility with your specific systems.
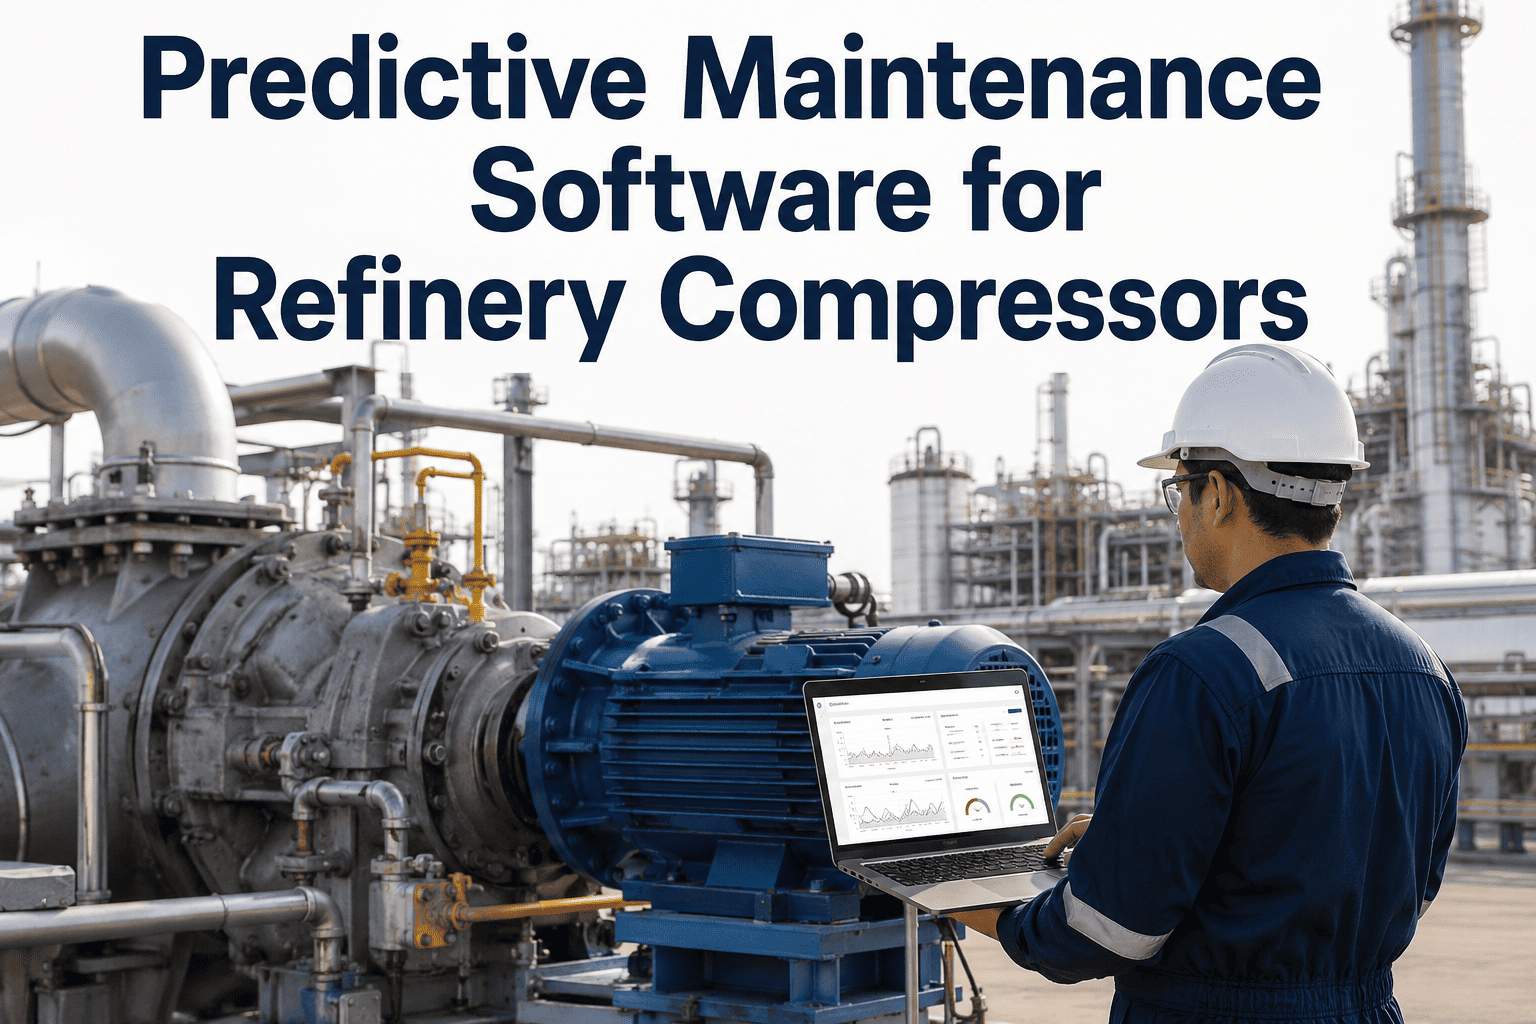
How does the command center handle data latency differences between real-time process data and delayed maintenance or inspection records?
The command center architecture is specifically designed to handle heterogeneous data latency through a time-synchronization layer that normalizes all data streams to a common temporal reference before feeding them into AI models. Real-time process data from SCADA and DCS systems arrives at sub-second intervals and is stored in a high-performance time-series store. Maintenance work orders and inspection records, which may update in batches or have human-entry delays, are aligned to their actual event timestamps rather than their system entry timestamps. The AI correlation engine uses sliding time windows that account for expected latency ranges when looking for relationships between process deviations and maintenance events. For example, if a compressor vibration increase is detected in real-time, the system simultaneously queries the CMMS for recent or upcoming maintenance activities within a configurable look-back window, even if that work order was entered hours after the physical work was performed. This prevents false correlations and missed connections that would occur with naive time-joining approaches. Contact support for technical architecture details.
Can the command center compare performance between sites that have different equipment configurations and process technologies?
Yes, this is one of the core AI capabilities that differentiates a true command center from a simple dashboard aggregation tool. Direct comparison of raw metrics between dissimilar sites is misleading because a complex conversion refinery and a simple distillation unit have fundamentally different performance baselines. The command center addresses this through normalized performance scoring where AI models learn the expected performance envelope for each site based on its specific equipment configuration, process complexity, crude slate, and operating conditions. Each site receives a performance score relative to its own achievable potential rather than against an absolute benchmark. Cross-site comparisons then compare how effectively each site is performing relative to its own potential, making it meaningful to compare a 50,000 bpd unit running at 97 percent of potential against a 200,000 bpd complex running at 91 percent of potential. The AI also identifies which sites are operating above or below their peer group within similar configuration clusters. Book a demo to see normalized benchmarking in action.
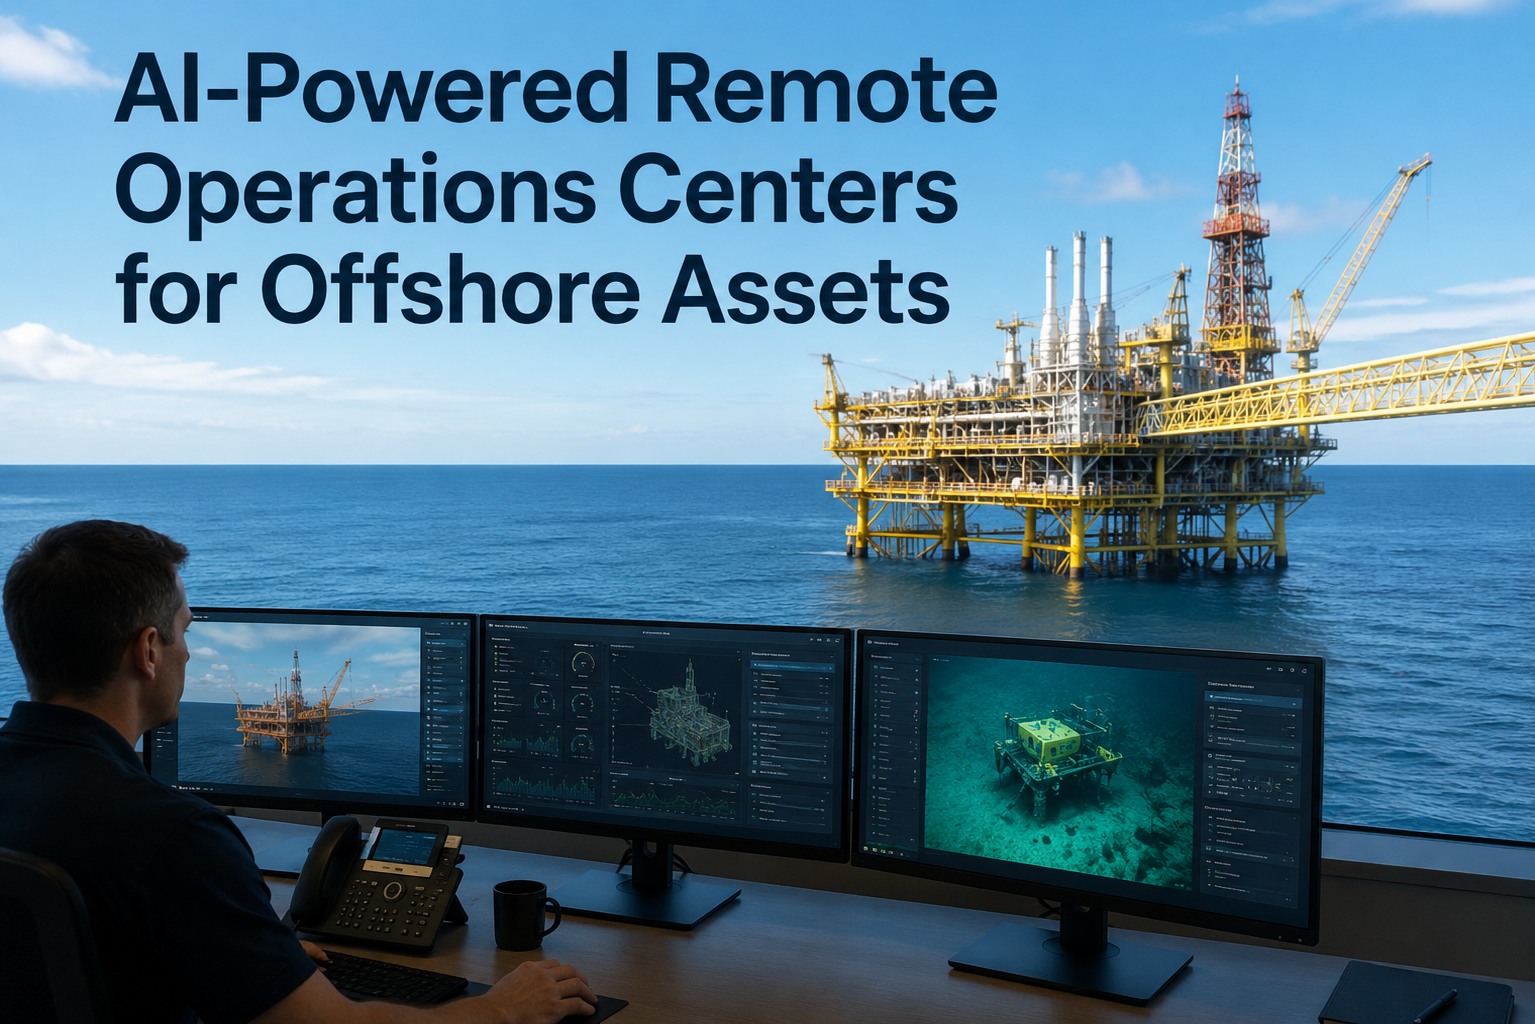
What role does the command center play during a major incident or emergency across multiple sites?
During a major incident, the command center transitions from its standard monitoring mode into an incident response intelligence role that provides leadership with a unified operational picture across all affected and unaffected sites. When an emergency is declared at any facility, the system automatically elevates that site's data priority, increases its data refresh rate to maximum, and generates a dedicated incident view that consolidates process status, safety system states, personnel accountability data, and environmental monitoring into a single screen. Simultaneously, it provides situational awareness for unaffected sites by highlighting any cascading risks such as shared pipeline dependencies, common supplier exposures, or correlated equipment failure modes that the AI has identified through its cross-site correlation models. The command center also maintains an automated incident timeline that logs every data point, alert, and human action with precise timestamps, creating a comprehensive record that serves both real-time decision support and post-incident investigation needs. Contact support to discuss incident response configurations.
How long does it take to deploy an AI command center across a portfolio of six to ten oil and gas facilities?
Deployment timeline for a multi-site AI command center depends on data readiness, IT infrastructure, and the number of sites, but a typical six to ten site deployment follows a 12 to 16 week timeline from contract signature to full operational capability. The first two weeks focus on data source identification, connector configuration, and security architecture setup. Weeks three through six involve deploying edge processing at the first two pilot sites, establishing data flows, and training initial AI models on that site data. Weeks seven through ten expand to the remaining sites in parallel waves of two to three facilities each, leveraging the connector templates and model patterns established during the pilot. Weeks eleven through fourteen are dedicated to cross-site correlation model training, user acceptance testing with each stakeholder group, and dashboard customization. The final two weeks include leadership training, runbook documentation, and a controlled go-live with dedicated support. The command center begins delivering value at the first pilot site within six weeks, not waiting for the full portfolio to come online. Book a demo to get a deployment plan tailored to your portfolio.
Your Entire Portfolio on One Screen, Updated Every Minute, Analyzed by AI
iFactory Operations Command Center connects to every system at every site and gives your leadership team the unified intelligence they need to run a multi-site operation with confidence.