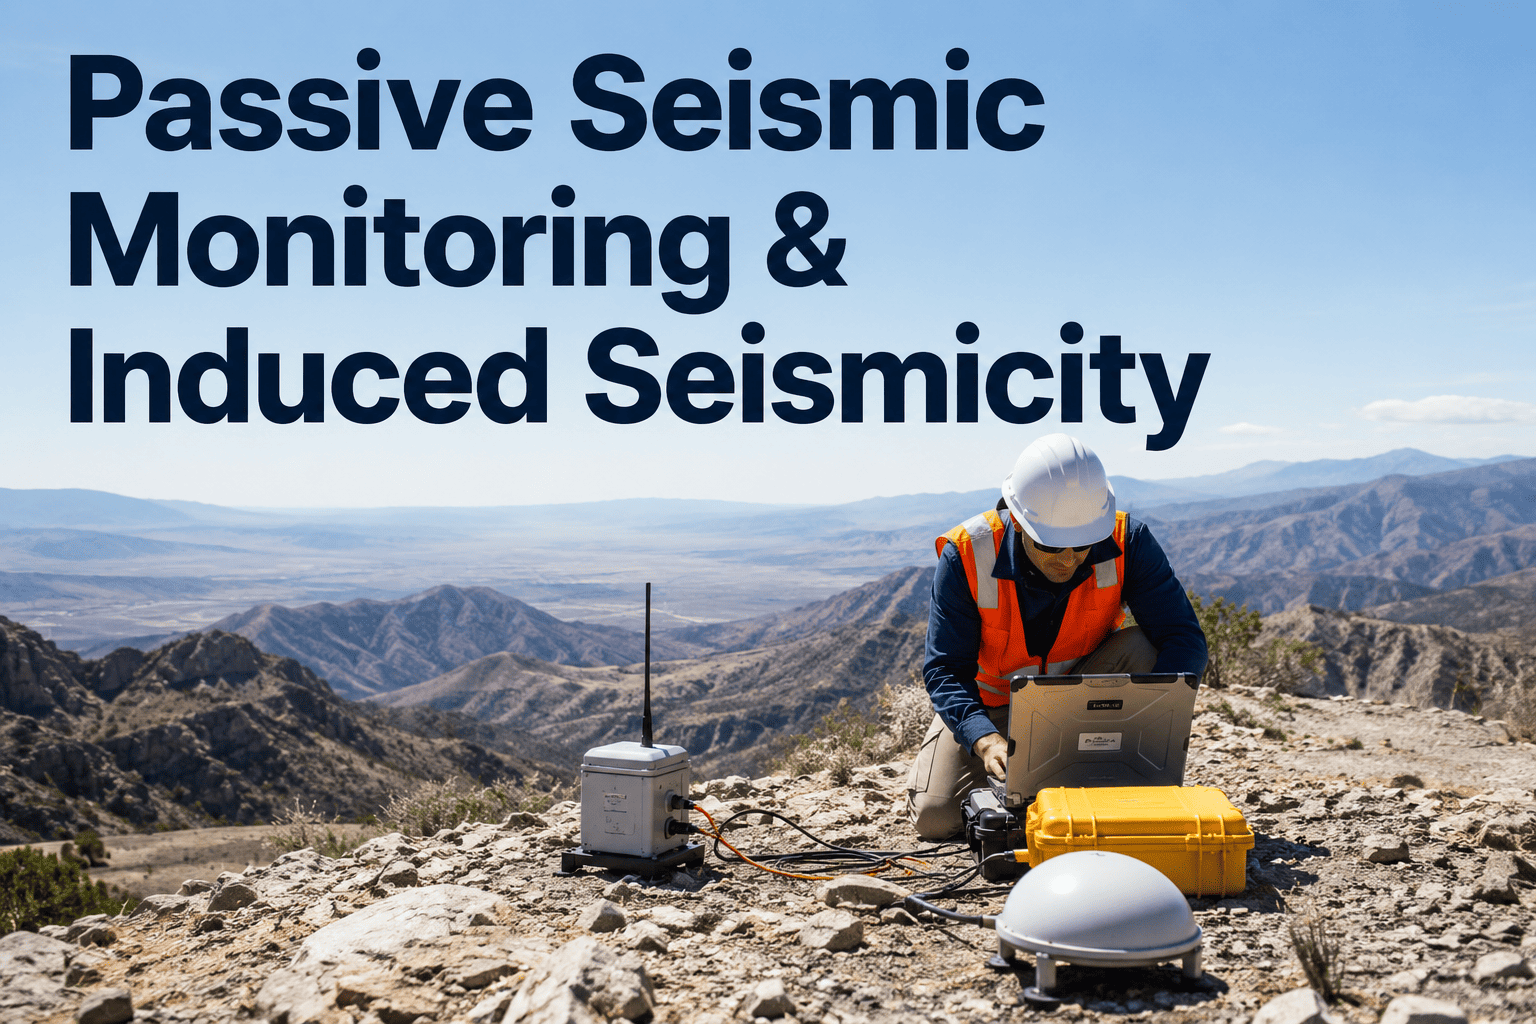
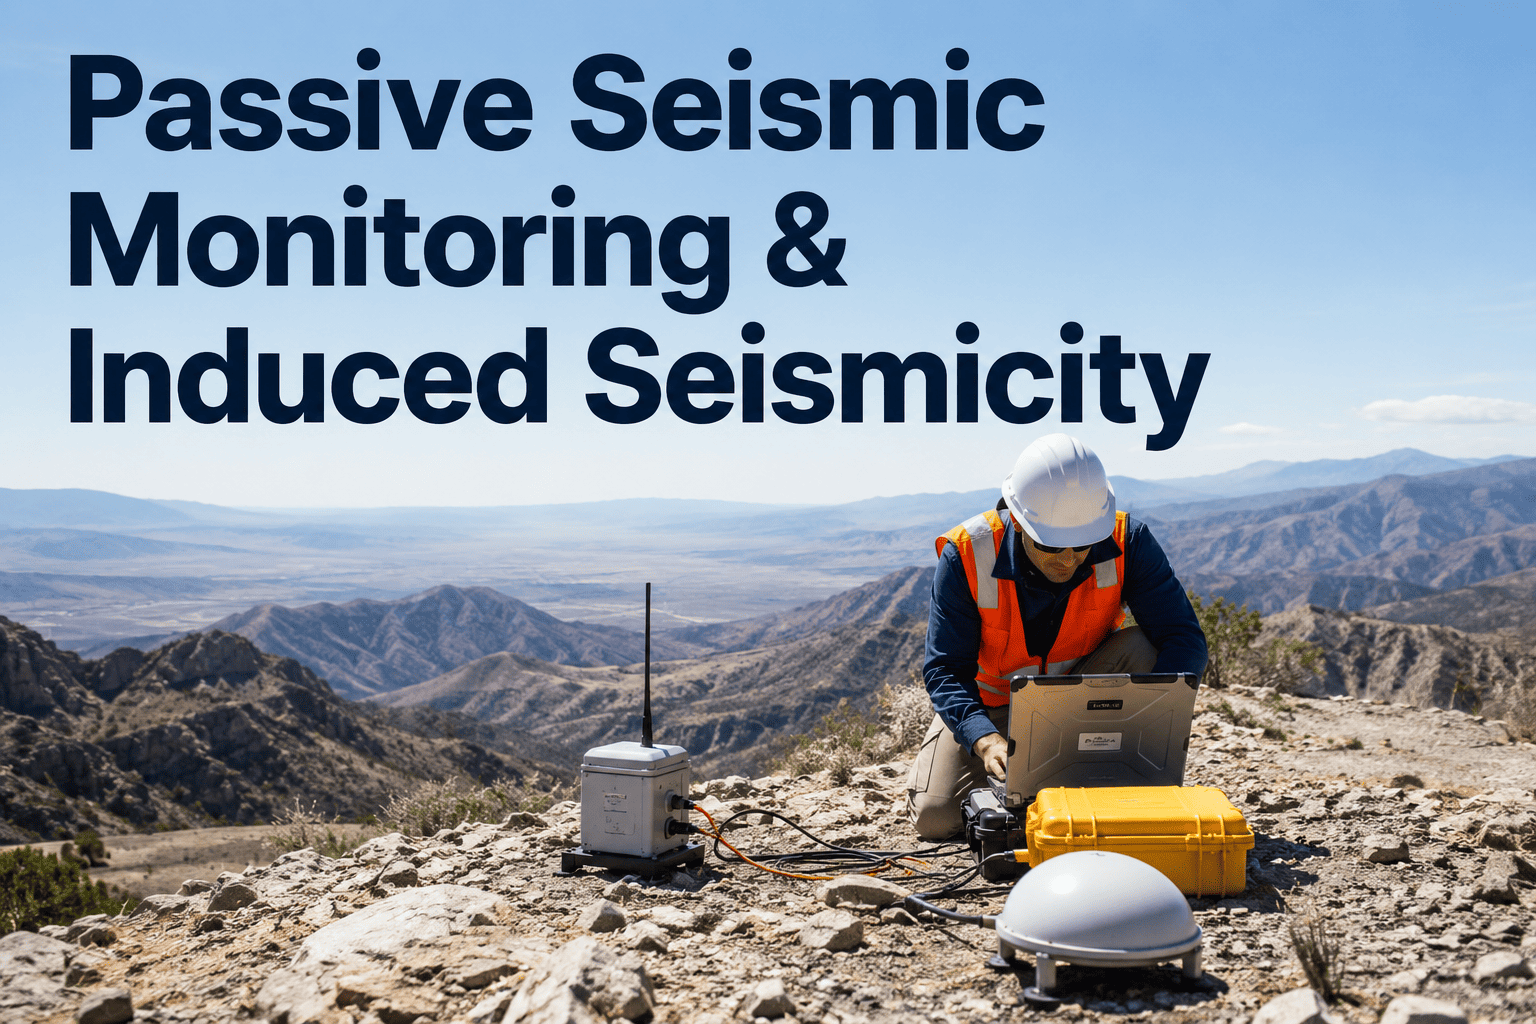
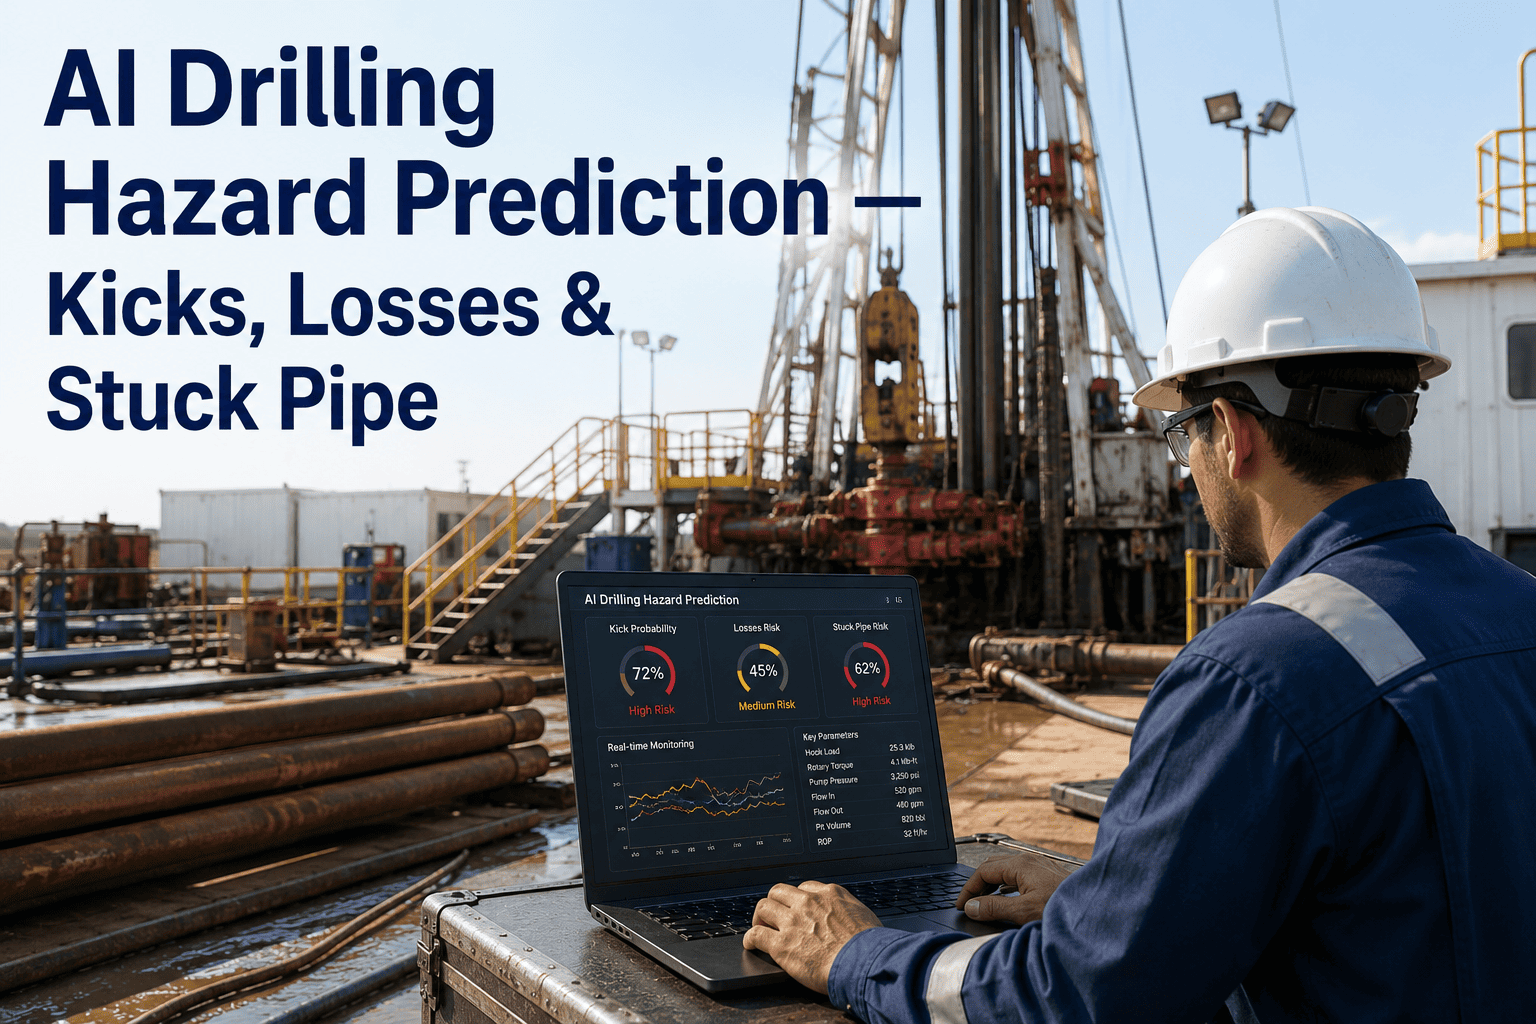
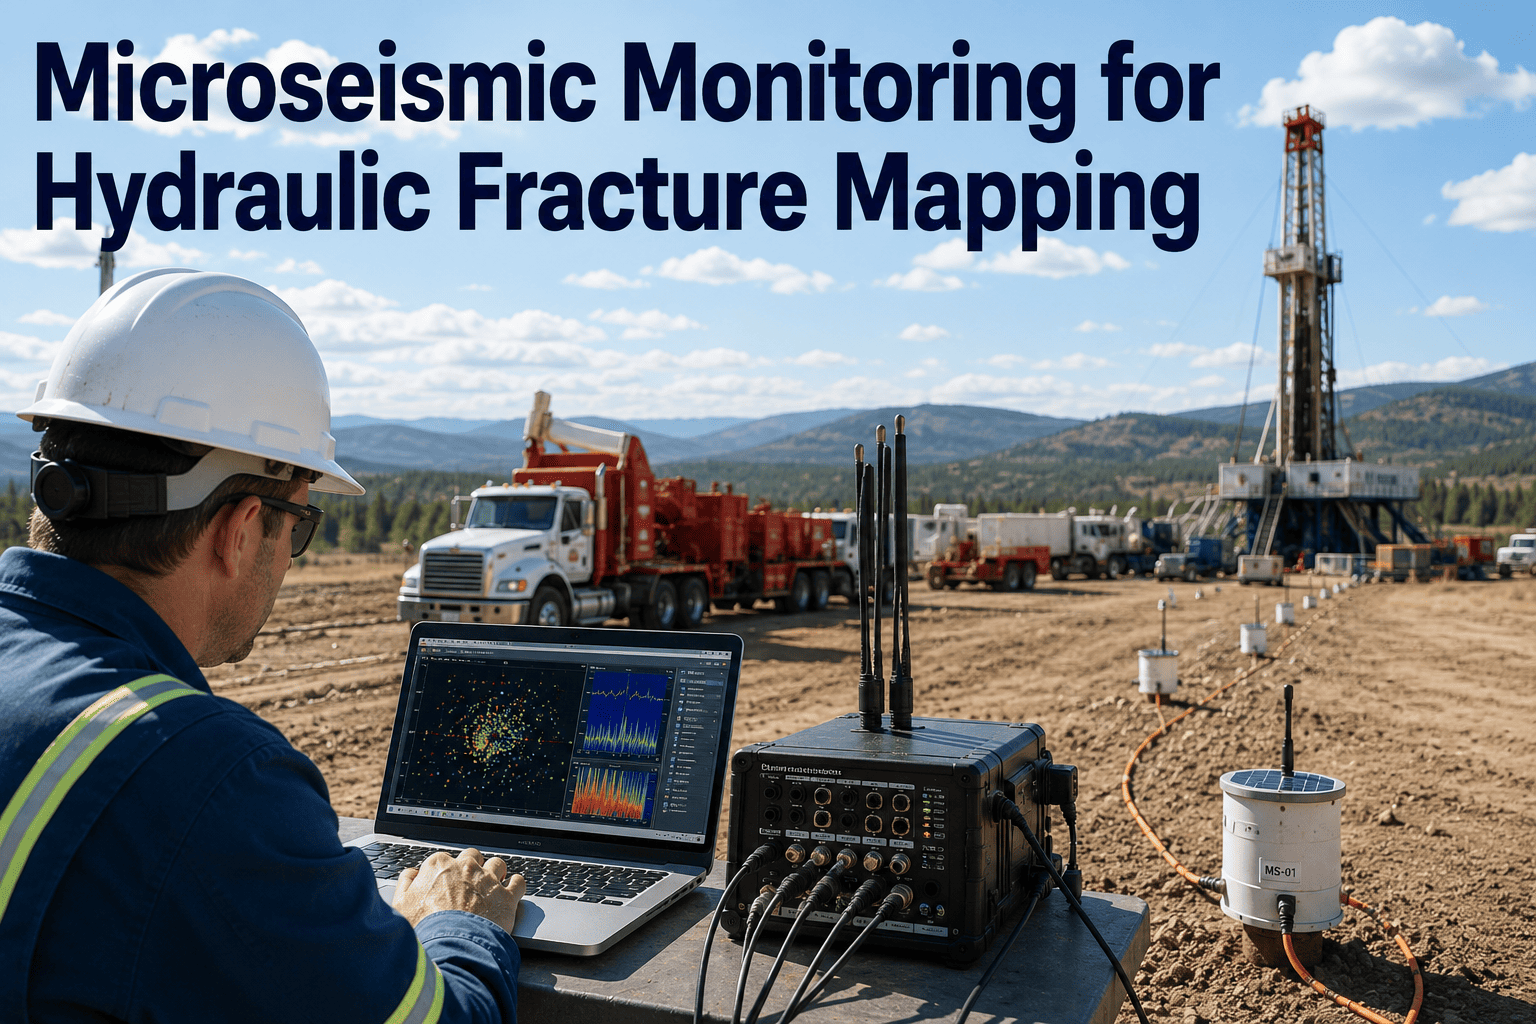
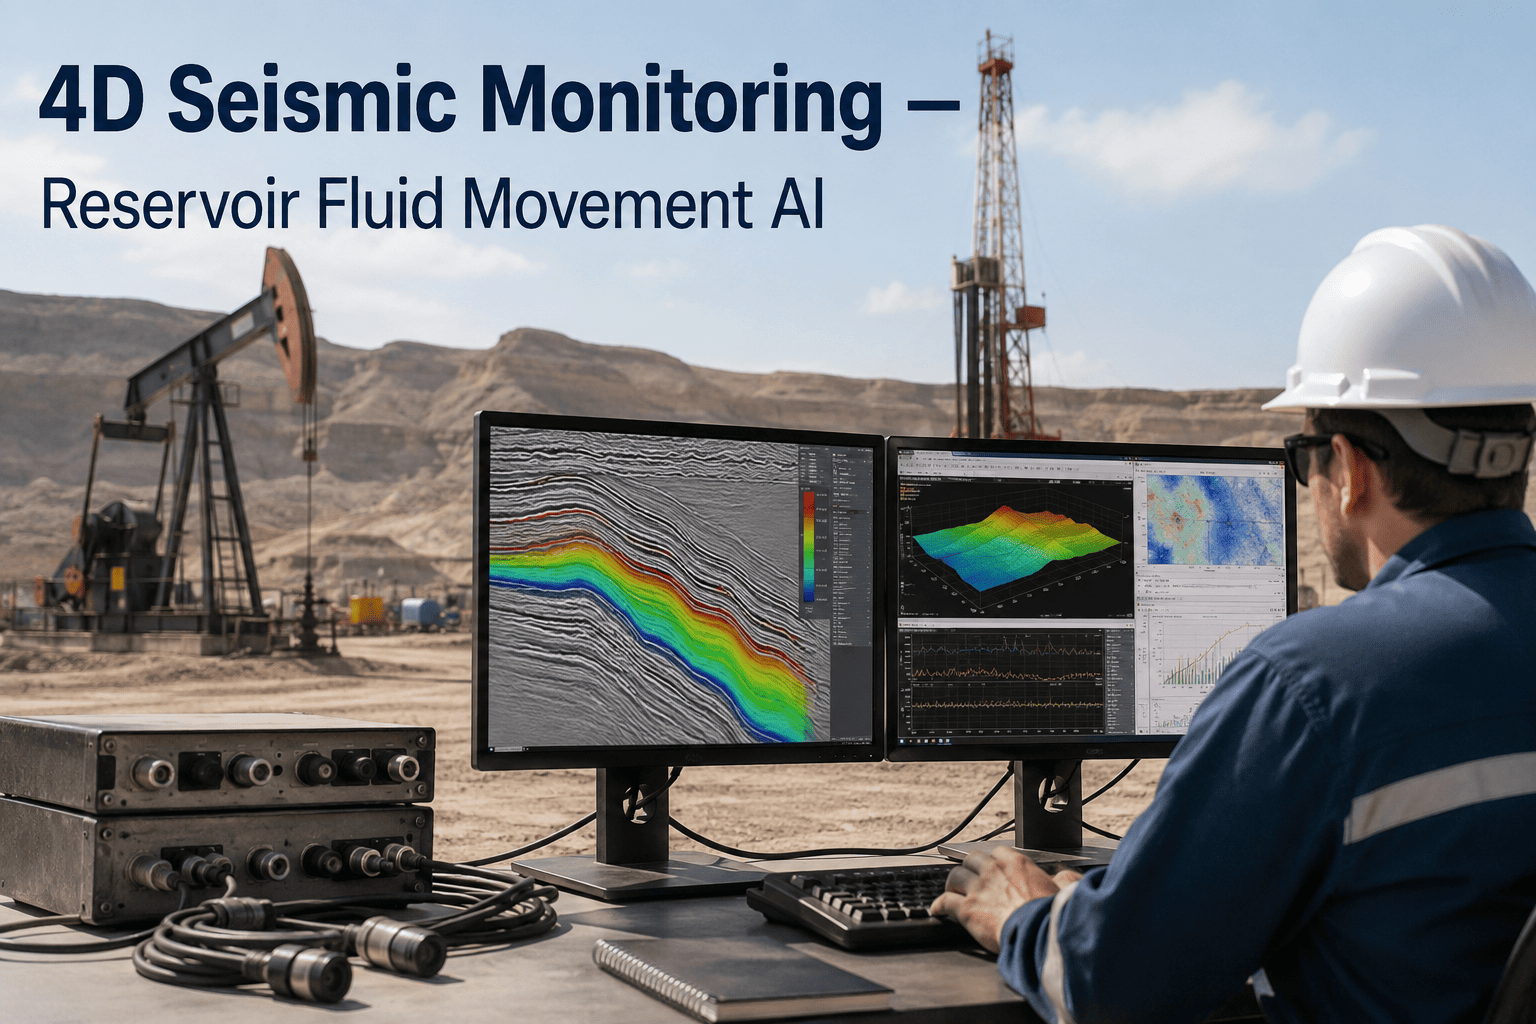
Induced seismicity from hydraulic fracturing and wastewater disposal has moved from a geophysical curiosity to the single largest operational risk facing operators in basins with active injection programs. Regulators across North America, Europe, and Asia have responded with traffic light protocols that impose immediate operational shutdowns when seismic events exceed predefined magnitude thresholds, and those thresholds are trending lower with every revised regulatory framework. The challenge is not just detecting earthquakes but predicting whether the next hour of injection will push the subsurface past a regulatory limit, which requires continuous real-time analysis of seismic waveforms, injection pressures, and geological stress states that manual monitoring cannot sustain at scale. See how AI-driven passive seismic monitoring keeps your operations compliant when you book a demo.
SEISMIC DATA ANALYTICS · OIL & GAS · INDUCED SEISMICITY MONITORING
Passive Seismic Monitoring — Stay Ahead of Traffic Light Protocols and Regulatory Shutdowns
iFactory's AI processes continuous seismic waveforms in real time, detecting, locating, and magnitude-classifying induced events the moment they occur so your operations team can act before a yellow light turns red.
GREEN
Operations proceed normally with continuous background monitoring active across all surface and downhole arrays.
AMBER
Magnitude threshold approached. Injection rates require review and potential reduction pending seismicity trend analysis.
RED
Magnitude threshold exceeded. Mandatory injection suspension or shutdown until regulator authorizes resumption.
THE REGULATORY REALITY
Why Induced Seismicity Management Is No Longer Optional for Injection Operators
The regulatory landscape for induced seismicity has shifted dramatically over the past decade, moving from voluntary best-practice guidelines to legally enforceable traffic light protocols with defined magnitude thresholds, mandatory shutdown procedures, and post-event reporting requirements. In the Permian Basin, the Alberta Basin, the Dutch Groningen field, and shale basins across China, regulators now require operators to demonstrate real-time seismic monitoring capability before approving injection permits, and the monitoring standard they expect has moved well beyond what a single seismologist watching a waveform screen can deliver. The cost of failing to meet that standard ranges from immediate operational shutdowns lasting weeks or months to permanent loss of disposal well permits and, in extreme cases, civil liability for property damage caused by induced events that exceeded the predicted magnitude range.
$2-8M
Average revenue impact of a single red-light shutdown event including lost injection volume, rig stand-by, and restart permitting delays.
-40%
Reduction in maximum permitted magnitude thresholds observed across major regulatory jurisdictions between 2015 and 2024.
<60 Sec
Industry standard for event detection-to-notification turnaround that AI monitoring achieves consistently versus hours for manual review.
3x More
Increase in the number of seismic events requiring location and magnitude classification per month compared to five years ago due to denser arrays and lower thresholds.
WHAT PASSIVE SEISMIC CAPTURES
The Seismic Signals That Traffic Light Protocols Actually Respond To
Passive seismic monitoring differs from active seismic surveying in that it listens continuously rather than transmitting energy. The signals it captures range from microseismic events below magnitude zero that indicate fluid movement along fractures to felt events above magnitude three that trigger regulatory responses and public concern. Understanding what each signal type means for operational risk is the foundation of an effective traffic light protocol.
M -1.0 to 0.0
Microseismic Stringers
Clusters of extremely small events that trace hydraulic fracture propagation in real time. These events do not register on traffic light protocols but their spatial pattern reveals whether fractures are growing as planned or diverting toward pre-existing fault structures that could become problematic at larger magnitudes.
M 0.0 to 1.5
Background Injection Events
Small events caused by pore pressure changes during routine injection. Most traffic light protocols set the green-to-amber threshold in this range. The critical metric is not individual event magnitude but the rate of events per unit time, because increasing event rates often precede larger events by hours to days.
M 1.5 to 2.5
Amber-Threshold Events
Events in this range trigger amber status under most protocols, requiring immediate operational review and potential injection rate reduction. The AI decision here is whether the event is an isolated occurrence or part of an escalating sequence that makes a red event likely within the next hours to days.
M 2.5 to 4.0+
Red-Threshold and Felt Events
Events at this magnitude trigger mandatory shutdowns under virtually all active traffic light protocols. Events above magnitude 3.0 are typically felt at surface and generate public reports, making regulatory response unavoidable regardless of whether the protocol formally requires it.
THE AI MONITORING PIPELINE
From Raw Waveform to Regulatory Notification in Under Sixty Seconds
The AI monitoring pipeline transforms continuous seismic waveform streams into classified, located, and magnitude-estimated events with automated protocol status notifications. Each stage runs continuously and in parallel across all active stations, eliminating the sequential bottlenecks that make manual monitoring too slow for real-time traffic light compliance.
1
Continuous Waveform Ingestion
Seismic streams from surface nodal arrays, downhole geophone strings, and regional network stations feed into the platform in real time through standard seedlink or websocket connections with automatic quality control and gap detection.
2
Event Detection and Triggering
Machine learning classifiers scan all active channels simultaneously, distinguishing seismic events from noise sources such as vehicle traffic, equipment vibration, and atmospheric disturbances with far fewer false triggers than traditional STA/LTA algorithms.
3
Automatic Location and Magnitude
Detected events are located using arrival time picks from all available stations with velocity model refinement, and local magnitude is computed within seconds using amplitude attenuation relationships calibrated to the local array geometry.
4
Protocol Status Evaluation
Each classified event is evaluated against the active traffic light protocol thresholds, including magnitude limits, event rate limits, and cumulative moment thresholds, to determine whether the current operational status remains green or requires an amber or red notification.
5
Automated Alerting and Reporting
Protocol status changes trigger automated alerts to the operations team and generate audit-ready event logs formatted to regulatory reporting requirements, ensuring compliance documentation is always current without manual data entry after each event.
Your Seismic Arrays Are Already Recording — AI Makes That Data Actionable in Real Time
iFactory's platform connects to your existing surface and downhole seismic arrays, processing continuous waveforms through AI detection, location, and magnitude pipelines that deliver traffic light status updates faster than any manual review cycle can match.
PREDICTION VS DETECTION
Moving From Detecting Earthquakes to Predicting Whether the Next One Crosses the Line
Detection tells you what just happened. Prediction tells you whether what just happened makes a larger event likely in the near future. The difference between those two capabilities is the difference between reacting to a red light and preventing one. AI prediction models analyze the temporal and spatial patterns of detected events, injection pressure and volume data, and known geological structures to forecast seismicity rates and maximum expected magnitudes over the next hours to days, giving operations enough lead time to adjust injection parameters before a threshold is reached.
EVENT RATE FORECASTING
AI models analyze the trend of events per hour, per day, and per injected volume to forecast whether the seismicity rate is accelerating, stabilizing, or decaying. Accelerating event rates are the most reliable short-term precursor to larger events, and detecting that acceleration hours before it produces a threshold-crossing event is the primary value of predictive monitoring.
MAXIMUM MAGNITUDE ESTIMATION
Statistical models updated in real time estimate the maximum expected magnitude for the current injection sequence based on the observed frequency-magnitude distribution. When the estimated maximum approaches the red-light threshold, operations receive an advance warning that allows pre-emptive rate reduction rather than reactive shutdown after the event occurs.
FAULT PROXIMITY ANALYSIS
When microseismic event locations begin to cluster along known or newly identified fault structures, the AI flags the spatial pattern as a risk indicator because fault reactivation produces larger magnitudes than diffuse pore-pressure-driven seismicity. This spatial analysis runs continuously as new events are located, updating the fault proximity risk assessment in real time.
INJECTION-PRESSURE CORRELATION
The platform correlates real-time injection pressure and volume data with seismicity response to identify the pressure threshold at which induced events begin to escalate. Once that threshold is identified for a specific well and formation, the AI monitors approaching pressure levels and warns operations before the critical pressure is reached.
OPERATIONAL SCENARIOS
Four Situations Where Real-Time AI Monitoring Prevents a Shutdown
These scenarios represent the most common operational contexts where the speed of AI-driven monitoring directly determines whether an operator stays in green status or triggers an amber or red response that halts injection and starts a regulatory review process.
01
Wastewater Disposal Well Near an Undocumented Fault
A disposal well operating in green status for months begins generating microseismic events that cluster along a previously unmapped fault strand. AI detects the spatial clustering pattern within minutes of the events occurring, flags the fault proximity risk, and alerts operations to begin reducing injection rates before any event reaches the amber magnitude threshold, avoiding a sequence that would have escalated to red within days based on the observed spatial pattern.
02
Multi-Stage Hydraulic Fracture Hitting a Reactivated Structure
During a multi-stage frac operation, microseismic monitoring shows events from stage twelve extending further laterally than previous stages and aligning with a known structural feature. AI classifies the spatial deviation as anomalous relative to the established fracture pattern and recommends pausing stimulation before the next stage to evaluate whether continued pumping will push events past the protocol magnitude limit.
03
Cumulative Moment Approaching Protocol Limit Over Multiple Wells
Some traffic light protocols include cumulative seismic moment limits that apply across all injection wells in a defined area, not just individual well thresholds. AI tracks the cumulative moment budget across all active wells simultaneously and warns operations when the combined total approaches the protocol limit, allowing the team to allocate the remaining moment budget to the highest-priority wells rather than hitting the limit unexpectedly.
04
Post-Shutdown Restart Risk Assessment
After a red-light shutdown, regulators require a risk assessment before allowing injection to resume. AI analysis of the seismicity catalog during the shutdown period, including event rate decay trends and maximum magnitude distribution changes, provides a quantitative basis for the restart application that demonstrates the subsurface has stabilized and that resumed injection at a specified rate is unlikely to re-trigger the threshold-crossing sequence.
TRADITIONAL VS AI MONITORING
What Changes When Seismicity Monitoring Moves From Manual Watch-Standing to AI Automation
The comparison below reflects the operational differences reported by monitoring teams after deploying AI-driven event detection and classification alongside their existing seismic arrays rather than replacing the array infrastructure itself.
| Monitoring Dimension |
Traditional Manual Watch-Standing |
AI-Enabled Passive Monitoring |
| Event Detection Latency |
Minutes to hours depending on analyst workload and shift coverage |
Seconds from waveform arrival to automated detection trigger |
| False Trigger Rate |
High, particularly with STA/LTA algorithms in noisy field environments |
Significantly reduced through machine learning noise classification |
| Location Accuracy |
Depends on analyst picking consistency and available station coverage |
Consistent automatic picking across all stations with real-time velocity model updates |
| Magnitude Estimation Speed |
Minutes to hours after event detection for manual amplitude measurement |
Seconds, computed automatically as part of the detection pipeline |
| Protocol Status Notification |
Manual evaluation and phone call to operations after analyst review |
Automated status evaluation and alert delivery within seconds of magnitude computation |
| Regulatory Reporting |
Manual compilation of event catalogs and protocol logs after each reporting period |
Continuous auto-generated audit logs formatted to jurisdictional requirements |
| Predictive Capability |
Limited to qualitative analyst judgment based on recent event patterns |
Quantitative rate and magnitude forecasts updated with every new detected event |
FREQUENTLY ASKED QUESTIONS
What Operators and Regulators Ask Before Deploying AI Seismicity Monitoring
How accurately can AI distinguish induced seismic events from natural background seismicity or industrial noise?
Machine learning classifiers trained on labeled datasets from the operating basin distinguish induced events from natural tectonic seismicity based on waveform characteristics, depth distribution, and spatial correlation with injection operations. Noise discrimination uses separate classification models trained on surface noise sources common to oilfield environments including vehicle traffic, pump vibrations, and atmospheric disturbances. The combined approach reduces false trigger rates by orders of magnitude compared to traditional energy-ratio detection algorithms while maintaining sensitivity to very small events that manual review would miss entirely.
Book a demo to see noise classification results from a basin with similar conditions to your operating area.
Does the platform replace our existing seismic array hardware or can it work with what we already have deployed?
The platform connects to existing surface nodal arrays, downhole geophone strings, and regional network stations through standard data acquisition protocols including seedlink, websocket streams, and common file-based data delivery methods. No hardware replacement or array redesign is required, though the platform can also integrate with new stations added to improve location accuracy in areas where existing coverage is sparse. The value of AI monitoring increases with array density but does not require a minimum number of stations to function.
Contact our support team to discuss integration with your current seismic array configuration.
Can the traffic light protocol thresholds be customized for different regulatory jurisdictions?
Yes. The protocol evaluation engine accepts user-defined thresholds for magnitude limits, event rate limits, cumulative moment limits, and spatial exclusion zones, allowing the platform to enforce the specific protocol requirements for each jurisdiction where an operator has active injection permits. Multiple protocol configurations can run simultaneously across different well pads or permitting areas within the same project, ensuring that each well operates under the correct regulatory framework without manual switching between rule sets.
Book a demo to see protocol configuration for your operating jurisdictions.
How far in advance can the prediction models reliably forecast a threshold-crossing event?
Prediction reliability depends on the specific precursor pattern being observed. Event rate acceleration typically provides hours to days of lead time before a larger event occurs, making it the most operationally useful precursor. Maximum magnitude estimation updates provide a continuously refined forecast that narrows the uncertainty range as more events are detected. Fault proximity warnings provide days to weeks of lead time when microseismic clustering begins to define a fault structure before reactivation produces a larger event. All predictions include confidence intervals so operations can calibrate their response to the uncertainty level.
Book a demo to see prediction lead times demonstrated on historical injection sequences.
What happens to the monitoring output during a communication outage or data gap from the seismic array?
The platform flags data gaps in real time and switches to a degraded monitoring mode that uses available stations to maintain detection capability at reduced location accuracy rather than failing silently. When the data stream resumes, the platform backfills the gap using stored waveform data if available and updates the event catalog accordingly. Protocol status during a gap defaults to the most conservative evaluation consistent with the last known seismicity state, ensuring that a data outage never results in an underestimated risk assessment.
Book a demo to see the gap-handling behavior tested against simulated outage scenarios.
The Next Induced Event Should Not Be the One That Triggers Your Red Light
iFactory's AI passive seismic monitoring connects to your existing arrays, delivering detection, location, magnitude, and traffic light protocol evaluation in seconds so your operations team can act before the regulator requires them to stop. Book a demo and see the monitoring pipeline applied to your basin conditions.