A forced outage rarely comes from nowhere. In most coal units, the same few systems cause the same trips year after year, led by boiler tube leaks. Yet many plants still answer each event as a one-off repair. This guide shows how to measure forced outage rate properly, find the causes that matter and cut FOR by moving effort, not adding it. Start with an outage review.
Reducing Forced Outage Rate (FOR) in Power Plants
Measure FOR and EFOR the GADS way, find the few systems behind most trips and shift maintenance effort to them. Catch tube leaks and pump failures early, so they become planned work instead of forced outages.
- How to calculate FOR and EFOR correctly
- Which systems cause most forced outages
- A roadmap that reallocates effort instead of adding cost
Measure FOR and EFOR the Right Way
You cannot cut a rate you calculate differently every month.
Forced outage rate compares the hours a unit was forced off with the hours it was needed. Equivalent forced outage rate also counts forced derates, converted into equivalent full-outage hours. Both follow NERC GADS definitions, so results can be compared across units and plants. Getting the event types and hours right comes before any improvement work, because a wrong baseline makes every later gain hard to prove. Our reliability team can check your calculations.
FOH ÷ (FOH + SH) × 100Forced outage hours as a share of forced and service hours(FOH + EFDH) ÷ (FOH + SH + EFDHRS) × 100Adds equivalent forced derated hours, including derates during reserve shutdownA unit that rarely trips but often runs derated can show a low FOR and a high EFOR. Track both, because a derate on a hot afternoon can cost as much as a short trip. Record each derate with its cause, just like a trip.
Where Forced Outages Really Come From
A few systems cause most of the forced hours.
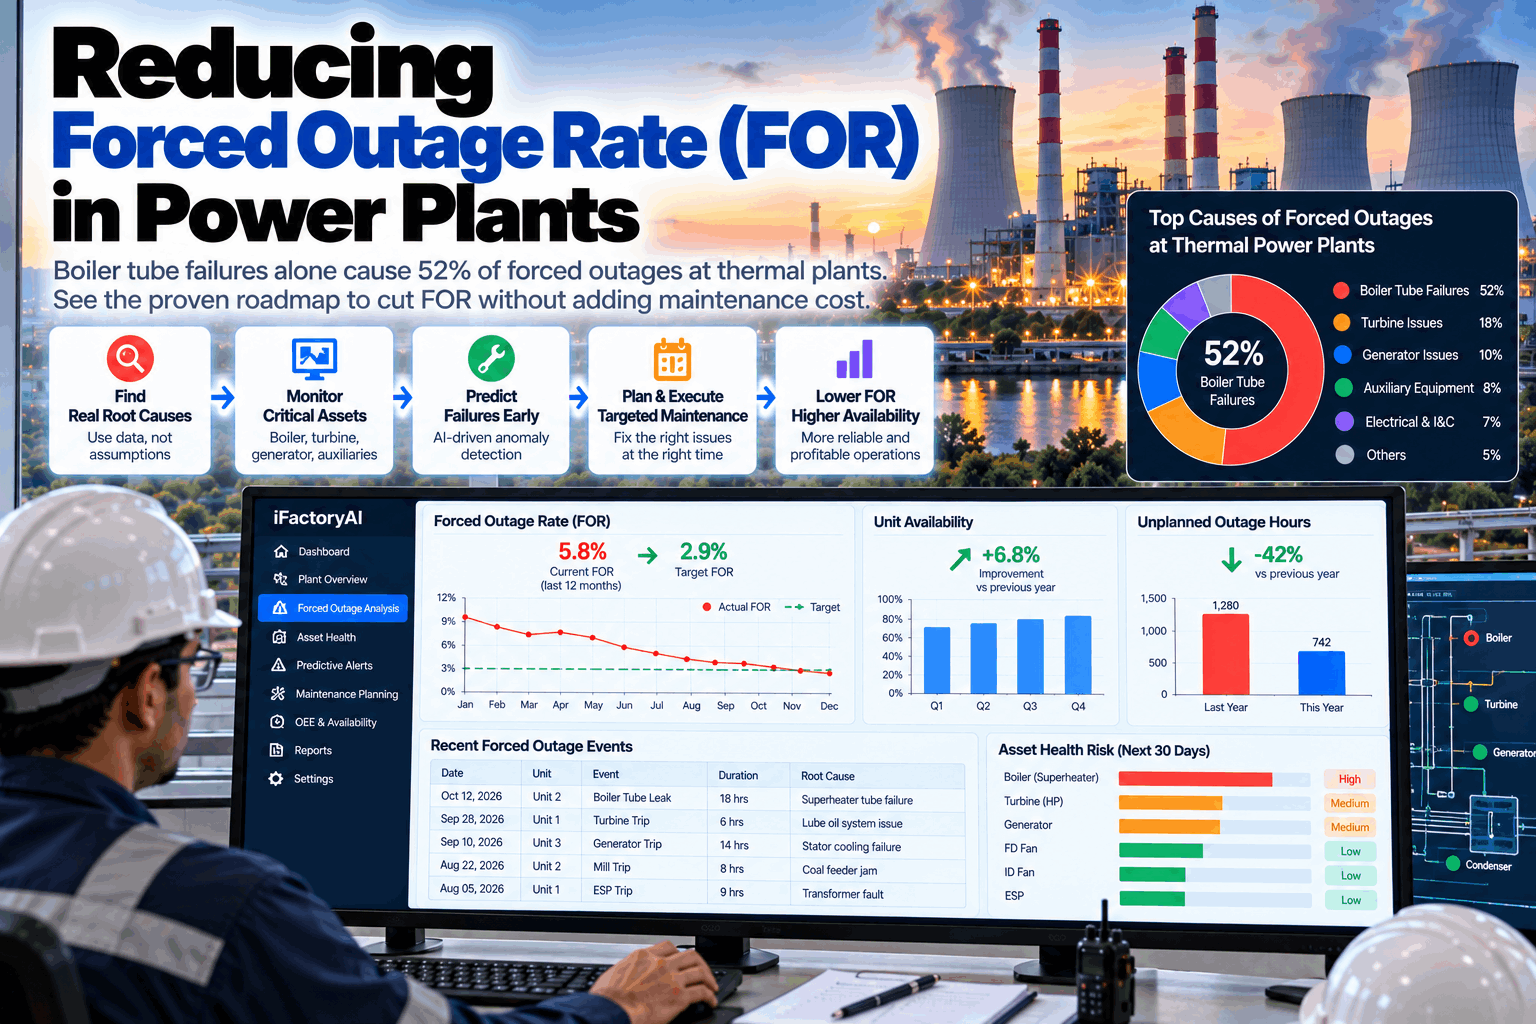
When forced outage hours are sorted by system using GADS cause codes, the pattern is usually clear. Boiler tube leaks lead in most coal units, followed by feedwater pumps, coal mills and fans. Fixing the top three systems often matters more than improving everything a little across the whole plant. Run your own sort in a cause review.
Your own split will differ. What rarely differs is the shape: a short list of systems explains most forced hours.
Two leaks in the same boiler zone within a year are not two separate problems. Group repeat events by location and cause, because repeats show where the last fix did not reach the root cause.
A Six-Step Roadmap to Lower FOR
Measure, focus, find the cause, watch the condition, fix the strategy, review.
Plants that cut FOR steadily follow the same loop. They do not chase every event equally. They pick the systems that cost the most hours, understand why those systems fail and change how they are maintained. Questions on the roadmap go to our support desk.
Measure consistently
Record every forced event with GADS type, hours and cause code.
Rank by lost hours
Sort forced and derated hours by system and pick the top three.
Find the root cause
Analyse each top event, not only the failed part, and record the mechanism.
Watch the condition
Add monitoring for the early signs of those mechanisms.
Change the strategy
Move effort from low-value routine work to the top risks.
Review every event
Check each new forced outage against the plan and adjust.
Name one engineer for each of the top three systems, with a target for forced hours and a monthly review. Ownership turns a list of causes into actions, and it stops the same failure falling between operations and maintenance.
Boiler Tubes: The Biggest Lever
Each tube failure mechanism leaves early signs.
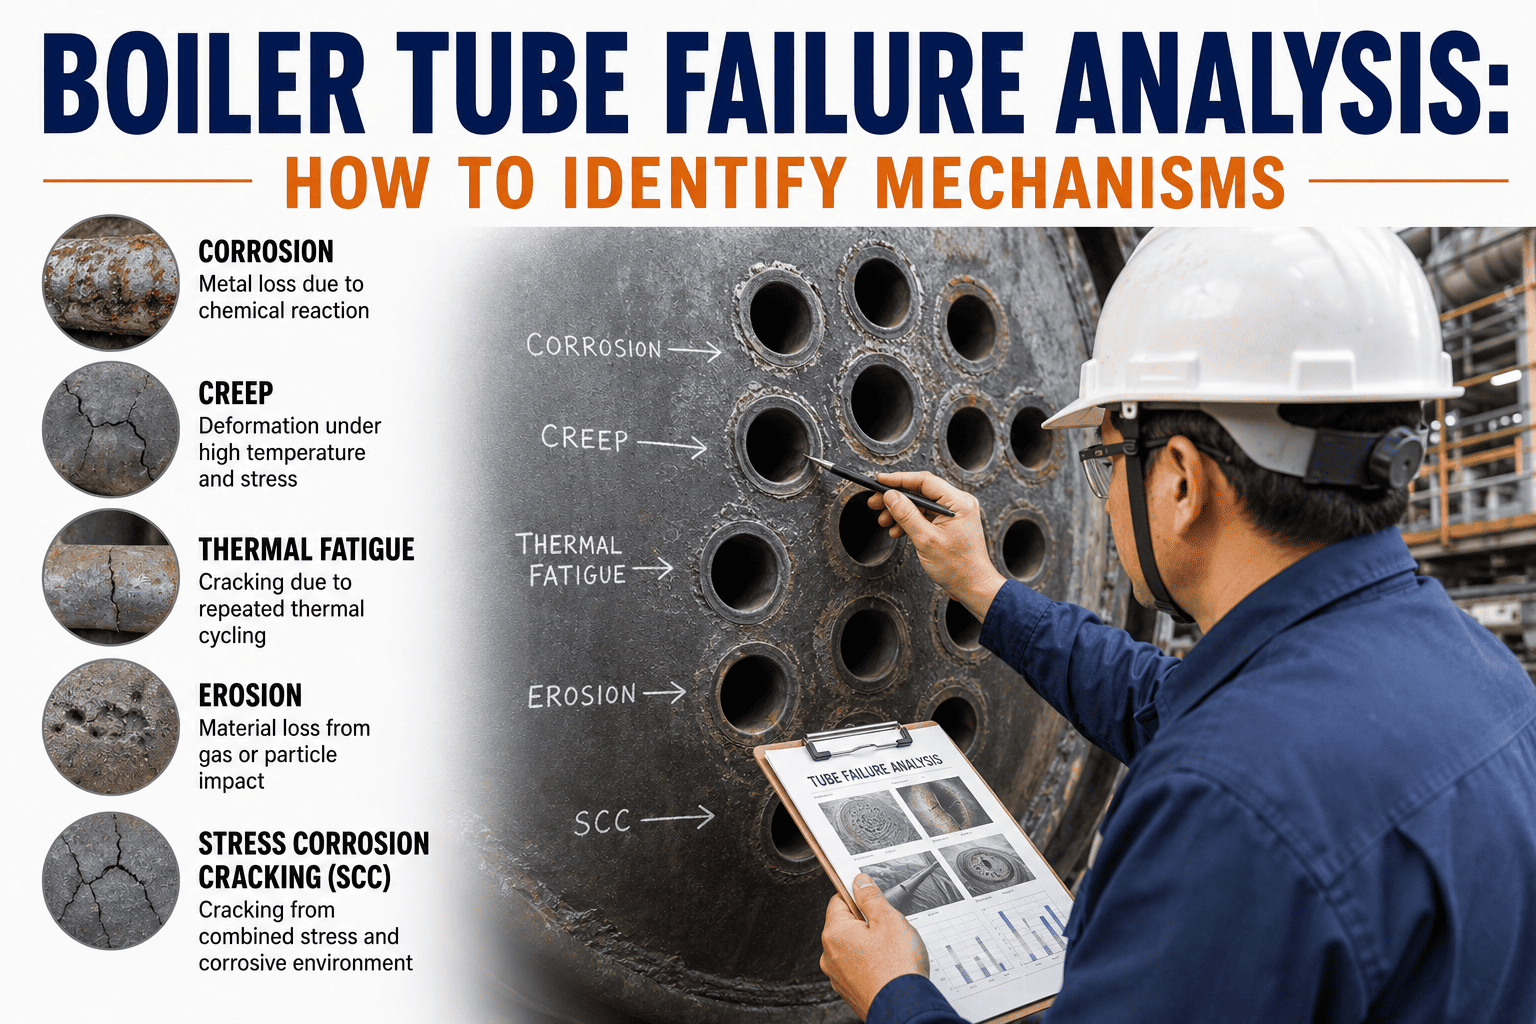
Industry surveys reported by POWER name fly ash erosion and sootblower erosion as the most likely causes of tube failures, with fatigue and weld flaws also important. Waterwalls leak most often, followed by convection and pendant superheat sections. Each mechanism has early warning signs that inspection and monitoring can catch. Plan tube monitoring in a tube review.
Every tube leak record should feed the next outage inspection plan. Map leak locations, mechanisms and thickness readings by zone, so inspectors start where the next leak is most likely.
Beyond Tubes: Pumps, Mills and Fans
The next three systems often hold the next big gain.
Once tube leaks are under control, feedwater pumps, coal mills and draft fans usually lead the list. These are rotating machines with clear early warning signs, which makes them good candidates for condition monitoring. Questions on rotating equipment go to our machinery team.
Bearings, seals and balance flow
Watch bearing temperature, vibration and balance line flow. Rising trends often show days before a trip.
Wear, fires and choking
Watch motor current, differential pressure and outlet temperature. Changes point to wear, coal quality or blockages.
Imbalance and erosion
Watch vibration and blade or damper condition. Ash build-up and erosion cause imbalance that grows over weeks.
What Lower FOR Is Worth
Each forced outage day removed returns energy sales and avoids emergency repair costs. A few points of EFOR can mean several outage days a year on a large unit.
Cut FOR Without Adding Maintenance Cost
Move effort from low-value routine work to the real risks.
Lower FOR does not have to mean a bigger maintenance budget. Most plants spend part of their effort on routine tasks that rarely find anything, while the systems that cause forced outages get the same attention as everything else. Shifting effort is often enough. Check where your effort goes in a maintenance review.
Do less of
- Time-based tasks that never find a defect
- Overhauls of equipment that is in good condition
- Repeat repairs without root cause analysis
- Inspections spread evenly across all tube zones
Do more of
- Condition monitoring on the top forced outage systems
- Targeted inspection in high-risk tube zones
- Root cause analysis on every significant event
- Planned repairs before faults force the unit off
"Bearing failed" tells you what broke. "Bearing failed because balance flow rose and the thrust load increased" tells you what to fix. Root cause records are what stop the second and third trip.
FOR Reduction Mistakes to Avoid
Most programs stall because they treat every outage the same.
The common traps are inconsistent data, effort spread too thin and fixes that treat the symptom. A short rollout plan session helps set the right focus from the start.
What works
- GADS-consistent event recording
- Focus on the top three systems by lost hours
- Root cause recorded for every significant event
- Monthly review of FOR and EFOR together
What fails
- Mixing forced and maintenance outages in the data
- Improving everything a little
- Logging the failed part instead of the cause
- Ignoring derates because the unit stayed online
When monitoring catches a fault and it is fixed in a planned window, record it as an avoided forced outage. Those records show the program is working long before the yearly FOR figure moves. Share them with operators and maintenance crews, because they are the people who made the catch.
How iFactory Helps Cut Forced Outages
Events, condition data and maintenance in one view.
iFactory connects the DCS, historian, condition monitoring and maintenance records through an on-prem AI server inside your network. It calculates FOR and EFOR consistently, ranks causes, links past events to their early signs and warns before the same pattern repeats. Fit questions go to our solutions team.
FOR and EFOR tracking
GADS-consistent rates by unit, month and cause.
Cause ranking
Forced and derated hours sorted by system, with repeats grouped.
Early warning
Patterns that came before past trips watched and flagged on live data.
Tube zone risk
Leak history, thickness and sootblower data joined by zone.
Root cause support
Event timelines built from process data to speed up analysis.
Effort rebalancing
Routine tasks with no findings flagged so time can move to top risks.
Results depend on your event records, monitoring coverage and how actions are followed through. We measure FOR, EFOR and avoided events on your own data during the pilot, rather than promising a general figure.
Turnkey AI: Delivered, Connected and Live in 6–12 Weeks
You do not build this. It arrives ready.
iFactory ships as a pre-configured NVIDIA AI server with the software pre-loaded, racked and ready. Rack it, plug in power and Ethernet, and the AI is live on your network. Our team handles cabling, network setup, DCS, SCADA, PLC, historian and maintenance system integration, operator training and 24×7 remote monitoring. Plant data stays on your network. For a scope matched to your units, request a turnkey quote.
Ship, network and data
Server installed. DCS, historian, outage records and work orders connected.
Model training and pilot
Past events analysed. Early-warning models trained on your top causes. Pilot on one unit.
Go-live and training
FOR dashboard and alerts live. Reliability teams trained. 24×7 monitoring begins.
Frequently Asked Questions
What is forced outage rate?
FOR is the share of time a unit was forced out of service when it was needed. It is calculated as forced outage hours divided by the sum of forced outage hours and service hours, times 100.
What is the difference between FOR and EFOR?
EFOR also counts forced derates, converted into equivalent full-outage hours. A unit that often runs derated can have a low FOR but a high EFOR, so tracking both gives the full picture.
What causes most forced outages in coal plants?
Boiler tube failures are the leading cause in coal-fired units, according to EPRI as reported by POWER. Fly ash and sootblower erosion are the most common tube failure mechanisms, and waterwalls leak most often.
Can FOR be reduced without spending more on maintenance?
Often, yes. Many plants spend effort on routine tasks that rarely find anything. Moving that effort to the systems behind most forced hours, with condition monitoring and targeted inspection, can cut FOR within the same budget.
How should forced outages be recorded?
Use NERC GADS event types, hours and cause codes for every event, and record the root cause, not only the failed part. Consistent records make trends and comparisons meaningful.
How quickly can FOR improve?
Early wins often come within months, as the top recurring problems are found and fixed. Yearly FOR figures take longer to move, so track avoided forced outages as a leading measure.
What is a good forced outage rate?
It depends on unit type, age, size and duty. Compare your units with their own history and with peer groups in GADS or national benchmark data, rather than one fixed number. The trend matters more than a single year.
Does cycling raise forced outage rates?
It can. Frequent starts and fast ramps add thermal fatigue, which shows up in tube attachments, headers and welds. Units that now cycle more than they were designed for often need closer inspection of those areas.
How do we start?
Start with one unit and two to three years of outage records, plus its work order history. A 6-week pilot calculates FOR and EFOR consistently, ranks causes and sets up early warnings for the top systems. To plan it, contact our team.
Turn Forced Outages Into Planned Work
In thirty minutes we look at your outage history, your top causes and how maintenance effort is spread today. You keep the notes whether or not you go further with iFactory.
- 1Three years of GADS or outage records
- 2Your top ten forced outage events and causes
- 3Boiler tube leak locations and dates
- 4Your routine maintenance task list
- 5Current condition monitoring coverage