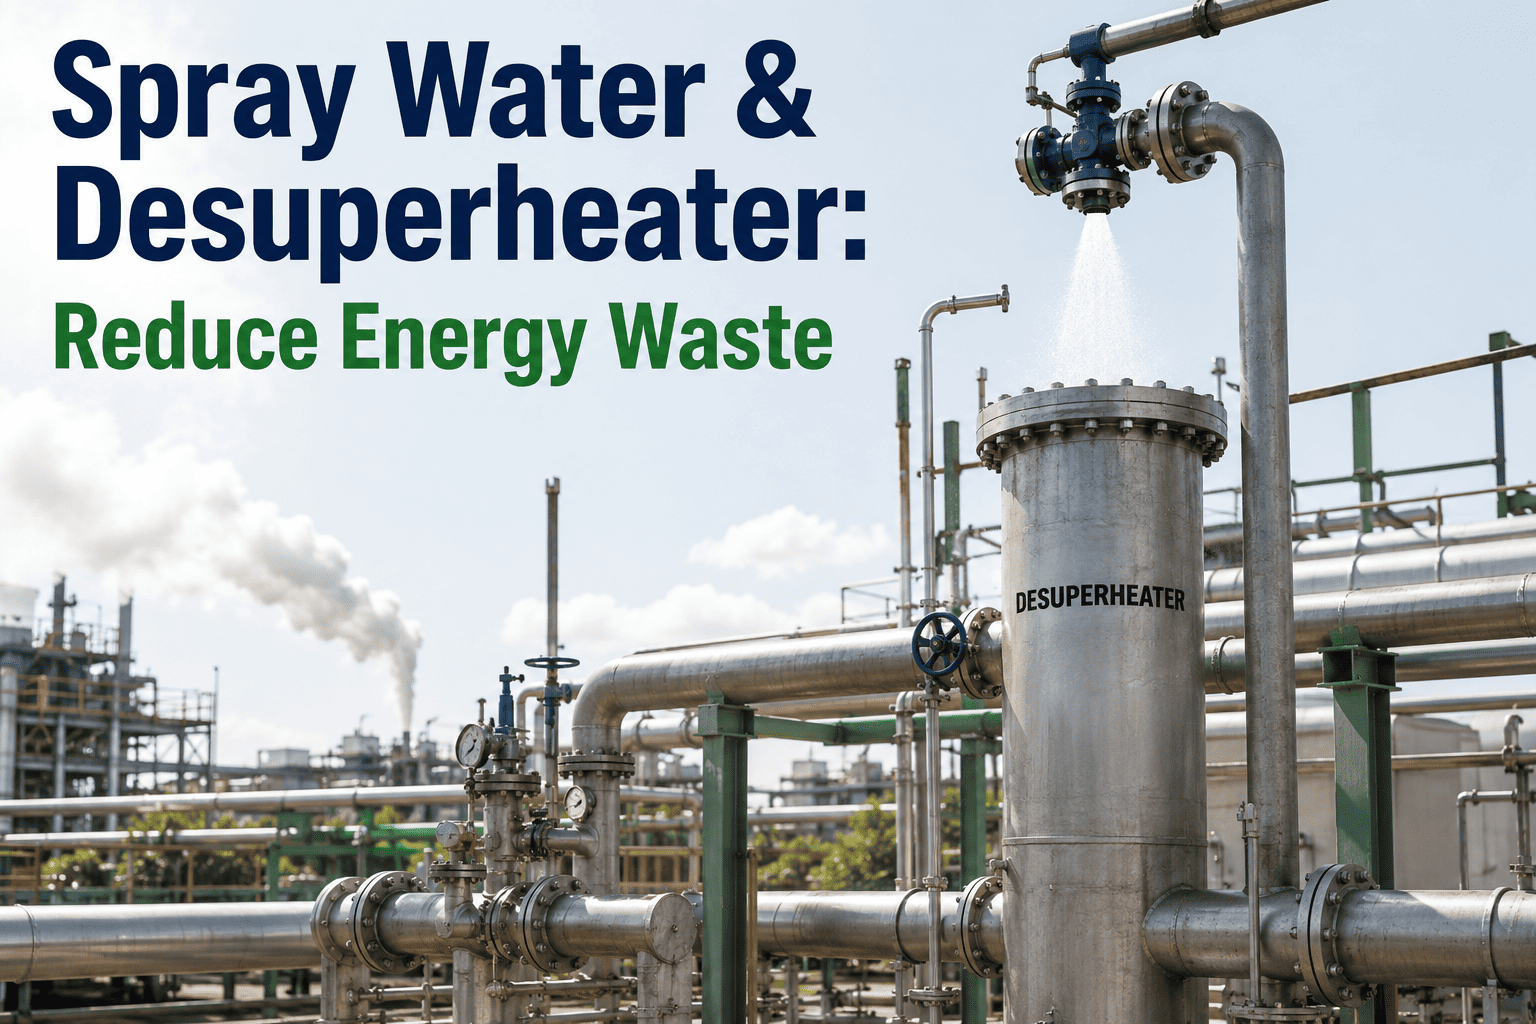
Excessive spray water injection in desuperheater and attemperator stations is one of the most overlooked sources of energy waste in steam systems operating at part-load conditions. When a power plant or process facility drops below its design capacity, the ratio of spray water to main steam flow shifts unpredictably, and temperature control loops that were tuned for baseload operation begin to oscillate, over-inject, or lag behind setpoint changes. The result is thousands of kilograms of unnecessary spray water per shift that must be reheated in downstream superheater sections, driving up fuel consumption with no corresponding increase in useful steam output. Continuous AI-driven monitoring catches this waste before it compounds across a multi-hour operating window, and you can book a demo to see how spray water optimization works on your steam system.
Spray Water and Desuperheater Control — Stop Paying to Reheat Water You Never Needed to Inject
AI process control monitors spray valve position, steam temperature gradients, and spray-to-steam flow ratios in real time, holding desuperheater outlet temperature on setpoint at every load level without the over-injection that silently wastes fuel during part-load operation.
What Unnecessary Spray Water Actually Costs a Steam Plant
The numbers below are drawn from typical observations on 200 MW to 500 MW fossil units operating between 40% and 70% load without active spray water optimization. Every kilogram of excess spray water entering the desuperheater must be evaporated and superheated again, consuming fuel that produces no additional turbine output.
How a Spray Water Desuperheater Works — and Where It Loses Efficiency at Part-Load
A spray water desuperheater reduces the temperature of superheated steam by injecting atomized feedwater directly into the steam flow. The injected water droplets absorb heat from the surrounding superheated steam, evaporate completely, and the resulting mixture exits the desuperheater at a lower temperature. In an ideal scenario, every droplet evaporates fully within the mixing section, and the outlet temperature lands precisely on the setpoint required by the turbine or process downstream. At full design load, this process is relatively stable because the steam velocity, pressure drop across the injection nozzle, and residence time in the mixing section are all at their designed values. The control loop sees a predictable relationship between spray valve position and outlet temperature change, and it can hold setpoint with minimal oscillation.
Part-load operation disrupts nearly every variable in that predictable relationship. Steam velocity through the desuperheater drops, which changes the residence time available for droplet evaporation. The pressure differential across the spray nozzle falls, which alters the atomization quality and droplet size distribution. Lower steam flow means a given volume of spray water represents a larger percentage of the total mass flow, so small absolute errors in spray flow translate into larger temperature deviations. The control loop, which was tuned for the dynamics at full load, now faces a plant with different gain, different time constant, and different dead time — and it begins to overcorrect, undercorrect, or oscillate in a pattern that averages out to a higher spray water consumption than the thermodynamic minimum for that load point.
How Spray Water Excess Scales Downward With Load
The relationship between unit load and spray water waste is not linear. Below approximately 70% of rated capacity, the control loop challenges increase sharply, and the gap between actual spray water consumption and the thermodynamic minimum widens progressively. The bar chart below represents typical observed excess spray as a percentage of main steam flow at four load points, based on data from units where the desuperheater control loop retained its original full-load tuning.
At 100% load, the control loop is operating near its tuned conditions and the excess spray is typically small, limited to the normal deadband of the PID controller. At 80% load, the gain mismatch begins to appear and the loop starts hunting, producing moderate over-injection during correction cycles. By 60% load, the transport delay between injection and measurement has increased enough that the loop is consistently late in its corrections, and sustained over-injection becomes the norm. At 40% load, the combination of poor atomization, increased transport delay, and a spray flow that is a large fraction of total steam mass creates conditions where the loop may never settle, and excess spray can reach levels that measurably affect unit heat rate.
The critical insight for process engineers is that the waste at each load level is not caused by a single variable but by the interaction of multiple degrading factors. Nozzle atomization quality degrades with lower pressure differential. Steam residence time changes with lower velocity. The PID gains that were correct at full load now produce oscillatory behavior. And the temperature sensor, which was positioned for adequate mixing distance at design flow, may now be reading a mixture that has not fully equilibrated. AI process control addresses this by monitoring all of these variables simultaneously rather than relying on the outlet temperature measurement alone to infer whether the spray rate is correct.
Five Mechanisms That Drive Unnecessary Spray Water Into Your Steam System
Understanding which mechanism is dominant on your unit is the first step toward reducing waste. Most plants have more than one active at any given time, and the relative contribution of each shifts with load, fuel quality, and equipment condition.
The spray control valve operates in a high-pressure-drop service with water that may carry entrained solids from the feedwater system. Over time, the valve seat erodes, and the valve begins to leak even when the controller commands it closed. This leakage represents spray water that enters the desuperheater without any control signal driving it, and it is invisible to the control loop because the loop only sees the outlet temperature — it does not independently measure the actual spray flow passing through the valve. The plant compensates by reducing the commanded spray flow to maintain setpoint, but the leaked portion is still wasted, and the total spray entering the system is higher than the control system records. AI monitoring detects this by comparing the commanded valve position against an independently measured spray flow signal, if available, or by tracking the relationship between valve position and temperature response over time to identify when the valve characteristic has shifted.
Desuperheater nozzles are designed to produce a specific droplet size distribution at a specific pressure differential. As the orifice edges wear, the spray pattern coarsens and the average droplet size increases. Larger droplets take longer to evaporate, which means more of the evaporation is occurring downstream of the temperature sensor. The sensor reads a temperature that is lower than the true equilibrium temperature of the mixture, the control loop reduces spray flow, and then the large droplets finish evaporating further downstream and push the temperature back up. This creates a sawtooth temperature pattern that the control loop chases with increasing spray demand. At part-load, where the pressure differential across the nozzle is already reduced, the effect of orifice wear on atomization is magnified, and the resulting temperature oscillation drives significantly more spray water consumption than the same degree of wear would cause at full load.
The thermowell protecting the outlet temperature sensor adds thermal mass to the measurement, and the response time of the sensor-thermowell combination is typically measured in seconds at full-load steam velocity. At part-load, the reduced steam velocity past the thermowell increases the effective response time, sometimes doubling it. A sensor that takes 6 seconds to respond at full load may take 12 seconds or more at 40% load, and that additional lag is directly added to the dead time of the control loop. Longer dead time forces the controller to use more conservative tuning, which means slower correction of disturbances and a wider temperature excursion before the loop brings the temperature back to setpoint. In many cases, the loop is never retuned to account for this increased dead time, and the result is either sustained oscillation or sluggish response that allows the temperature to drift far enough from setpoint to require corrective over-injection.
A PID controller tuned for stable operation at 100% load will exhibit different behavior at every other load point because the process gain, time constant, and dead time all change with steam flow. At 70% load, the process gain may have increased by 30% to 50%, making the controller aggressively overcorrect for small temperature deviations. At 50% load, the dead time may have increased enough that the derivative action in the PID is amplifying measurement noise rather than providing useful predictive correction. Most desuperheater control loops in the field operate with a single set of PID parameters across the entire load range, and those parameters are a compromise that is stable at full load but increasingly inefficient as load decreases. Gain scheduling — changing PID parameters as a function of load — can help, but it requires accurate process models at each load point that are rarely developed or maintained after commissioning.
If the spray water flow measurement used by the control loop has drifted or was never accurately calibrated, the controller is operating on incorrect information about how much water it is actually injecting. A flow meter reading 5% low means the controller commands 5% more valve opening than necessary to achieve the spray flow it believes it needs, and the actual spray entering the system is 5% higher than the recorded value. This error compounds with every other failure mode because the control loop cannot distinguish between a real temperature deviation that requires correction and a measurement error that makes it appear that more spray is needed. Flow meter drift is particularly insidious because it does not produce any obvious symptom — the outlet temperature may still be close to setpoint, but the amount of spray water consumed to achieve that temperature is higher than necessary. AI process control detects this by correlating spray valve position, differential pressure across the valve, and outlet temperature response to build an independent estimate of actual spray flow that can be compared against the flow meter reading.
Why Part-Load Operation Exposes Control Weaknesses That Full-Load Masks
A desuperheater control loop that appears to perform well at full load may be hiding fundamental weaknesses that only become apparent when operating conditions change. At full load, the steam velocity through the desuperheater is high enough to ensure rapid mixing, the pressure differential across the spray nozzle is at its design value for optimal atomization, the transport delay between injection and measurement is at its minimum, and the ratio of spray water to main steam flow is at its smallest. All of these factors work together to make the control problem easier, and a moderately well-tuned loop can deliver acceptable performance.
When the unit ramps down, every one of those favorable factors degrades simultaneously. Steam velocity drops, mixing quality decreases, atomization pressure differential falls, transport delay increases, and the spray-to-steam ratio rises. The control problem becomes fundamentally harder, and the loop must work harder to achieve the same temperature stability. A PID controller that was adequate at full load is now being asked to operate in a regime where its tuned parameters are mismatched to the actual process dynamics, and the result is a gradual increase in spray water consumption that may not be noticed because the outlet temperature is still — barely — within specification.
The economic consequence is significant because many modern generating units spend a large fraction of their operating hours at part-load due to renewable energy penetration, grid dispatch patterns, and seasonal demand variation. A unit that operates at 50% to 70% load for 4,000 hours per year may be wasting spray water during every one of those hours, and the cumulative fuel cost of that waste can reach six figures annually on a medium-sized unit. The waste is invisible on a per-shift basis because it does not cause an obvious temperature excursion or trip — it simply manifests as a slightly higher heat rate that gets buried in the overall unit performance data.
Stop Discovering Spray Water Waste in the Monthly Heat Rate Report
See how real-time spray valve and temperature gradient monitoring reduces unnecessary spray water injection before it shows up as excess fuel consumption.
Four Monitoring Layers That Reduce Spray Water Waste at Every Load Level
The platform continuously logs spray valve position, stem travel, and the differential pressure across the valve, building a real-time valve characteristic curve that shifts visibly when seat erosion or internal leakage begins. By comparing the current characteristic against the baseline established when the valve was new, the system flags degradation weeks or months before it would be detected during a scheduled maintenance outage.
Where multiple temperature measurements exist along the desuperheater outlet piping — a common configuration on larger units — the platform tracks the temperature gradient between the injection point and the final outlet sensor. A steepening gradient indicates incomplete evaporation upstream of the outlet sensor, which is a direct indicator that spray water is being injected faster than the steam flow can absorb it, a condition that worsens at part-load.
The platform calculates the actual spray-to-steam mass flow ratio in real time and compares it against the thermodynamic minimum required for the current load point and temperature reduction. A persistent excess ratio — the difference between actual and minimum spray — is quantified in kilograms per hour and translated into an estimated fuel cost, giving the operator a direct economic measure of the waste that the current control performance is producing.
Using the correlation between upstream disturbances, spray valve response time, and outlet temperature change, the platform generates a leading indicator of where the outlet temperature is heading before it actually deviates from setpoint. This prediction allows the control loop to begin correcting for a disturbance during the transport delay rather than waiting for the temperature to cross the deviation threshold, which is the fundamental advantage that reduces over-injection cycles.
Desuperheater Control Performance — Before and After AI-Assisted Monitoring
The table below summarizes typical performance metrics observed on a 350 MW unit before and after implementing AI-driven spray water process control. The before values represent the baseline established over three months of part-load operation with the original PID tuning. The after values represent the same unit over three months with AI monitoring active, using the same spray valve and desuperheater hardware.
| Performance Metric | Before AI Control | After AI Control |
|---|---|---|
| Spray-to-steam ratio at 50% load | 7.8% | 3.4% |
| Outlet temperature oscillation amplitude | Plus or minus 11 degrees C | Plus or minus 3 degrees C |
| Control loop correction cycles per hour | 18 | 5 |
| Excess spray water per shift at 50% load | 1,600 kg | 280 kg |
| Estimated annual fuel cost of spray waste | $142,000 | $24,000 |
| Time to detect spray valve degradation | Next scheduled outage | 2 to 3 weeks after onset |
The reduction in correction cycles is particularly important because each correction cycle represents a period where the control loop overshoots the setpoint in one direction and then overcorrects in the other, and spray water is wasted during both the overshoot and the overcorrection. Reducing the cycle count from 18 per hour to 5 per hour means the loop is spending far less time fighting its own corrections and far more time holding steady at the minimum spray rate required for the current conditions.
Questions Steam Plant Engineers Ask About AI Spray Water Optimization
Hold Spray Water Consumption at the Thermodynamic Minimum at Every Load Point
Continuous spray valve, temperature gradient, and flow ratio monitoring — catching unnecessary spray water injection before it becomes excess fuel consumption on your next monthly heat rate report.