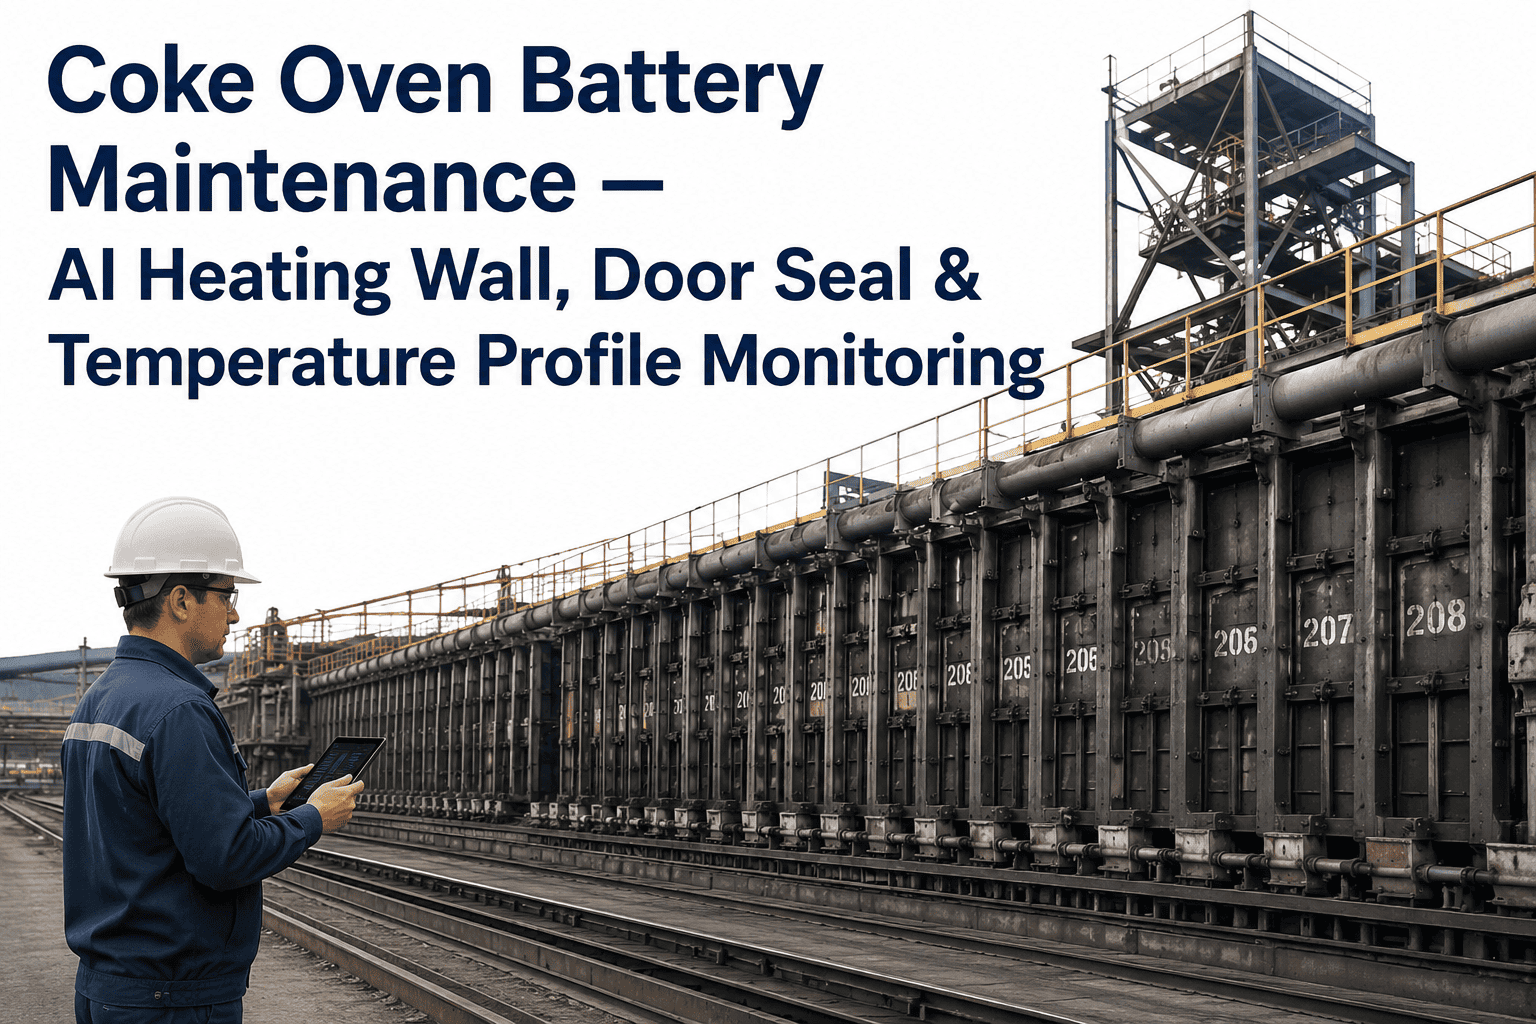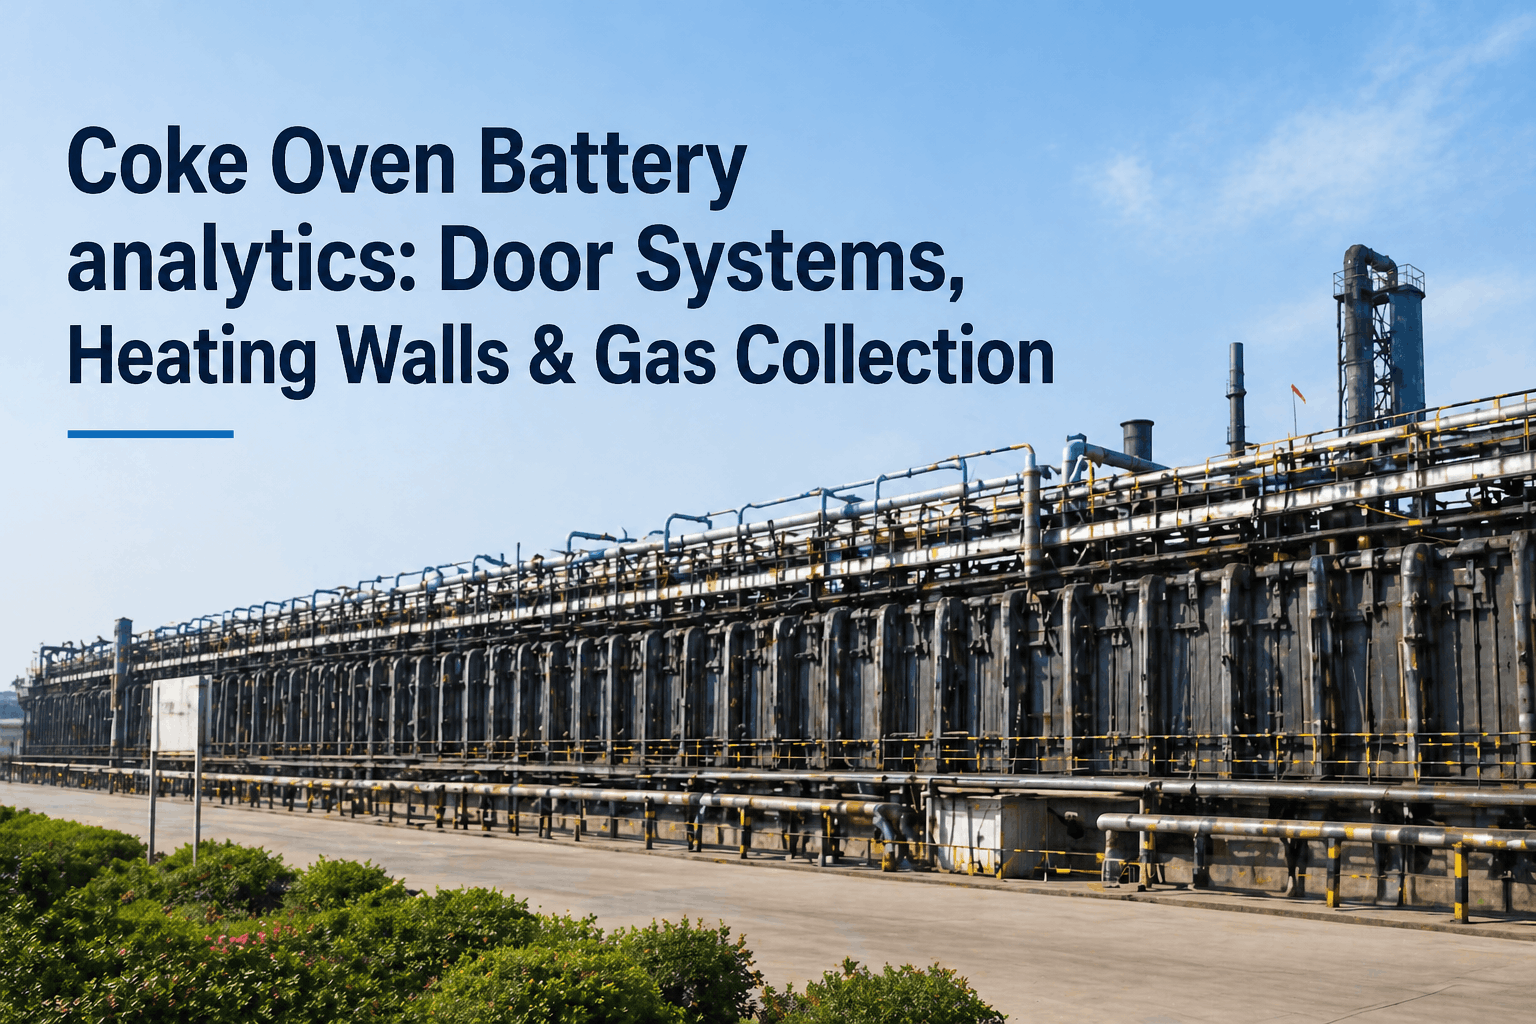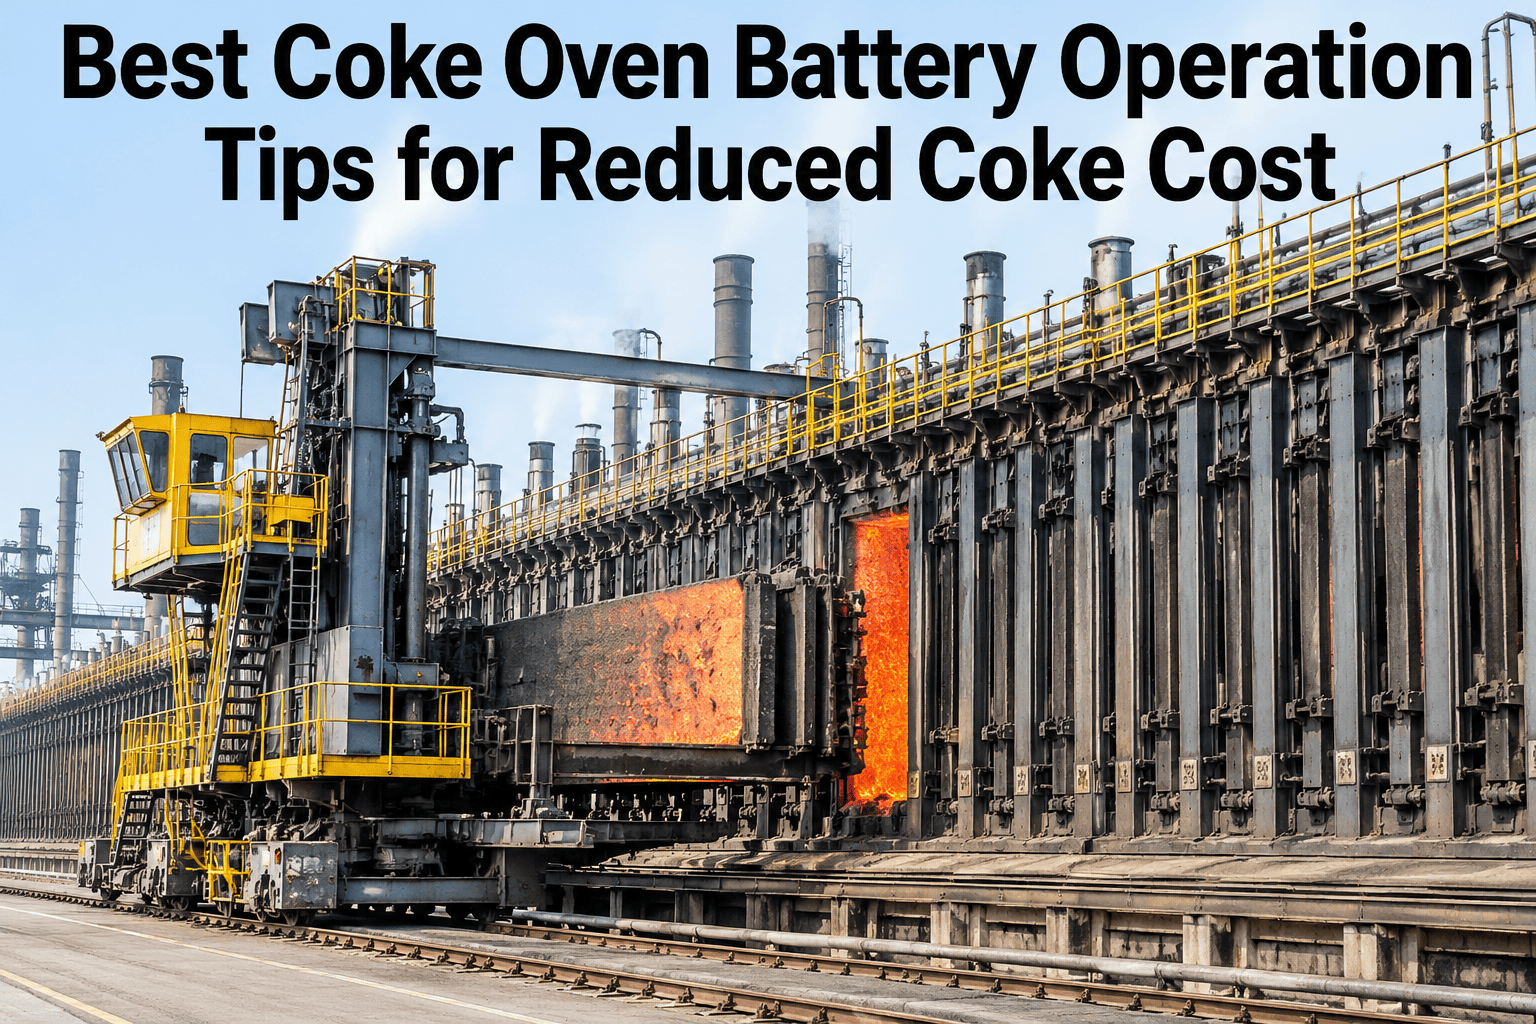
A coke oven battery can run for decades, and most of the coke cost variation a plant sees from month to month traces back to three operating choices: how evenly the ovens are heated, how tightly the pushing schedule holds to plan, and whether the charging method matches what the battery was built for. None of these require new equipment to fix, but all three are easy to drift on without a live view of oven-by-oven performance. See how iFactory AI tracks heating uniformity and pushing schedule adherence across your battery.
Cut Coke Cost by Fixing What the Battery Already Tells You
iFactory AI tracks oven-by-oven heating uniformity, pushing schedule adherence, and charging practice so coke quality and cost stay predictable, campaign after campaign.
Heating Uniformity Is the Hidden Cost Driver
A battery with a 40°C spread between its hottest and coldest flues will never produce consistent coke, no matter how well the pushing schedule is managed.
Cold ovens undercook, producing weaker coke that breaks down in the blast furnace stack, while overheated ovens burn excess fuel without improving coke quality further.
Pushing Schedule Adherence
Coking time is a chemistry constraint, not a scheduling convenience. Pushing early or late both cost money in different ways.
| Schedule Deviation | Effect on Coke | Effect on Battery | Typical Cause |
|---|---|---|---|
| Pushed early | Undercooked, higher fines | Minimal wear impact | Pusher car scheduling pressure |
| Pushed late | Over-coked, wasted fuel | Increased wall stress | Downstream handling delay |
| On schedule | Consistent strength | Normal wear rate | Coordinated pusher and quench car timing |
See Your Battery's Flue Spread and Push Timing
Book a 30-minute session and iFactory AI will walk through oven-by-oven performance on your own battery.
Stamped vs. Top-Charged: Practice Changes the Playbook
The two charging methods respond differently to the same operating adjustments, so one playbook does not fit both.
Where the Coke Cost Actually Goes
A composite breakdown of controllable coke cost drivers across a typical battery campaign.
Four Levers Worth Watching Daily
These four signals explain most of the coke cost variation plants see month to month.
Flue Temperature Spread
The gap between hottest and coldest flue, tracked daily rather than at periodic rounds.
Push Timing Variance
How far actual push time drifts from the coking time target, oven by oven.
Coal Blend Consistency
Blend ratio variance against the target recipe for the charge in progress.
Coke Quality Carryover
How oven-level variation shows up in CSR and CRI results downstream.
A Composite Campaign View
Twelve ovens tracked across a campaign, before and after flue correction. Darker cells show ovens running outside target spread.
Rolling It Out on the Battery
iFactory AI arrives turnkey, built to read flue temperature, pusher car, and quench car data without a drawn-out integration project.
Frequently Asked Questions
How does this help without rebuilding the battery?
Most of the gain comes from catching flue drift and schedule slippage earlier, not from equipment changes. Correcting a cold oven within days instead of weeks is an operating fix, not a capital one. Support can walk through typical gains for a battery your age and design.
Does it work for both stamp-charged and top-charged batteries?
Yes, the tracking adapts to which levers matter most for your charging method, since stamp-charged and top-charged batteries respond differently to blend and heating changes. See the difference on a live walkthrough for your battery type.
What data do we need to get started?
Flue temperature readings, pusher and quench car timestamps, and coal blend records are the core inputs. Most plants already hold these in existing battery control systems, and the first weeks of rollout focus on connecting them by oven.
How quickly does a flue outlier get flagged?
Flue spread is checked continuously against the target band, so a drifting oven is flagged well before it would surface in a periodic manual round. The alert names the specific oven and flue location.
Does this connect to our coke quality reporting?
Oven-level uniformity and schedule data link to downstream CSR and CRI results, so a quality shift can be traced back to the specific oven and shift that caused it. Ask support how this rolls into quality reporting for your lab system.
Hold Every Oven to the Same Standard
iFactory AI tracks heating uniformity, push timing, and charging practice oven by oven, so coke cost stays predictable. Book a walkthrough on your own battery.