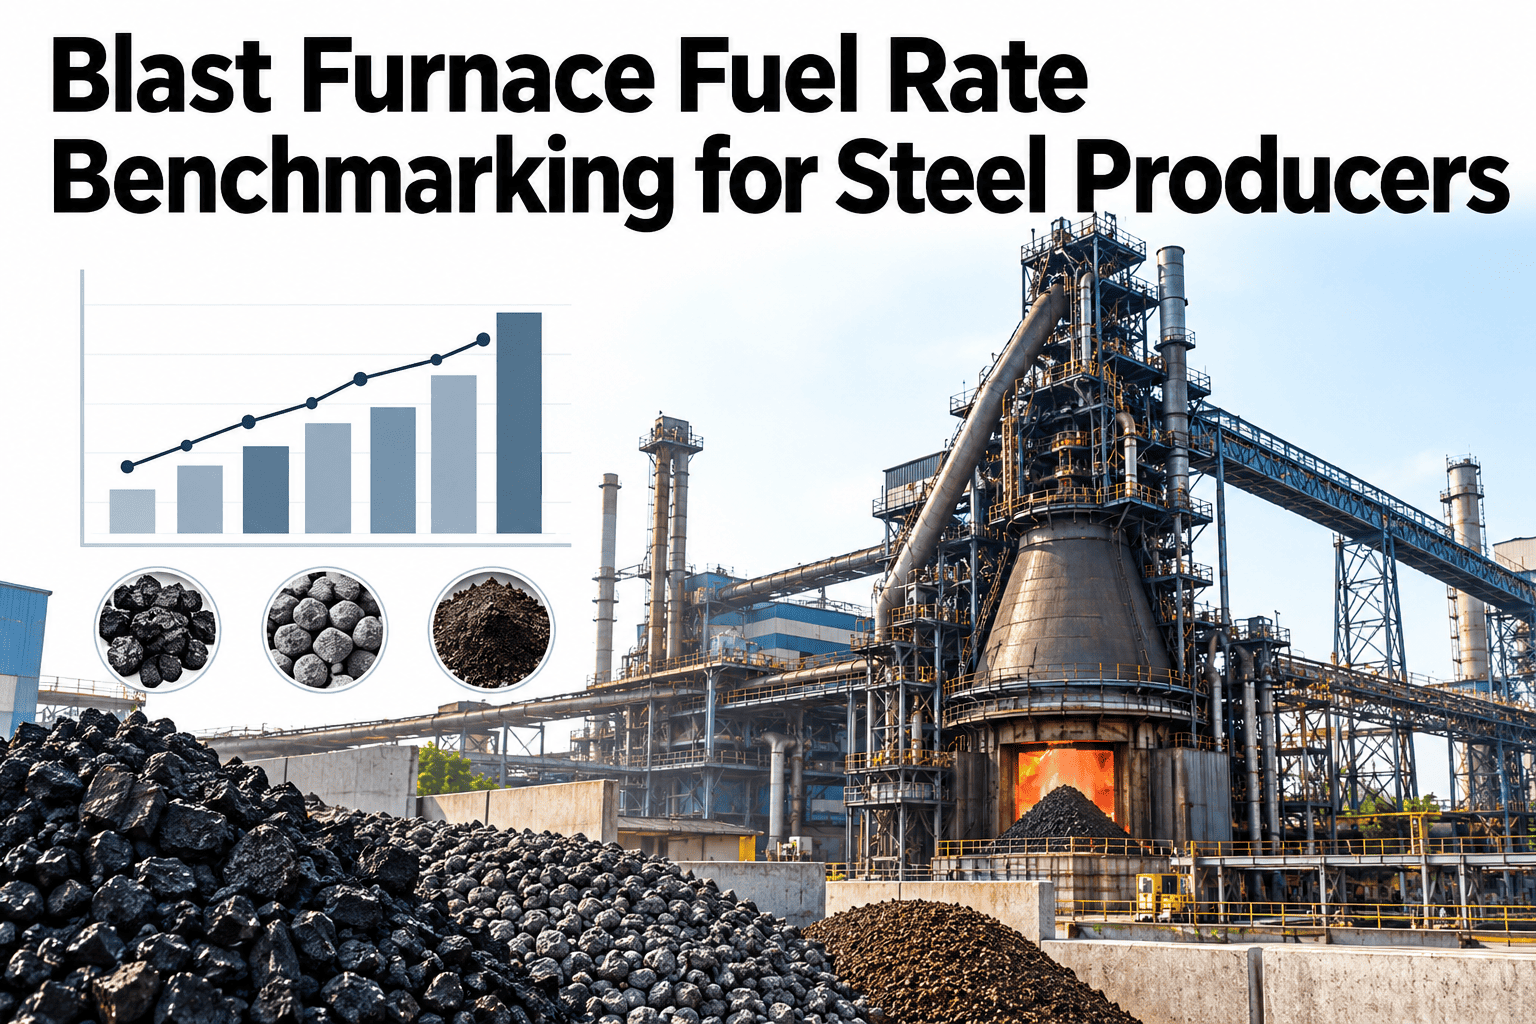
Every blast furnace team knows its fuel rate and almost none can say whether it is good. Comparing kilograms per tonne of hot metal across plants is easy to do and easy to get wrong, because furnace size, burden quality, blast conditions and the share of injected coal all move the number before operating skill is counted. A fair benchmark adjusts for the things a crew cannot change and leaves the gap that it can. Producers that want their own furnace compared on that basis can see a normalised fuel rate benchmark built from their own furnace data in a short session.
Compare Fuel Rates on a Level Field, Not on Raw Numbers
iFactory AI normalises blast furnace fuel rate for size, burden quality and injection level, so the gap to peers is the gap you can close.
Coke Rate Alone Misleads
Plants use different mixes of coke and injected coal. A low coke rate can simply mean heavy injection. The bars show three illustrative furnaces with the same total fuel and very different coke rates.
What to Normalise For
Some differences between furnaces are structural. The table lists the common adjustments and why each matters.
| Factor | Why It Moves Fuel Rate | How It Is Handled |
|---|---|---|
| Furnace size and design | Heat loss and gas distribution differ | Compare within a size class |
| Burden quality | Iron content and gangue set slag volume | Adjust for Fe, SiO2 and Al2O3 |
| Injection level | Coal replaces coke at a ratio below one | Use total reducing agent rate |
| Blast temperature and oxygen | Supply heat that coke would otherwise provide | Adjust for blast conditions |
| Coke quality | Strength after reaction affects permeability | Report with coke quality bands |
| Productivity and silicon | Thermal state and driving rate shift fuel use | Compare at similar levels |
Find Out What Is Structural and What Is Yours to Fix
Share a quarter of furnace operating and burden data. iFactory AI will separate the gap to peers into structural and controllable parts.
From Raw to Normalised: One Furnace
Normalisation is a sequence of adjustments. The steps below show an illustrative furnace, from its raw fuel rate to the figure that can be fairly compared, and teams can walk through each adjustment on their own furnace in a short session.
520
-8
-6
+4
510
Choosing a Fair Peer Group
A benchmark is only as fair as its peer set. Three rules keep the comparison honest.
Similar Furnaces
Group by working volume and design, not by country or company.
Same Basis
Define fuel rate, hot metal and time period identically for every plant.
Honest Data
Use measured, audited figures and state what was estimated.
Benchmarking Against Yourself
An internal benchmark is often more useful than an external one. The columns show an illustrative normalised fuel rate over ten months against the furnace's own best demonstrated level.
A Composite Scenario: A Gap That Was Half Structural
A producer found itself 30 units behind its peer median and set out to close the gap. The figures below are illustrative.
Where iFactory AI Fits
Furnace data, burden analyses and plant records sit in different systems. iFactory AI joins them and applies the adjustments consistently.
Normalisation Models
Adjustments for burden, blast, injection and size are built from your furnace data.
Peer Comparison
Compare against chosen peer groups on a stated, common basis.
Gap Decomposition
The gap is split into structural and controllable parts, with causes ranked.
Trend Tracking
Normalised fuel rate is tracked against your own best demonstrated level.
Expert Review: Reading a Fuel Rate Benchmark
Benchmarks create targets, so they must be right. This review sets out how experienced ironmaking engineers judge a comparison.
Frequently Asked Questions
What is a good blast furnace fuel rate?
There is no single number, because burden, size and injection all matter. A good rate is one that is low for your conditions and close to what your own furnace has shown it can do. External figures help as context only. Our team can help set a fair target for your furnace class and burden.
Where do benchmark data come from?
From published studies, industry associations, peer exchanges and your own history. Quality varies, and definitions often differ. Treat external data as indicative and check what each figure includes before using it. Your own normalised trend is the most reliable benchmark you have, since the data and the definitions are under your control.
How often should we benchmark?
Track the normalised rate continuously, and review the peer comparison quarterly or when conditions change, such as a new ore blend or a reline. Frequent external comparison adds little, because the structural position moves slowly. See a quarterly review pack built from furnace data in a short walkthrough.
Should coke quality be part of the benchmark?
Yes, as a context variable. Coke strength affects permeability and the achievable driving rate, so two furnaces with the same fuel rate and different coke quality are not equally efficient. Report coke quality bands alongside the fuel rate, and compare within similar bands where the data allows.
How does this link to cost and emissions?
Fuel rate is the largest controllable driver of hot metal cost and of furnace carbon emissions. Normalised gains therefore feed both. Ask how benchmark results roll into cost and carbon reporting in your plant scorecard.
Set the Fuel Target Your Furnace Can Actually Reach
See your furnace normalised, compared with peers and split into structural and controllable gaps. Book a working session with a blast furnace specialist.