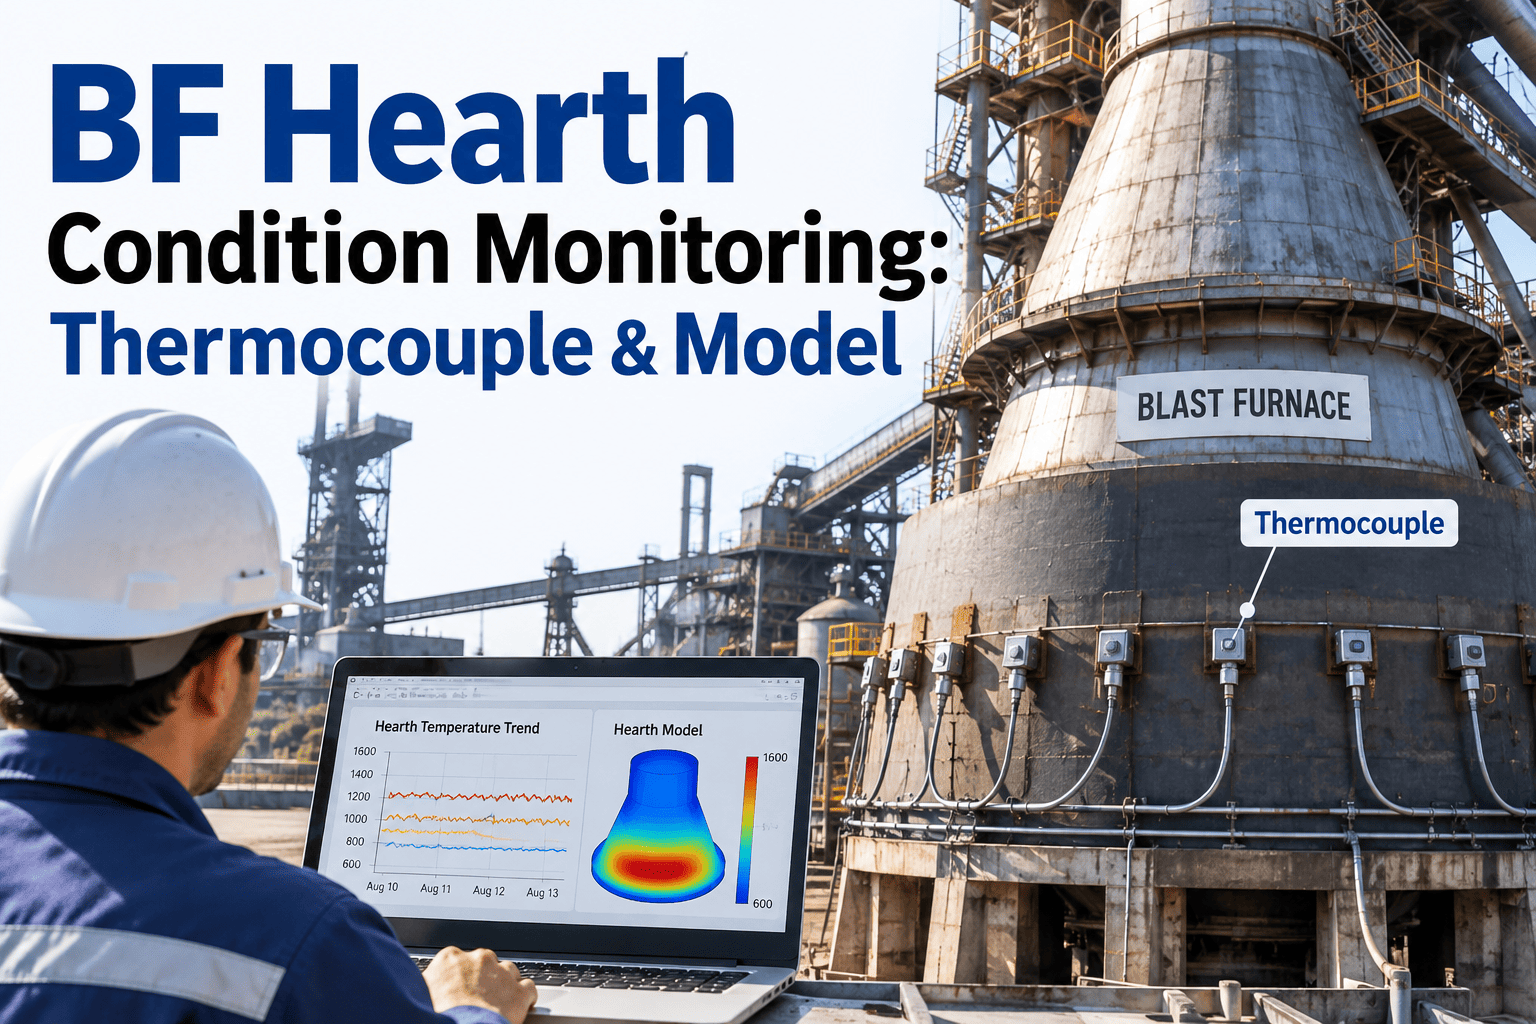
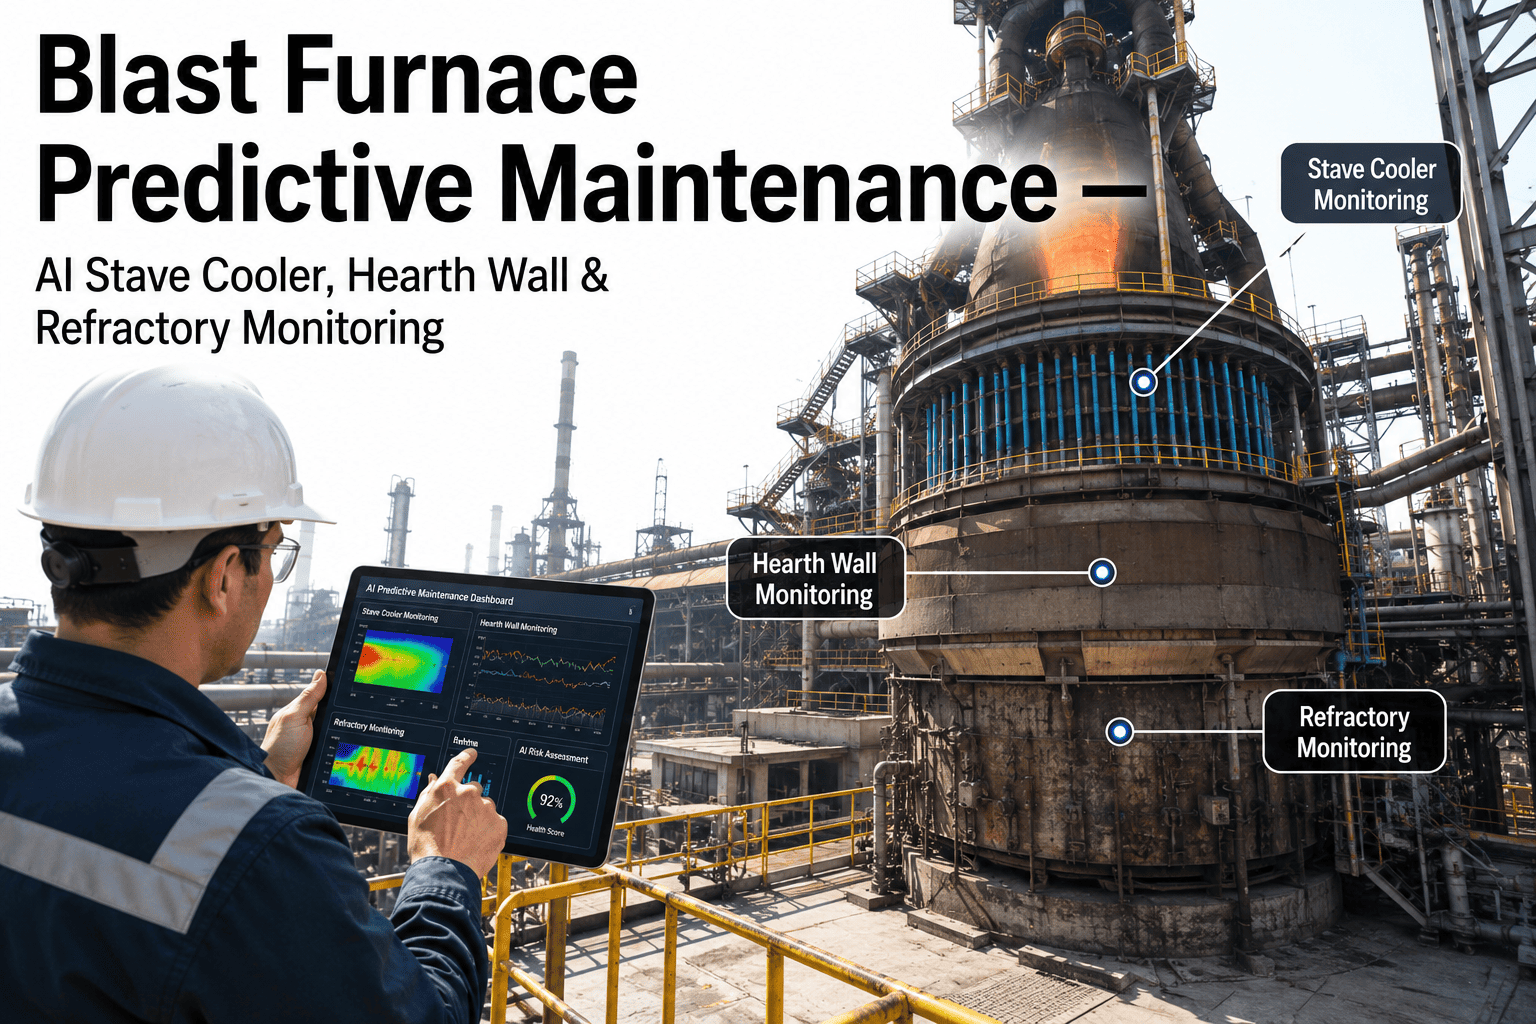
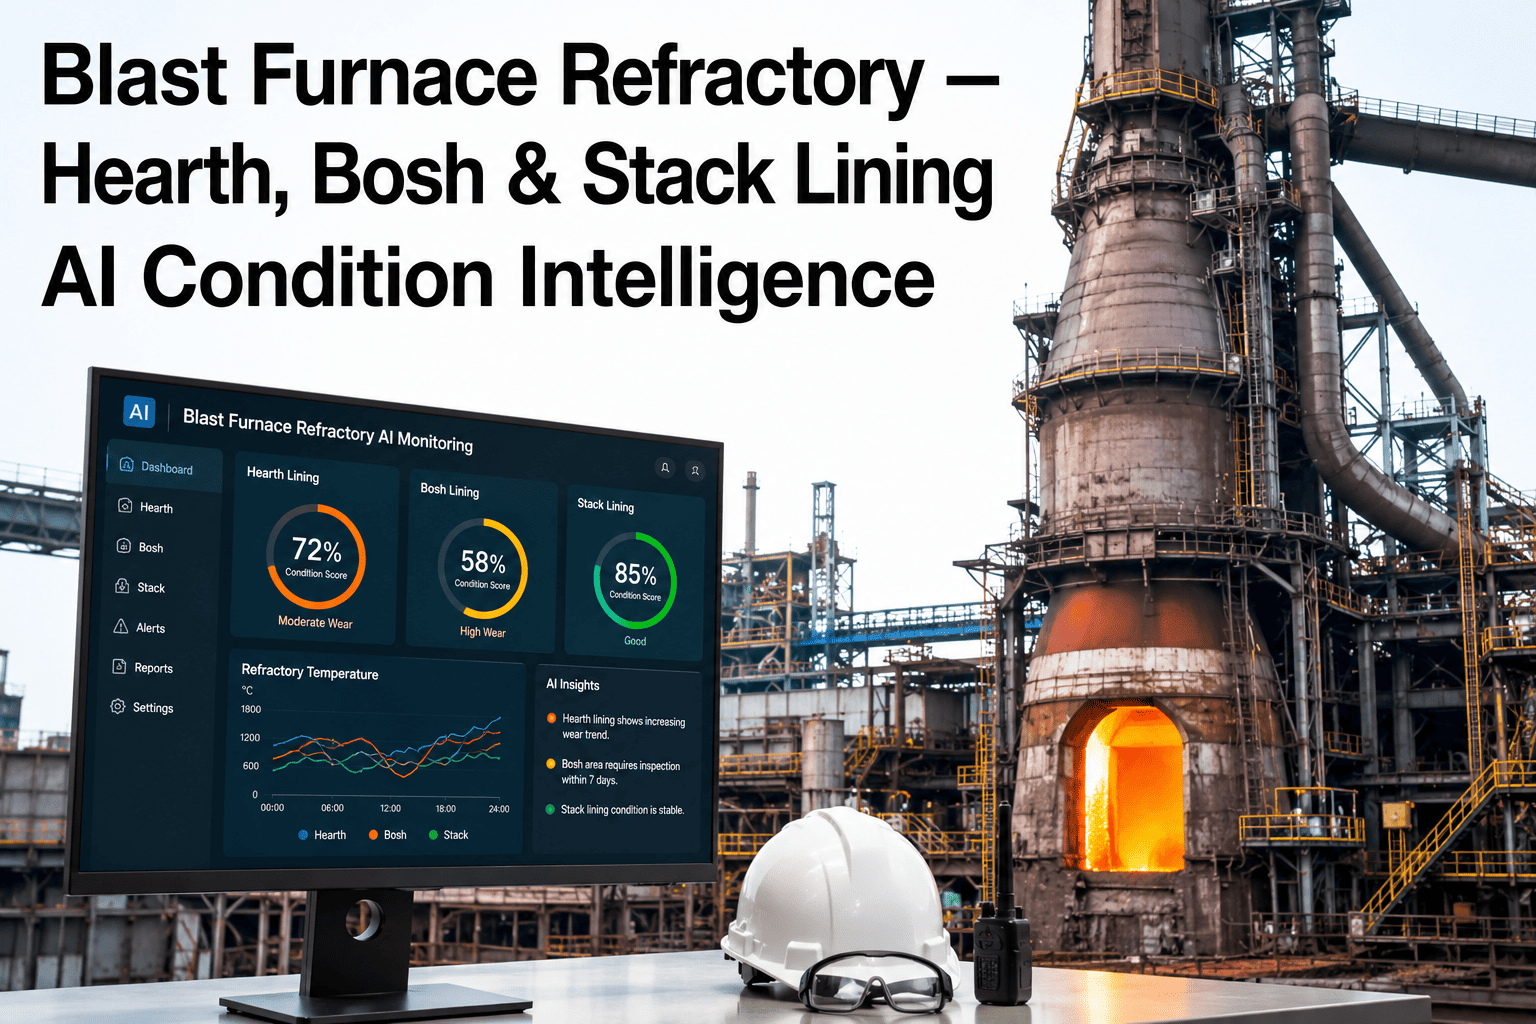
A blast furnace hearth carries no scheduled inspection window — the refractory lining sits behind molten iron and coke for years, invisible to any camera or human eye, wearing down one campaign day at a time. By the time erosion becomes visible on the outer shell, the wear behind it has usually been building for months, and the gap between a planned reline and an emergency shutdown almost always comes down to how early that wear was caught. Continuous thermocouple trending, skull tracking, and erosion modeling turn a hearth that could fail without warning into one that reports its own condition every shift. See how iFactory builds this into a full hearth safety program at our support desk.
BLAST FURNACE — HEARTH SAFETY
Hearth Condition Monitoring That Reads Erosion Before It Becomes an Emergency
Thermocouple trending, skull formation tracking, and remaining-brick-thickness modeling combined into one live hearth safety view — built to protect campaign life and keep operators ahead of a burn-through risk instead of reacting to one.
15–20 yrs
Typical campaign life target for a modern large-hearth blast furnace
30–45 days
Production downtime an unplanned hearth failure can force on the whole furnace
20–60
Thermocouples typically embedded across hearth pad and sidewall on a well-instrumented furnace
$15M+
Approximate cost range of a full hearth reline on a large blast furnace
Why Hearth Erosion Is the Blast Furnace's Silent Clock
The hearth is the one part of a blast furnace that cannot be opened, walked, or visually inspected while the furnace runs. Every other zone gets a probe, a camera, or a shutdown walkthrough at some point in the campaign. The hearth gets a temperature reading through several feet of carbon brick and nothing else — which is exactly why the reading has to be trusted completely.
SHELL
Steel Shell & Cooling Staves
The outermost boundary. A hot spot appearing here means erosion has already consumed the protective layers behind it — this is the alarm nobody wants to be reading for the first time.
SAFETY LINING
Backup Refractory Course
A secondary carbon or ceramic course installed specifically to hold a thermal gradient if the working lining is lost. Its remaining thickness is what most erosion models are ultimately trying to estimate.
WORKING LINING
Working Lining (Carbon Brick)
The primary hot-face brick, in direct contact with liquid iron circulation. This is the layer that erodes fastest and most unevenly, particularly near the tap hole and the corner radius.
SKULL
Protective Iron Skull Layer
A frozen layer of iron that can form on the hot face when conditions allow it, briefly protecting brick that would otherwise be exposed directly to circulating liquid metal.
Where Thermocouple Arrays Actually Sit
A hearth thermocouple array is only useful if it is dense enough to catch localized erosion, not just an average trend across the whole pad. Elephant-foot erosion — the classic failure pattern where the corner between the pad and the sidewall wears preferentially — can progress for a long time without moving the reading at the pad center at all.
PAD CENTER
Bottom Center Thermocouples
Vertical strings embedded beneath the pad center, reading upward through the carbon blocks. These give the earliest signal of general pad thinning and are usually the most stable reference series on the furnace.
PAD-WALL CORNER
Elephant-Foot Zone Sensors
Dense sensor spacing at the junction between hearth floor and sidewall, since this corner statistically erodes faster than either surface alone and drives most premature reline decisions.
TAP HOLE LEVEL
Tap Hole Ring Sensors
A ring of thermocouples surrounding each tap hole, since drilling, mud gun operation, and taphole repairs concentrate mechanical and thermal stress in this exact elevation more than anywhere else in the hearth.
MID-SIDEWALL
Sidewall Elevation Strings
Vertical strings up the sidewall at multiple elevations, tracking how the hot-face profile shifts over a campaign as circulation patterns and skull coverage change with age.
COOLING STAVES
Stave Return Water Sensors
Inlet and outlet temperature pairs on the cooling water circuit, cross-checked against refractory thermocouples to separate a genuine erosion signal from a cooling-system performance issue.
DEAD-MAN ZONE
Center-Well Reference Points
Readings associated with the coke dead-man zone, used mainly to interpret whether circulation patterns are pushing hot liquid iron toward the pad center or toward the sidewall corner.
Reading the Trend, Not the Temperature
A single thermocouple reading rarely means anything on its own. Hearth safety decisions are made from the shape of the trend line over weeks and months, cross-checked against the neighboring sensors on the same elevation and the same side of the furnace.
| Trend Pattern |
What It Usually Means |
Typical Response |
| Slow, steady rise over months |
Gradual, expected thinning of the working lining as the campaign ages |
Continue routine trending, update remaining-thickness estimate |
| Sudden step increase |
Loss of a skull layer or a localized refractory spall exposing hotter brick |
Cross-check adjacent sensors, review recent operating changes |
| Sharp drop after a rise |
New skull formation re-insulating the hot face at that point |
Confirm with neighboring readings, note as a protective event |
| Oscillation between two bands |
Repeated skull formation and dissolution cycling at that location |
Track cycle frequency, flag for closer erosion model review |
| Divergence from neighboring sensors |
Localized erosion pattern such as an elephant-foot or channeling |
Escalate to engineering review and adjust reline planning inputs |
Put Your Hearth Data Into a Live Safety View
iFactory connects directly to existing hearth thermocouple arrays and cooling water instrumentation, building a continuous trend, alarm, and remaining-thickness view without new sensor installation in most furnaces.
How Skull Formation Protects — and Deceives — the Hearth
Skull formation is the hearth's own defense mechanism, and it is also the reason raw temperature readings alone can be misleading. A well-formed skull can make a badly worn hearth look temporarily healthy, right up until the skull is lost and the true condition underneath is suddenly exposed.
1
Hot-face temperature drops locally
Cooling intensity or circulation change lowers the local hot-face temperature below the iron freezing point at that spot
2
A thin iron skull freezes onto the wall
Liquid iron solidifies against the exposed brick, forming a protective layer between the brick and the circulating hot metal
3
The thermocouple reading falls and stabilizes
The extra insulating layer lowers the sensor reading, which can look like an improvement rather than a temporary shield
4
Operating conditions shift and the skull erodes
A change in burden distribution, tap rate, or circulation pattern remelts or mechanically strips the skull away
5
The true brick condition is exposed again
The reading jumps back up to reveal how much working lining actually remains beneath the skull that had masked it
From Isotherms to Erosion Models
Turning a grid of temperature points into a defensible remaining-thickness number is where hearth monitoring earns its keep. Different modeling approaches answer slightly different questions, and most mature hearth safety programs run more than one in parallel.
Steady-State Heat Transfer
Uses known brick conductivity and cooling water performance to back-calculate the hot-face temperature and estimate how much working lining separates it from the measured thermocouple point.
Isotherm Mapping
Interpolates readings across the whole sensor array to draw a continuous erosion profile of the hearth, making localized thin spots visible even between individual sensor positions.
Remaining Brick Thickness Tracking
Converts trend data into an estimated remaining-thickness value over time, plotted against a minimum safe-thickness threshold set for that specific furnace design.
Elephant-Foot Progression Modeling
Focuses specifically on the pad-to-sidewall corner, tracking asymmetric wear that general pad-average models tend to underestimate until it is already advanced.
A Furnace Manager on What Actually Changed
"
For years our hearth review meant one engineer pulling a spreadsheet of raw thermocouple values once a shift and eyeballing whether anything looked different from the day before. That works fine until the day it doesn't, and the problem is you never know in advance which day that is going to be. What changed once we put continuous trending and an erosion model behind the same data was not that we suddenly saw new problems — the sensors were always there. It was that a slow six-week drift on one sidewall elevation, the kind that used to get lost in shift-to-shift noise, now shows up as a flagged trend within days. We caught an early elephant-foot pattern on furnace two nearly a full year before it would have shown up as a visible concern under our old review process, and that gave us time to adjust burden distribution and taphole practice rather than plan an early reline. The number that mattered most to the plant director was not a temperature reading at all — it was the extra months of confirmed campaign life that decision bought us.
— Furnace Operations Manager, Integrated Steel Plant · 19 Years Ironmaking Experience
What Changes Across the First Two Campaign Years
A hearth monitoring program does not replace metallurgical judgment — it gives that judgment better data to work from, and the improvement compounds as more campaign history builds up behind the model.
Months 1–3
Sensor integration and baseline capture
Existing thermocouple and stave water data is connected, cleaned, and used to establish a stable baseline trend for every monitored elevation and zone.
Months 4–9
Erosion model calibration
The isotherm and remaining-thickness models are tuned against known refractory design data and any available historical erosion measurements from past relines.
Months 10–18
Early anomaly detection proven out
Localized wear patterns and skull cycling events begin surfacing as flagged trends well before they would have registered on a manual shift review.
Year 2 and beyond
Reline planning built on confirmed data
Remaining-thickness trends across two-plus years of history support far more confident campaign extension or reline timing decisions than single-point readings ever could.
Frequently Asked Questions
Can thermocouple trending actually predict a hearth failure before it happens?
No monitoring system can predict the exact day a hearth would fail if left unaddressed, and that is not really the goal. The goal is to catch the wear pattern early enough that the furnace never gets close to that point — by giving operators months of advance warning on localized erosion instead of days. Combined with erosion modeling, continuous trending turns a slow, silent process into one that is visible and actionable well ahead of any safety threshold. You can
contact our team to review how this applies to your furnace's sensor layout.
Do we need to install new thermocouples, or can this work with our existing hearth instrumentation?
Most hearth monitoring deployments work directly with the thermocouple array and cooling water sensors already installed on the furnace. The focus is on turning that existing raw signal into continuous trending, alarms, and erosion estimates rather than adding new hardware. Additional sensors are only recommended where a specific coverage gap is identified during the initial data review, and never as a default requirement to get started.
How does the system tell the difference between skull formation and genuine cooling problems?
This distinction is made by cross-referencing the refractory thermocouple trend against the cooling stave water inlet and outlet temperatures at the same location and time. A drop caused by skull formation typically shows a stable or normal cooling water differential, while a drop caused by a cooling system issue shows an abnormal water-side reading. The model is built specifically to separate these two cases rather than treating every temperature drop as automatically protective.
How much campaign history is needed before the erosion model becomes reliable?
A usable baseline and early anomaly detection typically develop within the first several months of continuous data collection, since the model is comparing current trends against the furnace's own recent history rather than requiring years of data upfront. Confidence in absolute remaining-thickness estimates improves further as more campaign history and any available past reline measurements are incorporated, but the core safety value of early trend detection is available from very early in the deployment.
What does a typical hearth monitoring rollout look like from first contact to a live dashboard?
A rollout usually starts with a review of the furnace's existing sensor layout and historical data, followed by integration of live thermocouple and stave water feeds into a continuous trending view. Baseline calibration and initial anomaly rules follow shortly after, with the erosion model refined over the following months as more operating data comes in. To scope a rollout against your specific furnace design,
book a demo and our team will walk through the setup.
Give Your Hearth a Voice Long Before It Needs One
Hearth failures rarely arrive without warning — the warning is usually sitting in thermocouple data nobody trended closely enough. iFactory turns your existing sensor array into a continuous erosion and safety view, so slow wear gets caught in weeks instead of years and campaign planning is built on confirmed data instead of guesswork.
```