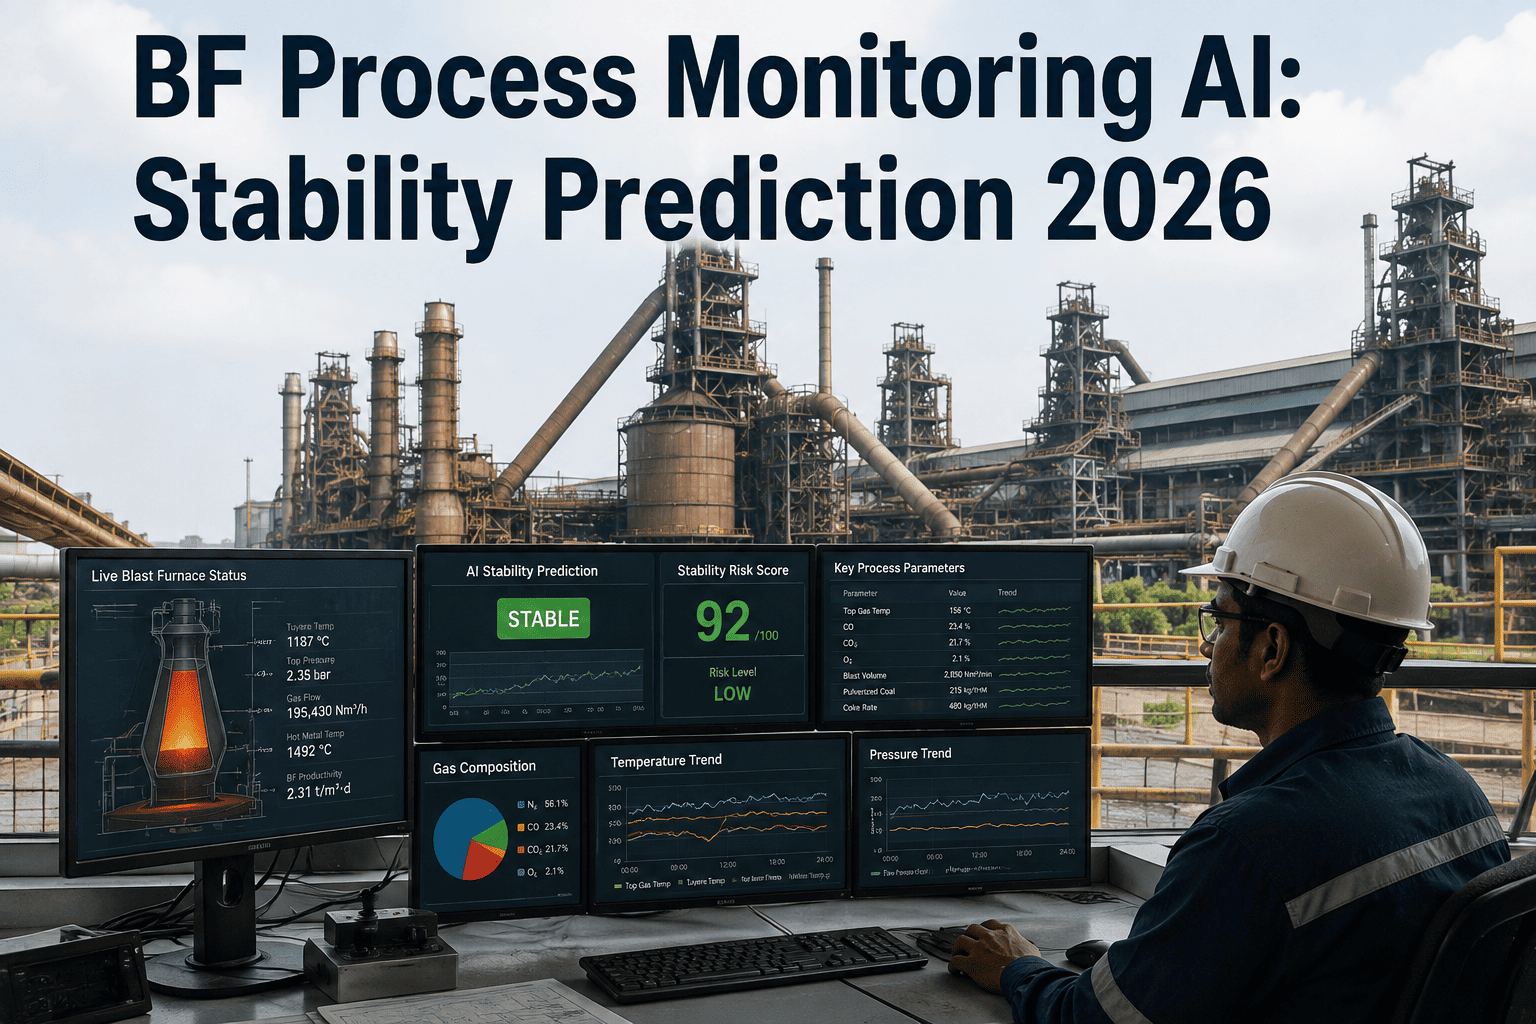
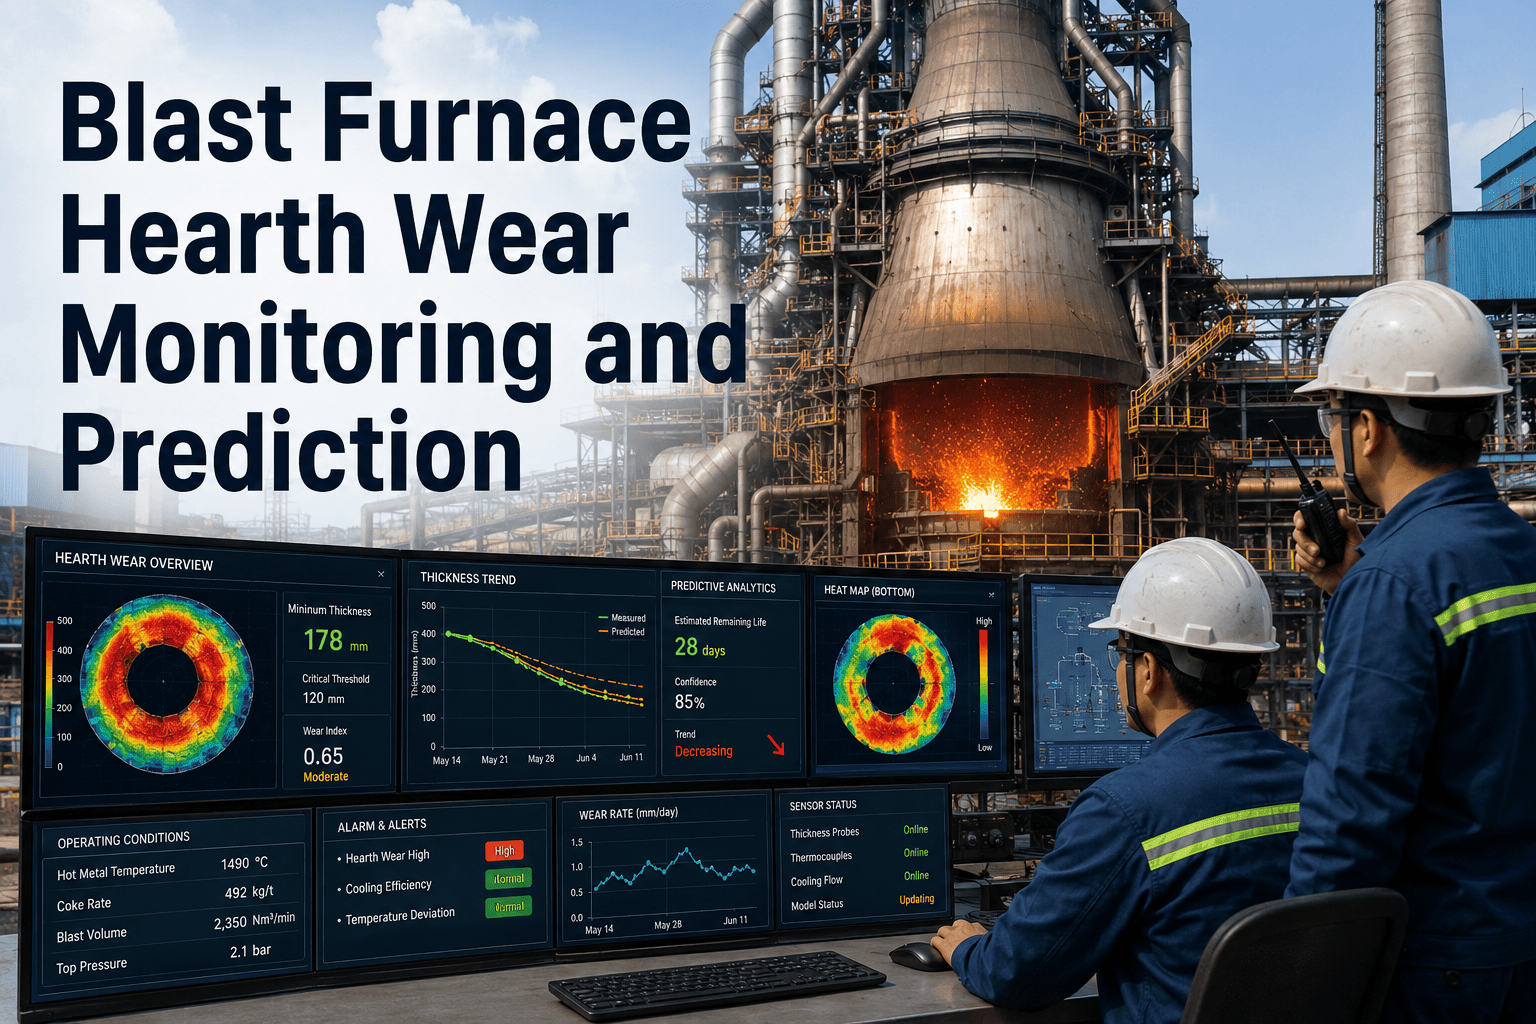
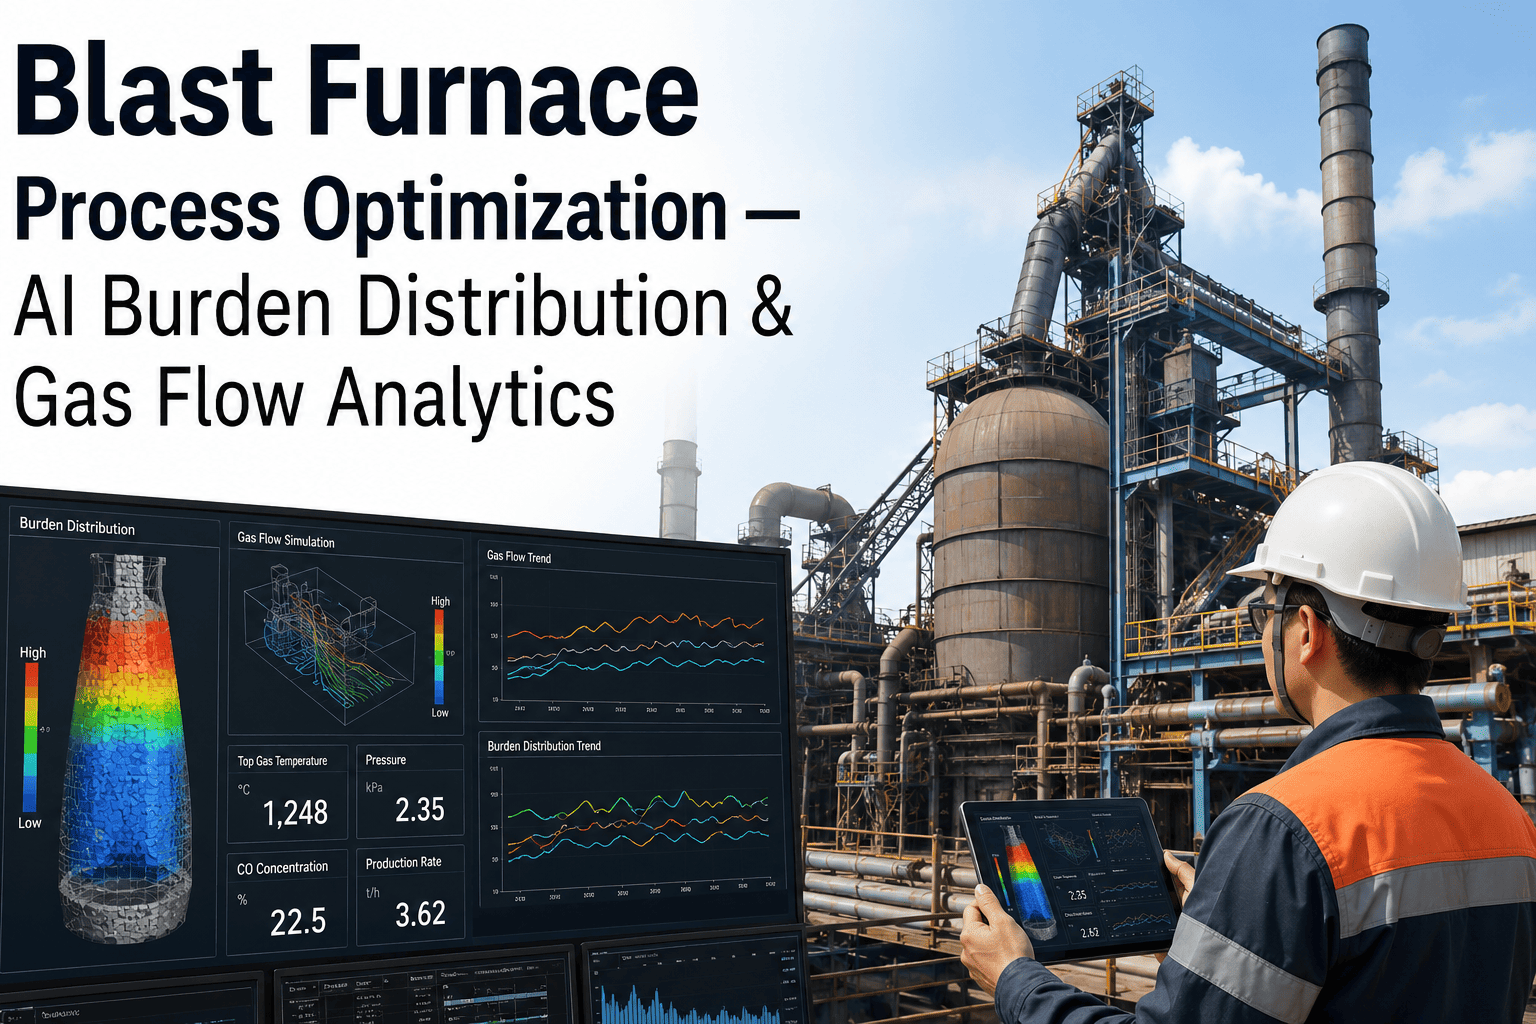
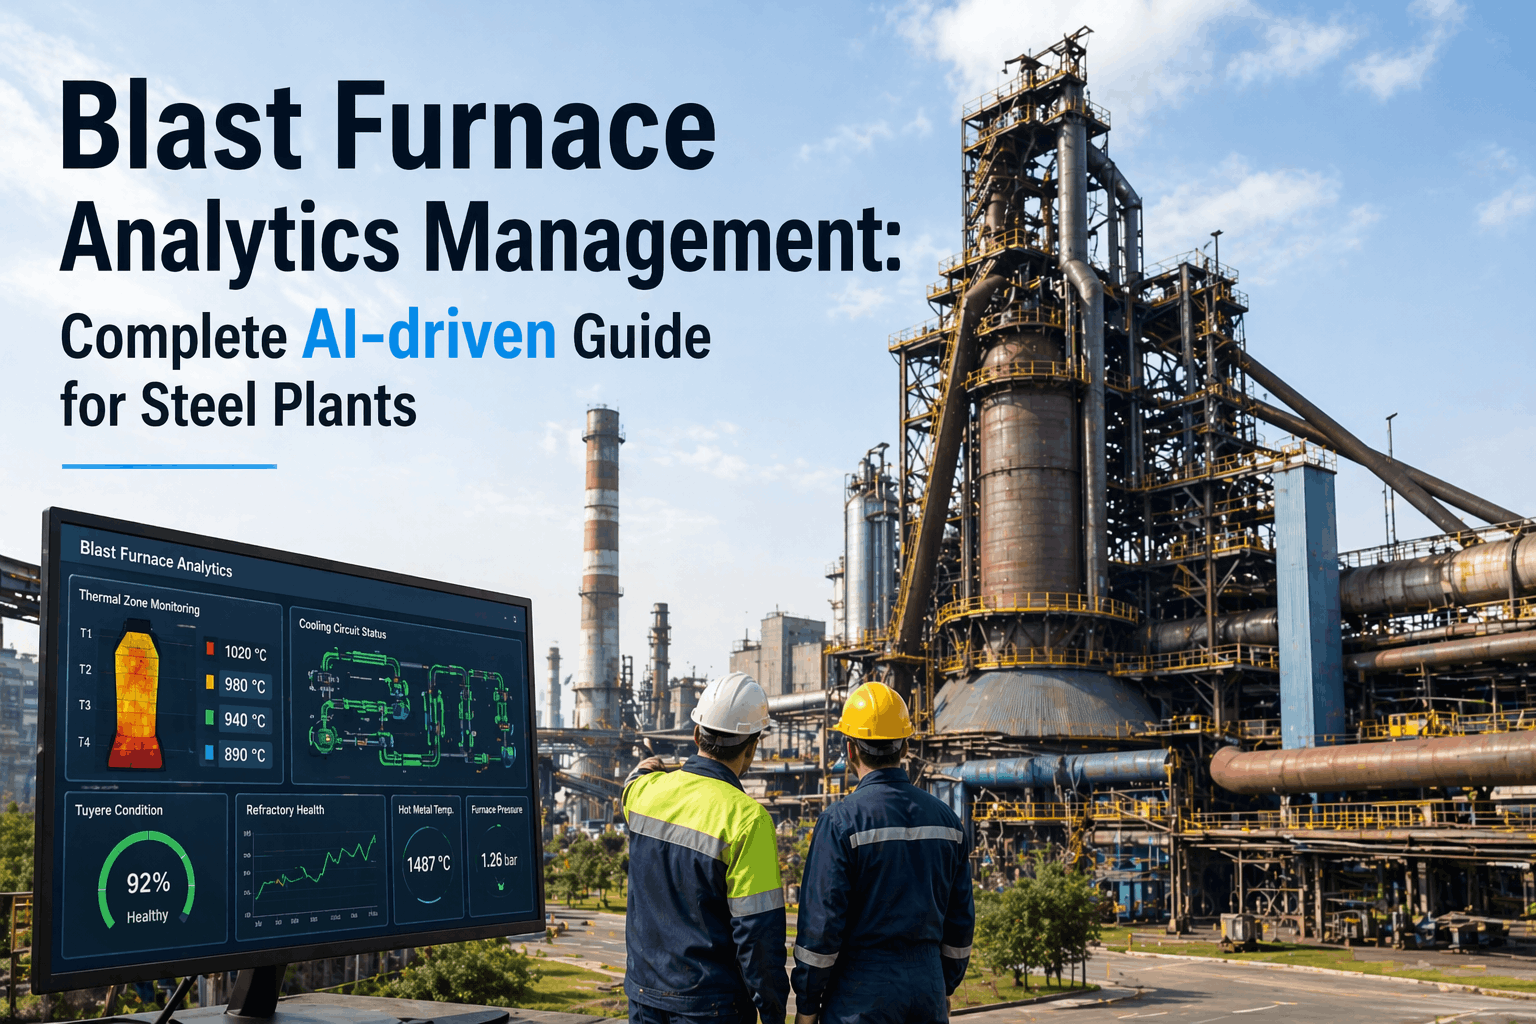
A blast furnace does not fail suddenly — it drifts. Burden distribution shifts a few percentage points, permeability tightens, gas flow starts channeling unevenly, and by the time an operator sees a slip or a hanging on the control room screen, the furnace has already been unstable for hours. Traditional process control reacts to single-variable alarms one at a time, which means the interaction between burden, blast, and thermal state — the actual root cause — is rarely visible until instability has already cost production. AI-based process monitoring changes the detection point by watching the relationships between dozens of variables simultaneously, flagging drift toward instability while there is still time to correct it. iFactory helps ironmaking teams build this kind of multi-variable early warning system, with setup detail covered at iFactory support.
Blast Furnace · AI Process Monitoring
Blast Furnace Process Monitoring With AI: Predicting Instability Before It Becomes a Slip or Hang
Multi-variable analysis across burden, blast, and thermal data to detect slip and hanging risk, gas flow imbalance, and thermal state drift before they interrupt production.
30-100+
Process variables an experienced BF operator is expected to track simultaneously
Hours
Typical lead time between the first drift signal and a visible slip event
Days
Production and fuel-rate recovery time often required after a serious hanging
Why Single-Variable Alarms Miss Instability
The Furnace Doesn't Fail on One Signal — It Fails on a Pattern
Conventional DCS alarms trigger when one variable crosses a fixed threshold, but instability in a blast furnace is almost always a combination effect — a small burden distribution shift combined with a blast moisture change combined with a slight cooling trend in the bosh. No single one of those crosses an alarm limit on its own, yet together they are the exact signature that precedes a hanging.
01
Threshold Alarms Fire Too Late
By the time a single variable crosses its alarm limit, the underlying instability has usually been building for several hours across multiple correlated signals.
02
Operators Can't Track Every Correlation
Even experienced operators cannot mentally cross-reference dozens of variables in real time across a full shift, especially during a busy tapping or charging sequence.
03
Every Furnace Drifts Differently
A stability signature that precedes a hang on one furnace campaign may look completely different on another, depending on burden design, campaign age, and lining profile.
Core Signal Groups
The Four Variable Groups an AI Stability Model Actually Watches
Charge weight, ore-to-coke ratio, distribution pattern from the bell-less top, and stockline level trends that indicate burden descent irregularity.
Blast volume, pressure, temperature, and moisture, cross-referenced against top gas pressure to detect early permeability loss.
Group 3
Gas Flow Distribution
Top gas temperature profile across the radial probes, used to detect channeling and uneven gas flow before it develops into a full hang.
Hot metal temperature, silicon content trend, and cooling stave heat flux, together indicating whether the furnace is trending hot or cold relative to target.
A Slip Event Costs More Than the Hours It Takes to Recover Production.
iFactory correlates burden, blast, gas flow, and thermal signals in real time to flag instability risk while there's still time for the operator to act.
Traditional vs AI-Assisted Monitoring
What Changes When Correlation Replaces Single-Point Alarms
Aspect
Traditional DCS Alarms
AI Stability Monitoring
Detection Basis
Single variable crossing a fixed threshold
Pattern across correlated variable groups
Lead Time
Minutes before a visible event
Hours before a visible event, in most cases
Furnace-Specific Tuning
Generic OEM setpoints across all furnaces
Model trained on this furnace's own historical drift patterns
Operator Workload
Manual cross-checking across many screens
Single consolidated risk score with contributing factors
Field Example
Catching a Channeling Pattern Two Shifts Before It Became a Hanging
An integrated steel producer running a mid-campaign blast furnace had experienced three unplanned hangings over the previous eighteen months, each requiring twelve to twenty-four hours of reduced production to recover stable operation and fuel rate. Post-event review consistently found that individual DCS alarms had not fired until the hanging was already visible in the pressure trace, leaving operators with almost no lead time to intervene.
After deploying an AI stability model trained on the furnace's own historical burden, blast, gas flow, and thermal data with iFactory, the system flagged an emerging channeling pattern in the top gas temperature profile roughly a day and a half before it would have historically progressed into a hang. The shift team adjusted burden distribution and blast parameters in response, and the furnace stabilized without a production interruption.
36 hrs
Lead time gained before the instability would have become visible
1 avoided
Hanging event prevented through early intervention
0 hrs
Production downtime from the flagged event
Frequently Asked Questions
What Ironmaking Teams Ask About AI Stability Monitoring
Does an AI stability model replace the operator's judgment?
No — the model is designed to surface a consolidated risk signal and the contributing variables behind it, not to make automated control decisions on its own. The operator still decides how to respond, whether that means adjusting burden distribution, blast parameters, or tap timing, but they make that decision with hours of additional lead time and a clearer picture of which variable group is driving the risk. To see how the risk scoring is presented to operators,
book a demo.
How much historical data does the model need before it becomes useful?
A meaningful baseline typically requires several months of historical process data covering a range of operating conditions and, ideally, a handful of past instability events for the model to learn what a genuine drift pattern looks like on that specific furnace. Furnaces with detailed historical logging of burden, blast, gas flow, and thermal data can often be onboarded faster than furnaces relying on manual shift logs.
Will the model work the same way after a reline or major burden change?
A significant change to burden design, lining profile, or campaign stage shifts the furnace's normal operating pattern, so the model's baseline needs to be retrained or recalibrated against the new post-change data rather than continuing to apply pre-change patterns. Treating a reline as a natural retraining checkpoint keeps the model's risk scoring accurate rather than flagging normal post-reline behavior as anomalous.
What is the difference between a slip and a hanging, and does the model distinguish them?
A hanging is a temporary interruption in burden descent, while a slip is the sudden, often violent release of that hung burden once it gives way, typically accompanied by a pressure spike. Because the two are closely related in cause, a well-trained stability model tracks the same underlying gas flow and permeability signals for both, with the goal of catching the early hanging risk before it can progress to a slip event at all.
How does iFactory integrate with our existing DCS and Level 2 systems?
iFactory reads process data directly from the existing DCS or Level 2 historian rather than requiring new field instrumentation in most cases, correlating burden, blast, gas flow, and thermal tags into a single stability risk view that sits alongside the existing control room screens. To walk through the integration approach for your specific DCS and historian setup,
book a demo.
Give Your Operators Hours of Warning, Not Minutes.
AI-correlated burden, blast, gas flow, and thermal monitoring built to catch instability before it becomes a slip, a hang, or a lost shift.